 Tanushree Jaiswal
Weekly Outlook on NATURAL GAS ...
by
Sachin Gupta
19/04/2024

Natural gas prices tumbled more than 3% on Thursday after storage data from the government said that inventories of heating fuel were 17% higher than a year ago. According to the EIA weekly report, utilities drew a lower-than-forecast 100bcf, or billion cubic feet from the U.S natural gas storage last week.
The TTF price, Europe’s benchmark, slipped on Monday to the lowest level since September 2021, and Europe looks confident that there will not be gas shortages this winter. However, the race to ensure supply for next winter hasn’t even started in earnest yet. Prices are set to hold higher than before the Russian invasion of Ukraine through the summer as Europe will face stiffer competition from Asia for liquefied natural gas supply.
Overall, the price crashed badly and lost two-thirds of its value over the past two months. The March gas sank to a 20-month low of $2.34 after the previous storage report on Feb.3. On a monthly basis, the price has dropped more than 13% to trade at $2.36 in Feb. and reached its two-year low. The price has moved below the important Trendline support on the monthly chart. All the key indicators are showing bearish trends in the counter for the near term. On the downside, it has a support at around $2.105 and $1.803 levels, while on the upside; there is a resistance at $2.780 and $3.023 levels.
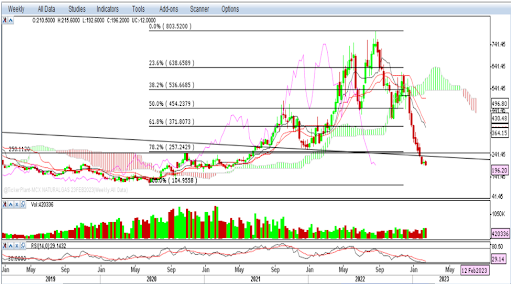
On the MCX front, prices have plunged more than 14% in recent months and traded below 78.2% Retracement Levels. Prices shifted below all the important Moving Averages and the Ichimoku Cloud formation. Higher volumes in the falling prices are clearly indicating the bearish sentiments among the traders. A momentum indicator, RSI, is in oversold territory with negative crossover on a weekly chart that suggests some pullback move but no positive indication in price action. On the downside, the price may find support at 178/165 levels, while on the upside, it has a resistance at 223 and 256 levels.
So, based on the above aspect, we are expecting a bearish move in natural gas prices for the coming week and it may continue further until we get any positive trigger in the price action. Hence, one can look for a sell-on rise strategy for the near term.
|
MCX Natural Gas (Rs.) |
NYMEX Natural Gas ($) |
|
|
Support 1 |
178 |
2.105 |
|
Support 2 |
165 |
1.803 |
|
Resistance 1 |
223 |
2.780 |
|
Resistance 2 |
256 |
3.023 |
Disclaimer: Investment/Trading in securities Market is subject to market risk, past performance is not a guarantee of future performance. The risk of loss in trading and investment in Securities markets including Equites and Derivatives can be substantial.


