Nifty PE ratio below 5-year average, but PB ratio nearing 5-year highs

As Indian stock market participants debate on whether it is over-valued or not, there are some indicators we may look at or better understanding. Nifty price-to-earnings (PE) ratio is one such indicator even though there are multiple actors to be considered while calculating the market valuation.
The Nifty price-to-earnings (PE) ratio today stands at 26.59 multiples even as the Nifty 50 share index is trading near its all-time high of 17,379.65, which it reached last week. Many market commentators
believe that the Nifty 50 index is over valued at 17500 levels and a crash is impending.
In terms of fundamental reasons, Indian stocks markets have been on a stellar track helped by ample global liquidity, easing lockdown regulations on the back of accelerated vaccination drive and improved
domestic economic growth. Weak US jobs data also seemed to have raised hopes that US government will continue with its liberal policy and economic support.
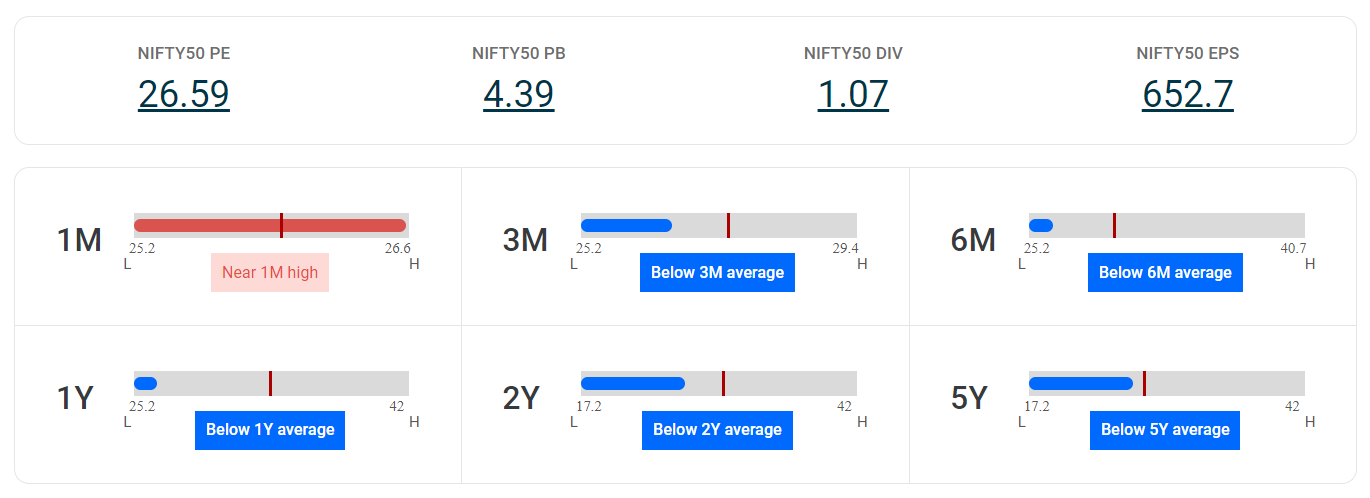
Nifty PE ratio is still below 5-year average
Nifty PE ratio at 26.59 is way lower than the 5-year high of 42 multiples and slightly lower than the 5-year average of 27.44. The Nifty PE ratio is also lower than the 1-year average of 33.55 and 2-year average of 29.88. Nifty PE ratio is a key indicator to read while understanding the valuation of Indian stock market. PE is short for the ratio of a company's share price to its per-share earnings. To calculate the P/E, you simply take the current stock price of a company and divide by its earnings per share (EPS). P/E Ratio = Market
Value per Share/Earnings per Share (EPS).
Nifty PE ratio moved between a high of 42 and low of 25.21 during the past one year. While on a 5-year basis, Nifty 50 PE ratio moved between a high of 42 and low of 17.15, data from Trendlyne showed.
Does Nifty 50 PE ratio indicate just valuation?
Many market watchers use the Nifty PE ratio to decide on whether the market is overvalued, cheaper or just right. In that sense we have seen a high Nifty PE ratio of 42 in February 2021 when the index reached 15000 levels for the first time. Since then, Indian companies have seen good growth on earnings and we see the Nifty PE ratio more reasonable around 26 multiples. There is also a methodology change in
the calculation. Now Nifty PE ratio is calculated based on consolidated earnings of companies from standalone EPS earlier.
At this stage the market watchers are divided on whether Nifty PE ratio indicates just valuation. Many believe, accelerated economic recovery and ample global liquidity will help both markets and
companies to see positive upside. The other camp believes that from now onwards there will be moderate returns from Indian markets and in case of any global risk off event liquidity will dry up.
Investors should not consider Nifty PE ratio as the only indicator to calculate market valuation but rather look at multiple factors and ratios while deciding on Nifty 50 valuation.
Many old timers quote historical chart and say that Nifty is in the oversold zone when Nifty PE ratio is below 14, while it is overvalued when PE ratio crosses 22. However in the last 17 months the markets have rallied in a different circumstance and a higher sustained PE remained acceptable on hopes of economic recovery and company earnings besides healthy capital inflows.
Nifty PB ratio is still near 5-year high
Another indicator Nifty price-to-book (PB) ratio at 4.39 however near all-time high of 4.48. In the last 5 years it moved between a range of 2.17 and 4.48. The Nifty price to book or Nifty PB value measures the
enterprise value of the company. Many consider Nifty PB value to be more stable than Nifty PE ratio when the market is volatile. Higher PB ratio also indicates that one is paying more in case the value goes
down. From a historical perspective Nifty is seen to be in the oversold zone when Nifty PB is below 2.5 and overvalued range when PB ratio is over 4.
Share Market Today
| Indices Name | Price | Price Change (% change) |
|---|---|---|
| S&P ASX 200 | 7555.80 | -82.3 (-1.08%) |
| CAC 40 | 8023.26 | 0 (0%) |
| DAX | 17837.40 | 0 (0%) |
| Dow Jones | 37775.38 | 22.07 (0.06%) |
| FTSE 100 | 7877.05 | -5.78 (-0.07%) |
| Hang Seng | 16184.02 | -201.85 (-1.23%) |
| US Tech Composite | 15606.50 | -81.87 (-0.52%) |
| Nikkei 225 | 37109.13 | -970.57 (-2.55%) |
| S&P 500 | 5011.12 | -11.09 (-0.22%) |
| Gift Nifty | 21871.00 | -144 (-0.65%) |
| Shanghai Composite | 3062.00 | -12.22 (-0.4%) |
| Taiwan Weighted | 19594.33 | -706.87 (-3.48%) |
| US 30 | 37504.60 | -224 (-0.59%) |
Start Investing in 5 mins*
Rs. 20 Flat Per Order | 0% Brokerage
