 Tanushree Jaiswal
Weekly Outlook on Gold - 05 Ap...
by
Sachin Gupta
05/04/2024

The cost of natural gas saw a 2.7% increase yesterday, closing at 146.90, as projections of limited feed gas demand and milder weather tempered upward momentum. Despite concerns over a significant storage surplus and reduced demand forecasts for the next fortnight, substantial price shifts were notably absent. This trend persisted despite decreased production resulting from reduced drilling activities following a price drop in February and March, and forecasts indicating colder weather ahead.
In the United States, gas rig operations continued to decline, reaching 109 active rigs, marking the lowest level since January 2022. Additionally, gas output in the Lower 48 states fell to 98.8 billion cubic feet per day (bcfd) in April, down from 100.8 bcfd in March, according to data from financial firm LSEG.
The COMEX natural gas price has recently been in a bearish trend over the past few weeks. On a weekly timeframe, the price has consistently traded below the trendline, with the Relative Strength Index (RSI) showing a negative crossover. Looking at the daily chart, a Doji candlestick formed on Thursday, suggesting indecision among traders. Support levels are identified around $1.48 and $1.25, indicating potential areas where downward movement could stabilize. Conversely, resistance levels are noted at $1.97 and $2.15, signifying points where upward movement could face significant challenges.
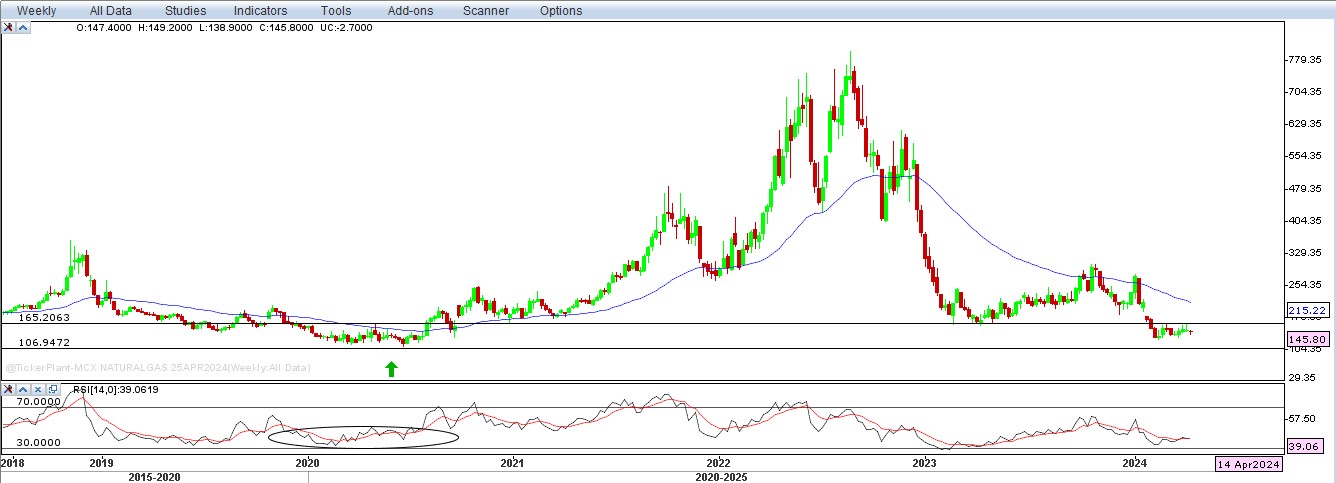
Domestically, MCX natural gas price trend aligns below the Ichimoku Cloud and near a Bollinger Band, indicating a bearish momentum for the short to long term. In additions, Prices are trading below the 200-days Exponential Moving Averages and rising trendline, the momentum reading suggests negative crossover with lower volume. Support is evident at Rs.128 and 115 levels, with resistance at Rs.165.
In summary, natural gas prices navigated through a complex landscape influenced by supply-demand dynamics, weather forecasts, and production trends. Investors may closely monitor upcoming weather patterns and production data for further insights into the trajectory of natural gas prices.
|
MCX Natural Gas (Rs.) |
NYMEX Natural Gas ($) |
|
|
Support 1 |
128 |
1.48 |
|
Support 2 |
115 |
1.25 |
|
Resistance 1 |
165 |
1.97 |
|
Resistance 2 |
186 |
2.15 |
Disclaimer: Investment/Trading in securities Market is subject to market risk, past performance is not a guarantee of future performance. The risk of loss in trading and investment in Securities markets including Equites and Derivatives can be substantial.


