2.1 Application on Asset classes

Think technical analysis as attempting to ride a bicycle. Once you’ve mastered the balance, pedaling, and steering, you can ride any kind of bike, mountain, road, or electric. Similarly, once you understand how to read price charts, patterns, and indicators, you can apply that knowledge to any asset class-stocks, commodities, currencies, bonds, you name it.
Practically any asset with historical price data such as the open, high, low, close and volume, quantified over a given time period with the same tools and techniques is analyzable. These parameters collectively form what is referred to as TA.
The ability of working with price data is what differentiates technical analysis from any other analysis, including fundamental analysis.
A fundamental analysis changes more with an asset class than any other methods.
- With equities, the study of financial statements, earnings, and estimating the overall company health is a requirement.
- For agricultural commodities such as coffee and pepper, the analysis involves the study of weather patterns, the cycles of harvest, and global demand and supply.
- The same analysis also applies to the economic and geopolitical factors pertaining to energy and metals.
2.2 Principles of Price Action

Price action refers to the movement of a security’s price over time. It is the foundation of technical analysis and represents the most direct reflection of market behaviour. Rather than relying on external data such as financial statements or macroeconomic indicators, price action focuses on how buyers and sellers interact in the market. This interaction is captured through price charts, which reveal patterns, trends, and potential turning points.
There are three core principles that guide the study of price action:
- Price Reflects All Available Information
The first principle assumes that the current market price incorporates all known and anticipated information. This includes earnings results, economic data, geopolitical developments, and investor sentiment. Since the market continuously processes new information, the price is considered a comprehensive and real-time indicator of collective expectations. As a result, technical analysts prioritize price movements over external news or reports.
Suppose a company is about to release its quarterly earnings. A few days before the announcement, the stock starts rising steadily. Even though the earnings report hasn’t been published yet, market participants may already be anticipating strong results based on insider activity, analyst expectations, or industry trends. When the actual earnings are released and they match expectations, the stock may not move much further because the good news was already “priced in.”
This shows how the market often reacts in advance, and why technical analysts focus on price rather than waiting for news.
- Prices Tend to Move in Trends
The second principle is based on the observation that prices often move in identifiable directions for extended periods. These movements are categorized as uptrends, downtrends, or sideways trends. Once a trend is established, it is more likely to continue than to reverse immediately. Identifying the direction and strength of a trend allows traders to align their positions with the prevailing market momentum, improving the likelihood of favourable outcomes.
Conversely, if the stock had been forming lower highs and lower lows, it would signal a downtrend, and a trader might look for opportunities to sell or short the stock. In both cases, recognizing the trend early and trading in its direction increases the probability of a successful outcome, which is the essence of this principle in price action analysis.
- Historical Patterns Tend to Repeat
The third principle is rooted in the idea that market Behavior is influenced by human psychology, which tends to be consistent over time. As a result, certain price patterns appear repeatedly in different market conditions. These patterns, such as double tops, flags, and triangles, are studied to anticipate future price movements. By recognizing these recurring formations, traders can make informed decisions based on historical precedents. Let us understand with the help of example.
Suppose the stock of ABC Ltd. begins trading at ₹200 in January. Over the next three months, it consistently forms higher highs and higher lows, gradually climbing to ₹280 by March. This sustained upward movement, visible on a candlestick chart, indicates an uptrend. A technical analyst observing this trend might use a moving average or trend line to confirm the direction and look for buying opportunities during temporary pullbacks such as when the price dips to ₹260 before resuming its rise.
Now consider a different scenario: XYZ Ltd. has been declining from ₹500 to ₹400 over a two-month period, forming lower highs and lower lows. This pattern signals a downtrend. A trader might wait for a minor rally to ₹420 and then enter a short position, anticipating that the price will continue falling in line with the established trend.
Price Action principles highlight the vital role of chart types, they are the lens through which price behavior is seen and understood. Since price action relies on identifying trends, patterns, and turning points based on historical price movements, the choice of chart becomes crucial in how clearly these elements are perceived. Different chart types such as line charts, bar charts, and candlestick charts offer varying levels of detail and visual clarity, each catering to specific analytical needs. Understanding these chart formats allows traders to better capture the nuances of price behavior, making it easier to apply the core principles of price action effectively in real-world trading scenarios.
2.3 Trade Summary

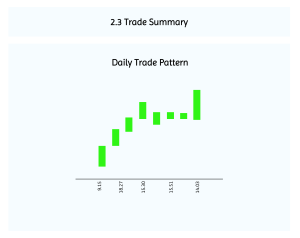
Imagine a stock named Infosys Industries trading on the Indian stock exchange. The market opens at 9:15 AM, and the first trade for Infosys executes at ₹320, this becomes the Open Price. As the day progresses, investor optimism drives the price up to ₹340, which marks the High Price for the session. Later, due to some intraday profit booking, the stock dips to ₹310, establishing the Low Price. Toward the end of the session, buying interest returns, and the stock closes at ₹335, this is the Close Price.
Now, consider that thousands of trades occurred throughout the day at various price points between ₹310 and ₹340. Tracking each of these trades individually would be overwhelming and unnecessary for most traders. Instead, summarizing the day’s activity using just the four key data points Open, High, Low, and Close (OHLC), provides a concise and meaningful snapshot of the stock’s behavior.
For example, the fact that Infosys opened at ₹320 and closed at ₹335 suggests a positive trading day, indicating bullish sentiment. The high and low prices show the range of volatility and help traders assess risk and potential breakout or support levels. These OHLC values are then plotted on charts especially candlestick or bar charts to analyze patterns, trends, and market psychology.
This method of summarizing price action is not only efficient but also essential for technical analysis, as it allows traders to focus on significant price levels rather than getting lost in the noise of every individual trade.
2.4 Key Takeaways

- Technical Analysis (TA) studies price and volume to understand market behavior and forecast future movements.
- It rests on three core beliefs: market discounts everything, prices move in trends, and history repeats itself.
- TA is not about predicting the future—it’s about identifying high-probability trading setups.
- Crowd psychology drives price patterns, and TA helps decode these emotional cycles.