8.1 The Engulfing Pattern

Single candlestick patterns, like the hammer, shooting star, and Doji which we already discussed in previous chapters are formed by just one candle and offer quick insights into potential reversals or indecision, ideal for short-term analysis. In contrast, multiple candlestick patterns involve two or more candles and provide a more refined view of momentum shifts, making them more reliable for positional trading. Examples include the bullish and bearish engulfing patterns, morning star, and evening star, which reflect evolving buyer-seller dynamics over time. Let’s understand each of them in detail.
An engulfing pattern is a two-candle reversal signal commonly used in technical analysis to identify potential turning points in price trends. It occurs when a larger candle completely “engulfs” the body of the previous smaller candle, indicating a strong shift in market sentiment. This pattern can be either bullish or bearish, depending on the direction of the engulfing candle and the preceding trend.
When this pattern appears at the bottom of a downtrend, it’s known as a Bullish Engulfing. Here, the first candle is bearish, showing continued selling pressure, but the second candle opens lower and closes significantly higher, overpowering the previous day’s losses. This suggests that buyers have stepped in with strength, potentially reversing the trend upward. On the other hand, when the pattern forms at the top of an uptrend, it’s called a Bearish Engulfing. In this case, the first candle is bullish, but the second opens higher and closes much lower, engulfing the prior candle and signaling that sellers may be taking control.
8.2 Bullish Engulfing Pattern
A bullish engulfing pattern typically appears after a downtrend. The first candle is bearish (usually red), showing continued selling pressure. The second candle opens lower but closes significantly higher, completely covering the body of the previous candle. This suggests that buyers have taken control, overpowering the sellers, and may signal the beginning of an upward move. Traders often look for confirmation in the next candle before entering a long position.
For example observe the chart below
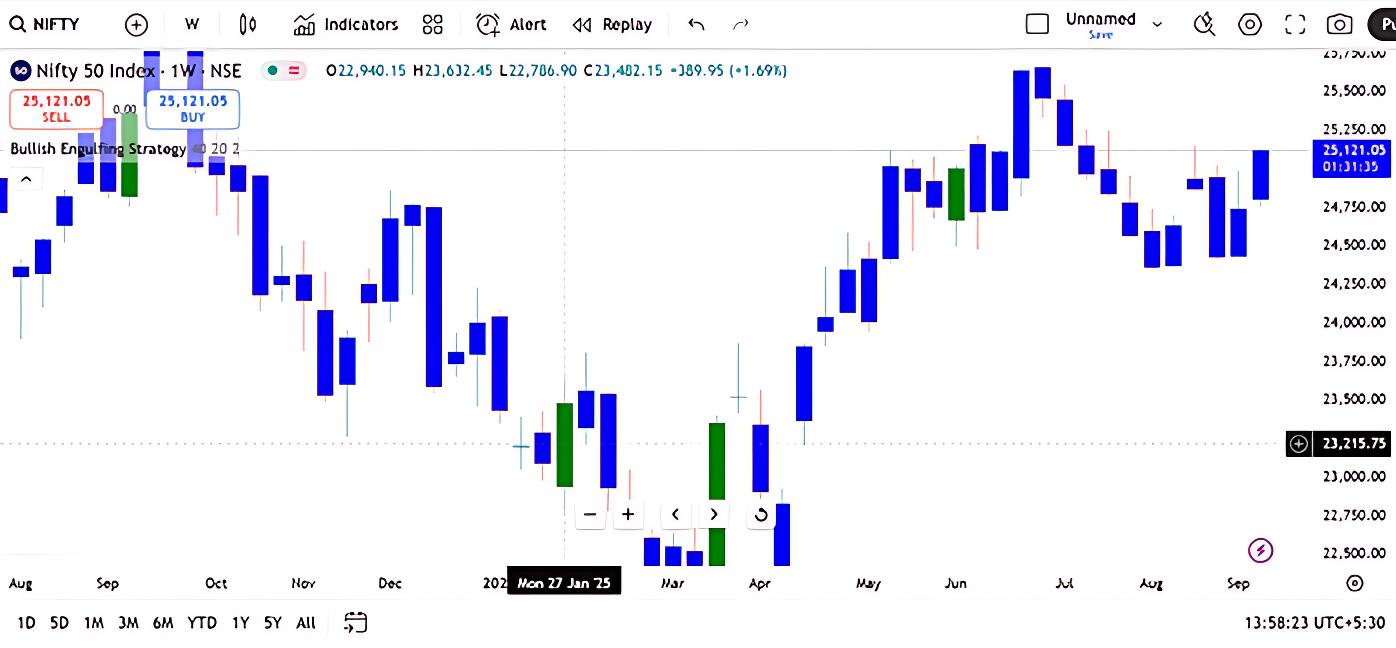
Based on the chart, the candlestick pattern formed around 27th January 2025 appears to be a Bullish Engulfing pattern
Here’s what confirms it:
- The prior trend should be a downtrend, indicating sustained selling pressure in the market.
- The first day of the pattern (P1) should be a blue candle, reconfirming the bearish sentiment.
- The candle on the second day of the pattern (P2) should be a green candle, long enough to completely engulf the body of the blue candle, signaling a potential bullish reversal.
The bullish engulfing pattern is a strong reversal signal that unfolds over two trading sessions, typically after a sustained downtrend
On Day 1 (P1), the market continues its bearish tone. The stock opens low, makes a new low, and closes weak—forming a blue candle. This reconfirms that sellers are still in control.
On Day 2 (P2), the stock opens near P1’s close and initially tries to push lower again. But at the day’s low, buyers step in aggressively, reversing the trend. The price rallies and closes above P1’s open, forming a long green candle that completely engulfs the body of the previous blue candle. This engulfing action signals that bulls have taken charge with conviction.
This sudden shift often rattles the bears, who weren’t expecting such a strong comeback. The long green candle reflects not just buying interest, but a psychological shift, where sellers begin to doubt their dominance. As a result, bullish momentum is likely to continue over the next few sessions, making it a potential buying opportunity.
Now how will a Risk Taker and Risk Averse trader take decisions. Lets understand with an example. We already know Arjun as risk taker and Aakash as risk averse trader in our previous chapters
So Let us understand how will Trade be setup in case Bullish Engulfing candlestick pattern is formed
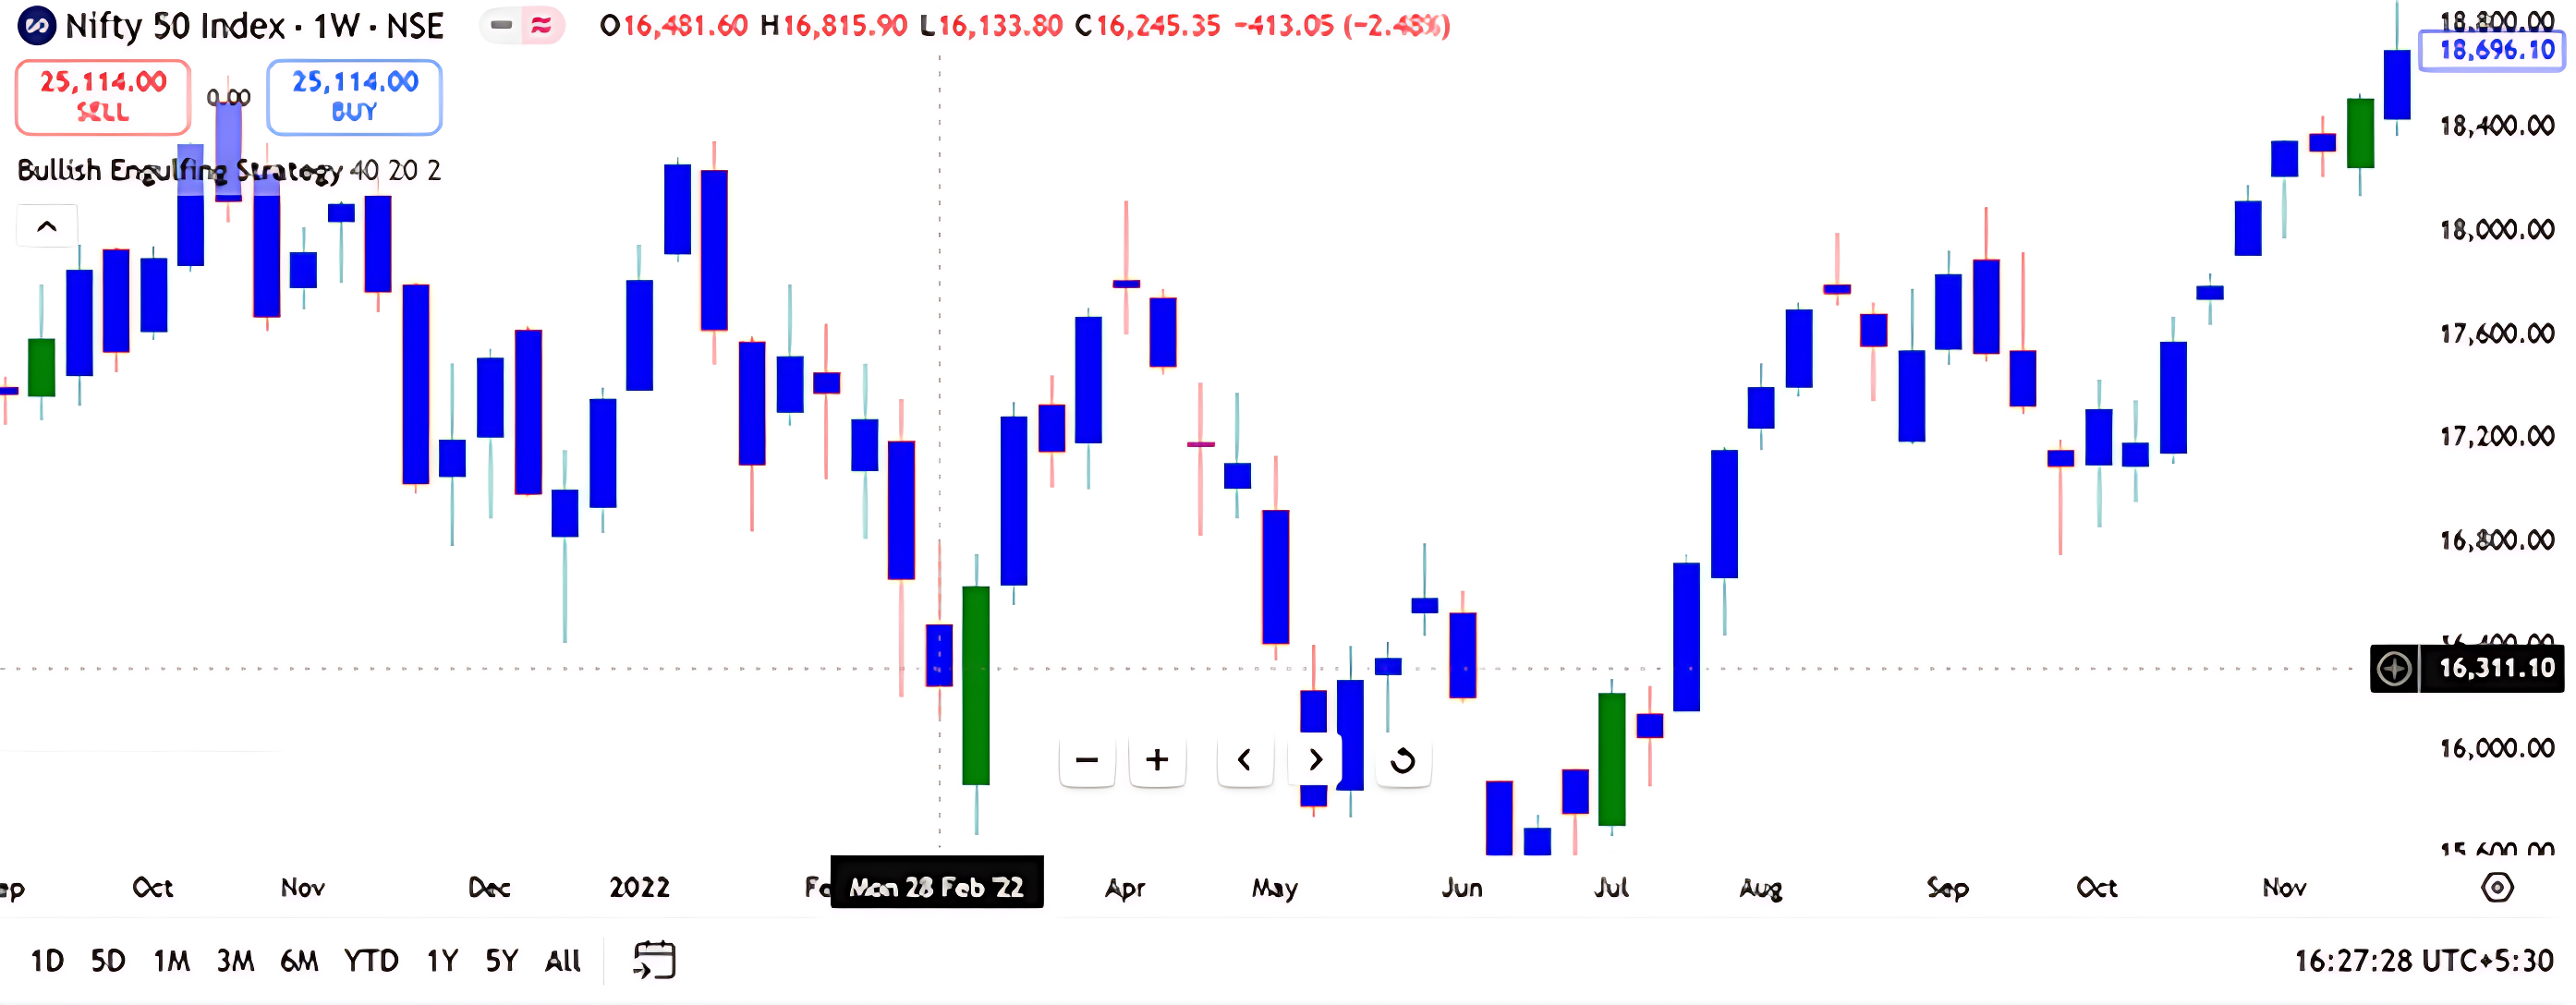

From the above charts lets understand the OHLC Data
For P(1) i.e on 28th Feb 2022
Open : 16481.60
High :16815.90
Low: 16133.80
Close :16245.35
For P(2) i.e on 7th March 2022
Open : 15867.95
High : 16757.30
Low : 15671.45
Close:16630.45
The trade setup for a bullish engulfing pattern revolves around identifying a strong reversal signal and acting on it with a clear entry and risk management strategy. This pattern unfolds over two sessions, P1 the bearish candle and P2 the bullish engulfing candle.
For a risk taker like Arjun, the ideal entry is on P2 itself, at the close price of ₹16,630. But before entering, it’s important to validate that P2 truly qualifies as a bullish engulfing pattern. Two conditions must be met:
- At 3:20 PM on P2, the current market price should be higher than P1’s open, this confirms bullish strength. In our example the current market price is 16630.45 which is higher than P1s opening i.e 16481.60
- The opening price of P2 should be equal to or lower than P1’s close, this ensures that the candle started from a weaker point and reversed with conviction.
A risk-averse trader Aakash, on the other hand, waits for confirmation. They initiate the trade the day after P2, but only if that day forms a green candle. For example, if P1 was a Monday, P2 would be Tuesday, and the risk-averse entry would happen on Wednesday around 3:20 PM, provided the candle is green. However, as discussed earlier, in multi-candle setups like this, it’s often more rewarding to act on the pattern completion day itself (P2), especially when the engulfing signal is strong.
The stop loss for this trade is placed at the lowest low between P1 and P2, which in this example is ₹15,671.45, recorded on P1. This protects the trader from unexpected reversals and keeps the risk defined.
Once the trade is active, the trader can either wait for the target to be hit or trail the stop loss upward to lock in profits as the price moves favorably. This setup blends candlestick psychology with disciplined execution, making it a powerful tool in a trader’s strategy kit. In this example, both the risk averse and the risk taker would have been profitable.
Small Activity For You

The chart highlights a Bullish Engulfing pattern during the uptrend. This pattern typically occurs when a small red candle is followed by a larger green candle that completely engulfs the previous one.
Question: If you’re a trader and you spot this Bullish Engulfing pattern during a pullback, what could be a reasonable interpretation?
- A) Trend reversal to bearish
- B) Continuation of the downtrend
- C) Potential bullish reversal or continuation of uptrend
- D) Market indecision
Correct Answer: C) Potential bullish reversal or continuation of uptrend
Why: A Bullish Engulfing pattern often signals strong buying pressure and can indicate the end of a pullback within an uptrend.
8.3 Bearish Engulfing Pattern

A bearish engulfing pattern is a two-candle formation in candlestick charting that signals a potential reversal from an uptrend to a downtrend.
This pattern typically appears after a sustained upward move. On Day 1 (P1), the market forms a small bullish candle,prices open low and close higher, showing continued buying interest. Then comes Day 2 (P2), where the market opens higher than P1’s close, but sellers take control and push the price down sharply. The candle closes below P1’s open, forming a large bearish candle that completely engulfs the body of the previous bullish candle.
The psychology behind this is crucial: bulls were in control, but the sudden and forceful selling on P2 suggests that bears have not only returned—they’ve taken over. This reversal in sentiment often rattles buyers and can lead to further downside in the sessions that follow.
For traders, the entry point is usually around the close of P2, once the engulfing is confirmed. The stop loss is placed just above the high of P2, protecting against false signals.

Traders respond to this setup will be based on their individual risk appetite. A risk-taker like Arjun may choose to initiate the trade on the second day (P2) itself, but only after validating two specific conditions:
- first, the opening price on P2 must be higher than the closing price of P1;
- second, by 3:20 PM on P2, the current market price should be lower than P1’s opening price.
If both conditions are met, it strengthens the case for a valid bearish engulfing pattern and justifies a same-day short entry. On the other hand, a risk-averse trader Aakash prefers to wait for additional confirmation and will only enter the trade on the day after P2, provided that day forms a red candle, indicating continued bearish momentum. While the nature of the pattern lends itself to quicker action, the choice between immediate and delayed entry ultimately depends on the trader’s comfort with risk and their trading style. In the above example both risk taker and risk reverse trader would have been profitable.
8.4 Presence of Doji

This chart presents a classic example of how combining candlestick patterns with market psychology can reveal powerful trading opportunities. The initial phase shows a strong uptrend, clearly dominated by bullish sentiment.
On P1, a solid blue candle reinforces this momentum, giving bulls further confidence. However, P2 introduces a critical shift: although the market opens higher and reaches a new high, selling pressure intensifies dramatically, resulting in a bearish engulfing pattern. This candle closes below P1’s opening price, sparking the first signs of panic among bulls.
The following day, P3, opens weakly but not alarmingly so. Yet, the market fails to sustain both its highs and lows, eventually closing flat and forming a Doji, a classic signal of indecision. This sequence is crucial: panic on P2 followed by uncertainty on P3 creates a fragile emotional setup. Such a combination often precedes a sharp reversal, which is confirmed by the long red candle that follows.
What’s especially valuable in this analysis is the methodology, rather than isolating individual candles, we’ve layered patterns and interpreted sentiment across multiple sessions to build a comprehensive view of market behavior. This approach not only enhances predictive accuracy but also deepens a trader’s understanding of how emotions shape price action.
Small Activity For You
The chart shows a Bearish Engulfing pattern around June 2024, followed by a visible downtrend.
Question: If you’re a trader and you spot this Bearish Engulfing pattern near a recent high, what could be a disciplined next step?
- A) Enter a long position immediately
- B) Wait for a bullish confirmation
- C) Consider shorting or tightening stop-losses on long positions
- D) Ignore the pattern—it’s unreliable
Correct Answer: C) Consider shorting or tightening stop-losses on long positions Why: A Bearish Engulfing pattern near a peak often signals a potential reversal. Managing risk by tightening stop-losses or preparing for short opportunities is a prudent move.
8.5 Piercing Pattern
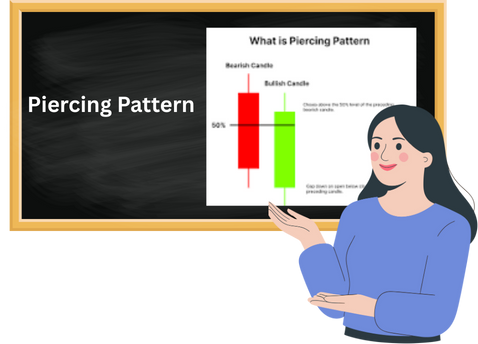
The piercing pattern is closely related to the bullish engulfing pattern, but with a subtle difference in how much the second candle overlaps the first. In a bullish engulfing, the second candle (P2) which means the green candle, completely engulfs the body of the first candle (P1), which is red. This means P2’s open is lower than P1’s close, and its close is higher than P1’s open. In a piercing pattern, P2’s candle partially penetrates P1’s body. The key condition is that P2 must close above the midpoint of P1’s body, but not fully engulf it.
First, find the range of P1’s body: Range = P1 Open – P1 Close
For example, if P1 opened at ₹100 and closed at ₹88, the range is ₹12.Then, ensure P2’s close falls within this range: P2 Close – P2 Open should be at least 50% of P1’s range, but less than 100%. So in our example, P2’s body should be between ₹6 and ₹12. This partial recovery signals buying interest but not full dominance—making it a more cautious bullish signal than a full engulfing.
Here Arjun, the risk-taker, sees this as a green light. He’s likely to enter a long position immediately, possibly even before confirmation from the next candle. Arjun thrives on momentum and is comfortable with short-term volatility, so he might set a tight stop-loss just below the recent low and aim for a quick upside move, especially if volume supports the reversal.
Whereas Aakash, the risk-averse trader, takes a more cautious stance. While he acknowledges the bullish signal, he waits for additional confirmation. Aakash prefers higher probability setups, so he may only enter if the broader trend aligns and risk-reward is favorable. Alternatively, he might set this one out, especially if macro conditions or news sentiment are uncertain.
Here is a chart below where even though candlestick pattern is formed but it cannot be considered as piercing pattern

In the image, the second candle opens within or above the body of the first red candle i.e P2 doesn’t open below P1’s low. For a piercing pattern, the open must be a gap down—below P1’s low, to show initial bearish sentiment that gets reversed intraday.In this case, P2’s blue candle covers slightly less than 50% of P1’s red candle body, which falls short of the minimum requirement for a valid piercing pattern. Therefore, this setup does not qualify.

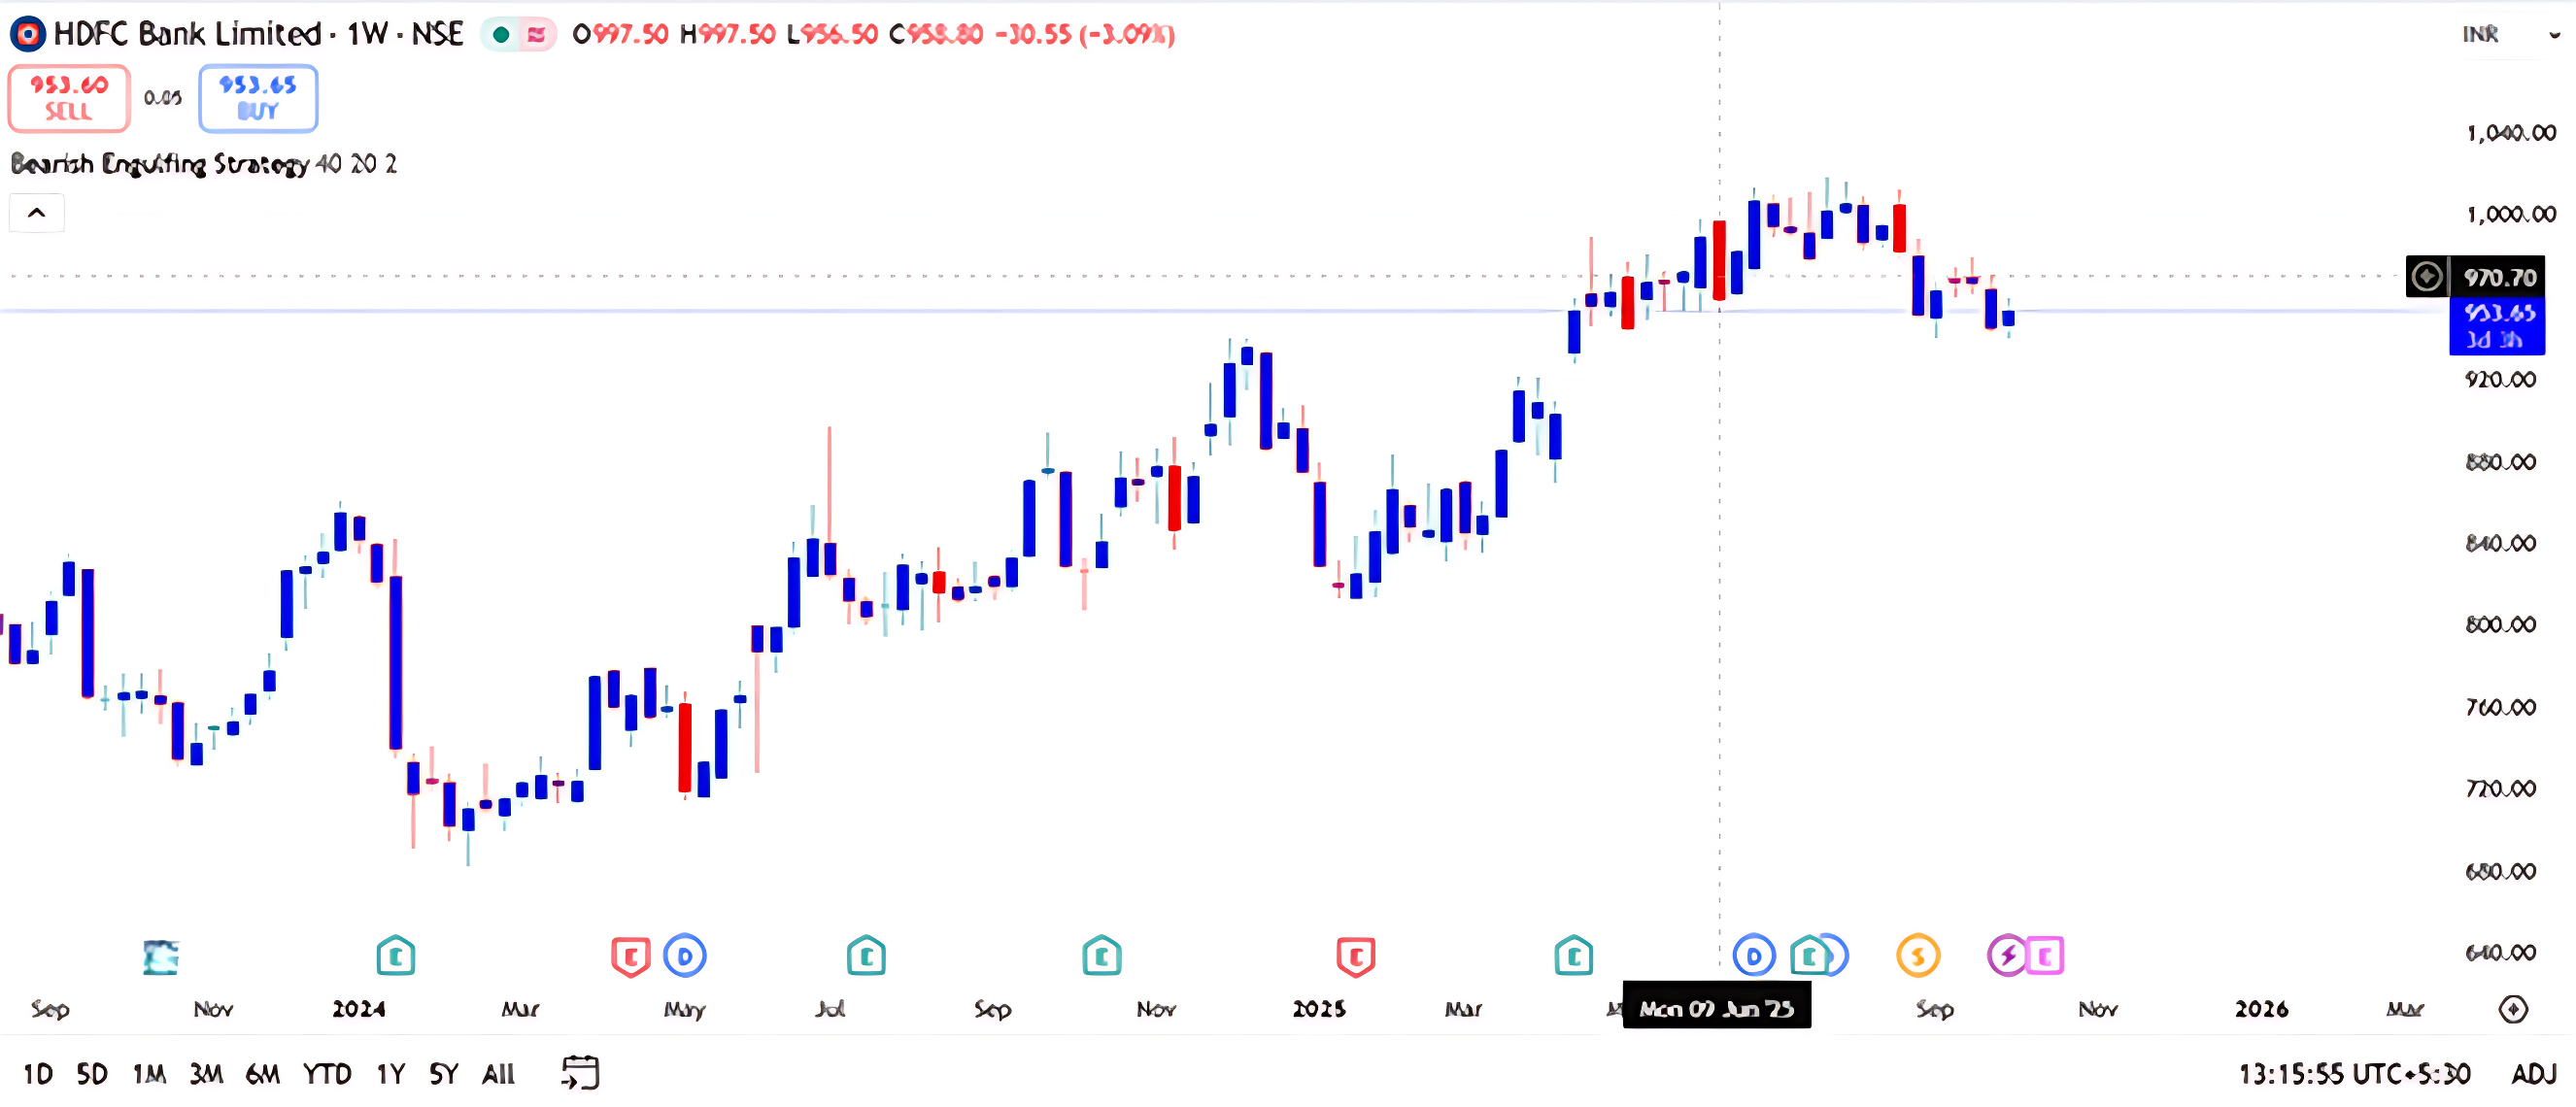
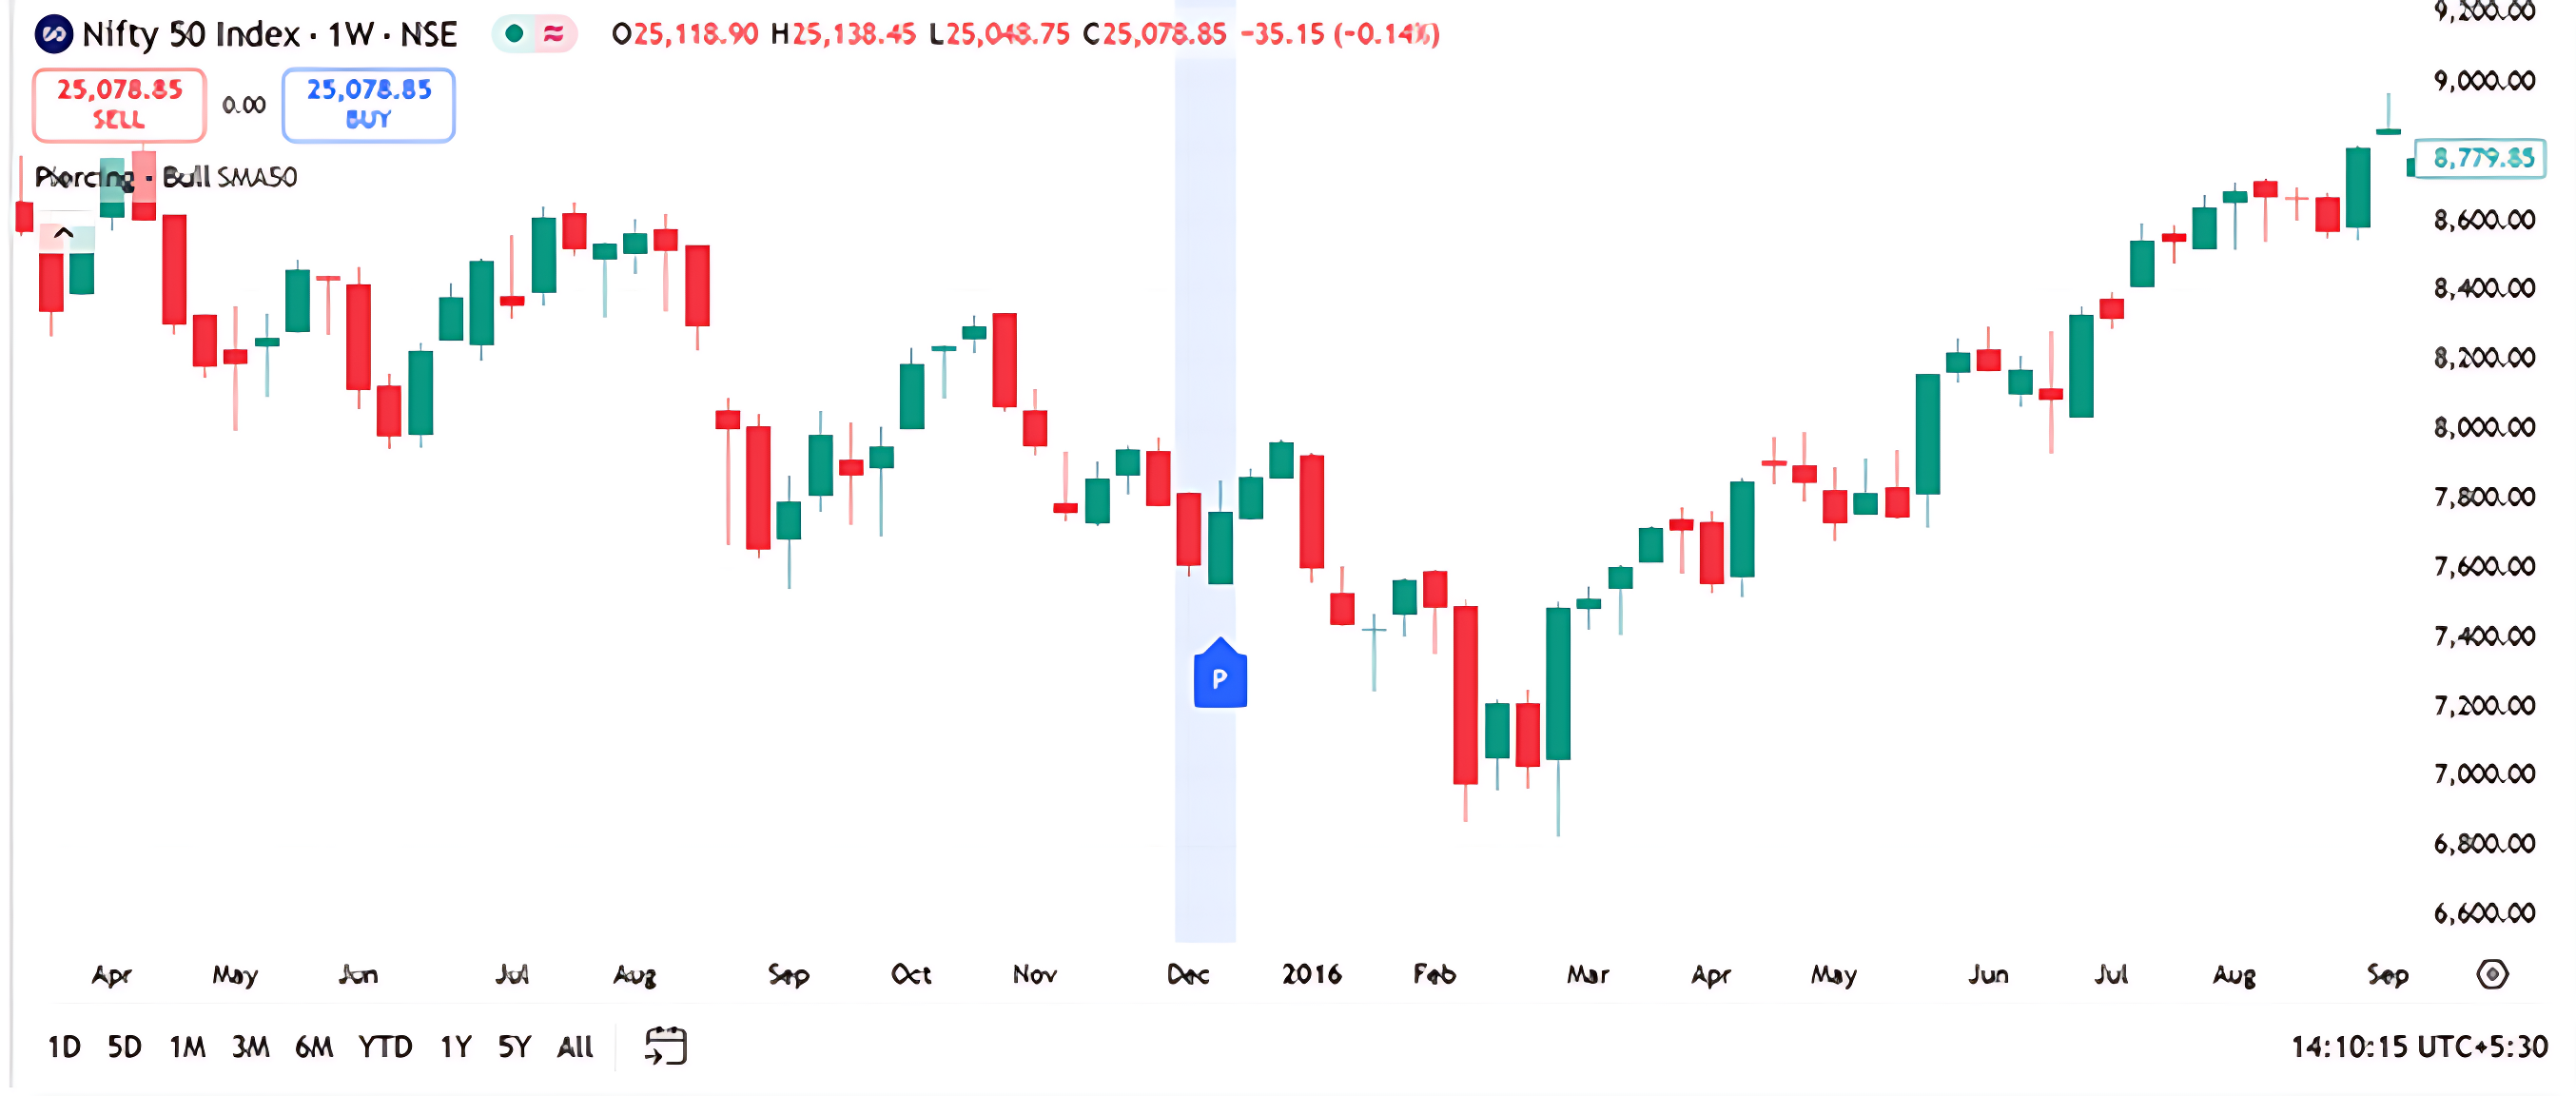
A Piercing Pattern appears on the weekly chart of HDFC Bank in March 2022. This bullish reversal pattern occurs when a red candle is followed by a green candle that opens lower but closes above the midpoint of the previous red candle.
Question: If you’re a trader named Ravi and you spot this Piercing Pattern after a downtrend, what could be a thoughtful next step?
- A) Enter a short position
- B) Wait for confirmation of bullish momentum
- C) Exit all positions immediately
- D) Ignore the pattern—it’s not useful
Correct Answer: B) Wait for confirmation of bullish momentum
Explanation: A Piercing Pattern suggests potential reversal, but confirmation from the next candle (e.g., another green candle or volume increase) helps validate the signal before acting.
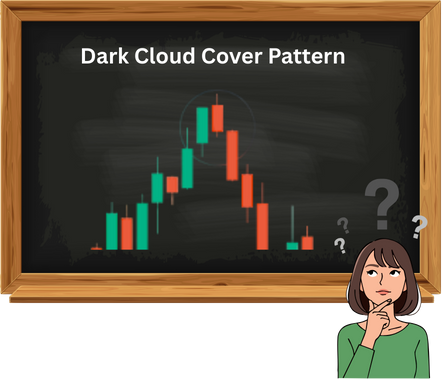
8.6 Dark Cloud Cover Pattern
The dark cloud cover pattern closely resembles the bearish engulfing, but with a slight variation in how much the second candle overlaps the first. In a bearish engulfing, the second candle (P2), typically red, completely engulfs the body of the first bullish candle (P1), signaling strong selling pressure. In a dark cloud cover, P2’s red candle partially overlaps P1’s green candle,specifically, it penetrates between 50% and 100% of P1’s body. This still indicates a bearish reversal, but with slightly less aggression than a full engulfing.

In the image, the DCC forms after a noticeable uptrend, which is a key prerequisite. Here’s how the two candles behave:
- P1 (Green Candle):This bullish candle shows strong upward momentum, closing near its high, suggesting buyers were in control.
- P2 (Red Candle):The next day opens above P1’s high, creating a bullish gap. But instead of continuing upward, it reverses sharply and closes deep into P1’s body, covering more than 50% of it.
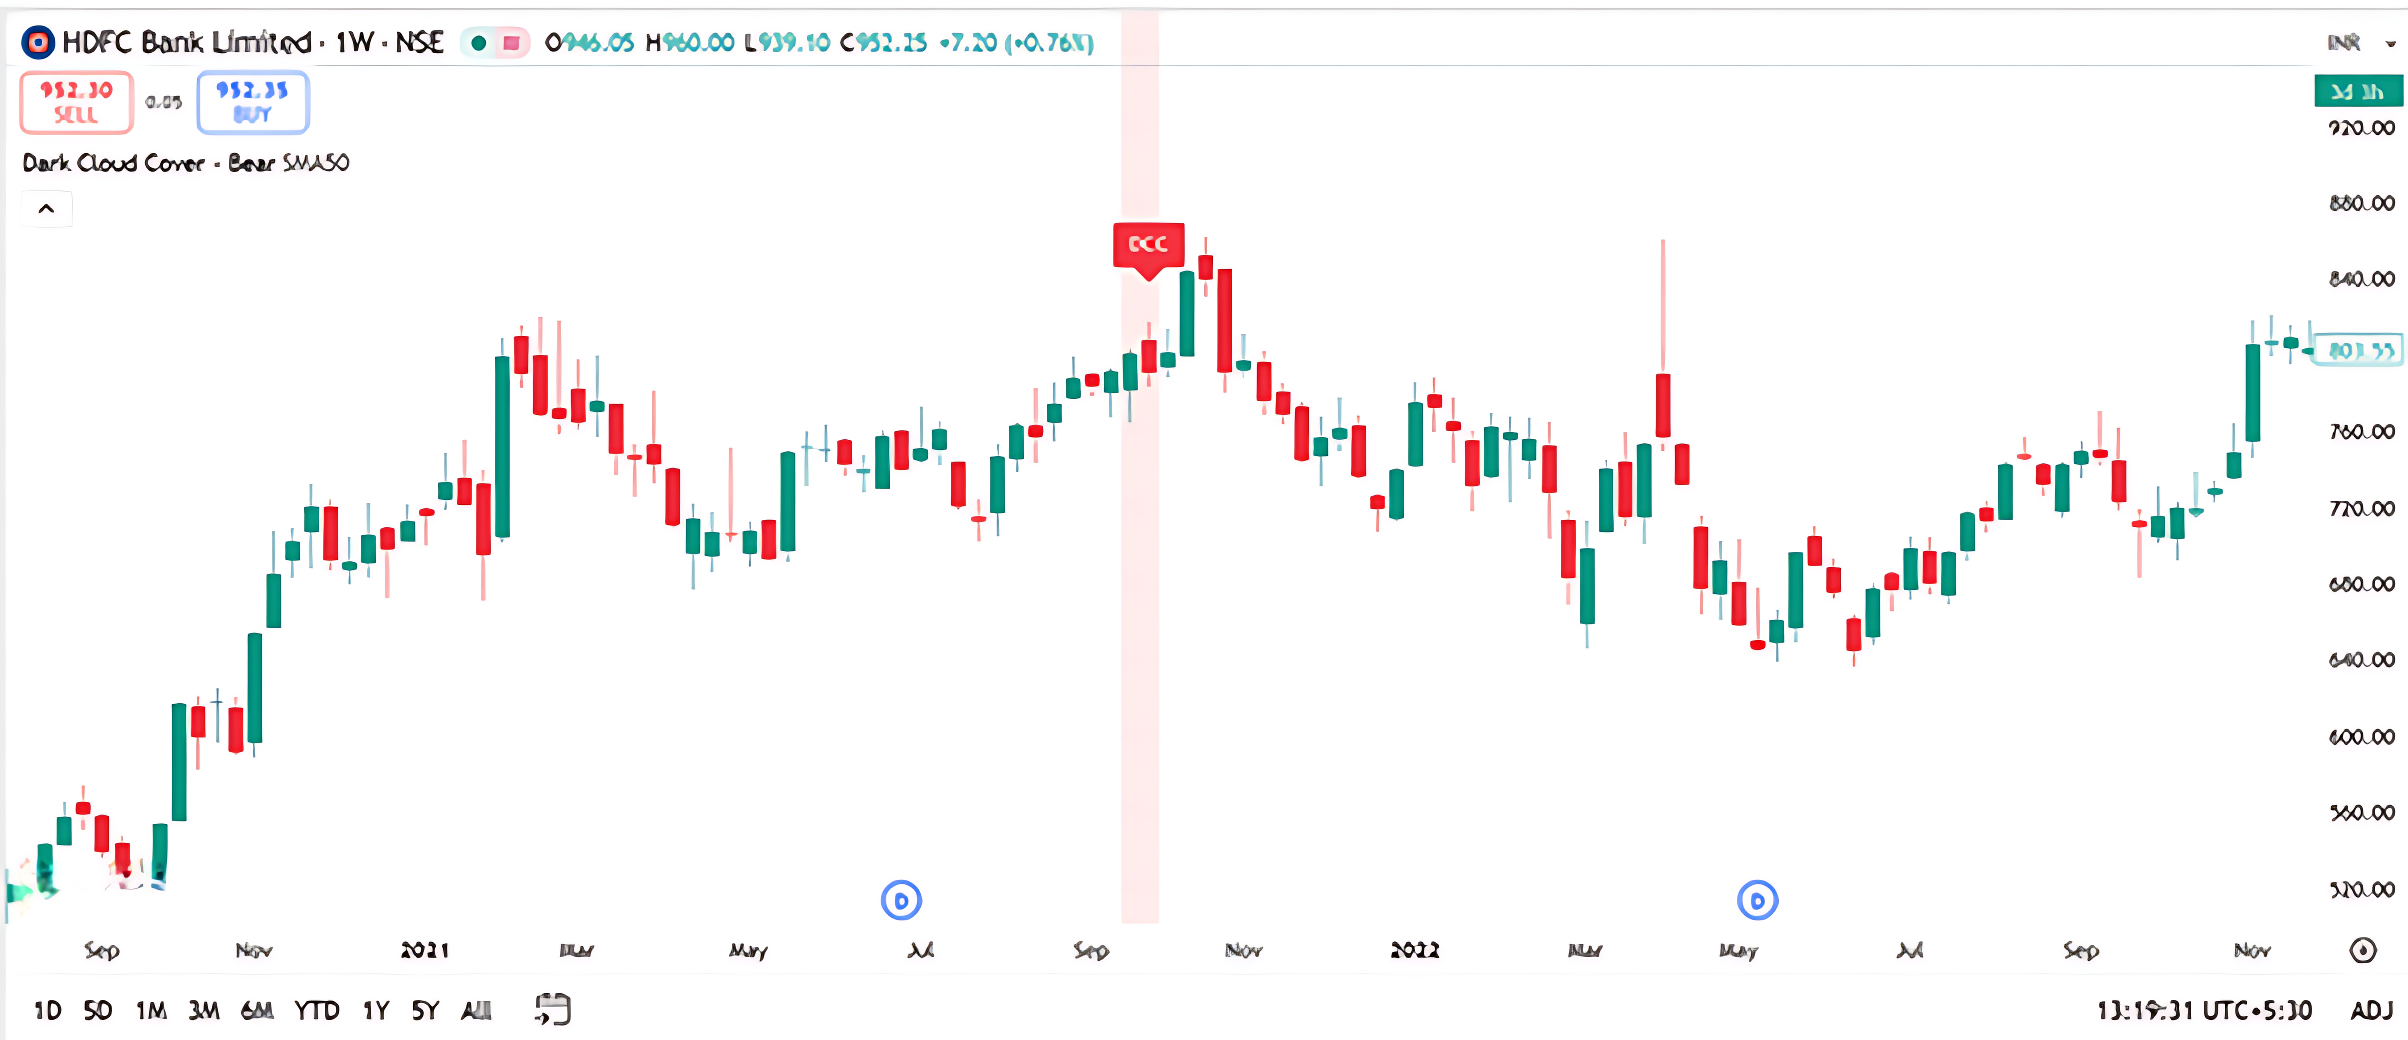
A Dark Cloud Cover pattern appears on the chart in September 2021 after a strong upward move. This bearish reversal pattern forms when a green candle is followed by a red candle that opens above the previous high but closes below its midpoint.
Question: If you’re a trader named Meera and you spot this pattern near a recent high, what would be a cautious next step?
- A) Enter a long position
- B) Wait for bullish confirmation
- C) Consider reducing long exposure or preparing for a reversal
- D) Ignore the signal—it’s unreliable
Correct Answer: C) Consider reducing long exposure or preparing for a reversal Why: The Dark Cloud Cover is a bearish signal that suggests potential trend reversal. It’s wise to manage risk and watch for further confirmation before making new bullish trades.
8.7 Key Takeaways

- Multiple candlestick patterns, which involve two or more candles, provide a more refined view of momentum shifts and are more reliable for positional trading than single candlestick patterns.
- An engulfing pattern is a two-candle reversal signal where a larger candle completely “engulfs” the body of the previous smaller candle, indicating a strong shift in market sentiment.
- A Bullish Engulfing pattern appears at the bottom of a downtrend when a second, larger bullish candle engulfs the prior bearish candle, suggesting buyers have taken control.
- A Bearish Engulfing pattern forms at the top of an uptrend when a second, larger bearish candle engulfs the prior bullish candle, signaling that sellers may be taking control.
- The piercing pattern is a bullish reversal signal where the second candle partially penetrates the first, closing above its midpoint but not fully engulfing it.
- The Dark Cloud Cover pattern is a bearish reversal signal where the second candle partially overlaps the first, penetrating between 50% and 100% of its body.
- Risk-takers may enter a trade on the day the pattern is completed, while risk-averse traders wait for additional confirmation from the next day’s candle before entering.
- For a bullish engulfing pattern, the stop loss is placed at the lowest low between the two candles, while for a bearish engulfing pattern, it is placed just above the high of the second candle.
- The presence of a Doji after a bearish engulfing pattern can signify a critical shift from panic to uncertainty, often preceding a sharp reversal.
- Combining candlestick patterns and interpreting sentiment across multiple sessions enhances predictive accuracy and deepens a trader’s understanding of how emotions shape price action.