Standard Deviation is a statistical measure that quantifies the amount of variation or dispersion in a set of data values. It shows how much individual data points differ from the mean (average) of the dataset. A low standard deviation indicates that the data points are close to the mean, while a high standard deviation suggests that the data is spread out over a wider range. Standard deviation is commonly used in fields like finance, science, and engineering to assess volatility, predict risk, and understand data distribution. It is the square root of the variance, providing a more interpretable measure of spread.
Standard Deviation (SD) is a fundamental concept in statistics that measures the dispersion or spread of a set of data points around the mean (average) of the dataset. It gives us a sense of how far, on average, individual data points are from the mean, helping to understand the variability in the data.
- Formula for Standard Deviation:
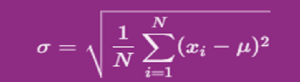
For a population (i.e., the entire dataset), the standard deviation is calculated using the following formula:
Where:
- σ is the population standard deviation.
- N is the number of data points in the population.
- xi represents each data point.
- μ is the population mean (average).
- ∑ denotes the sum over all the data points.
For a sample (i.e., a subset of the population), the formula is slightly adjusted to account for the smaller size and avoid underestimating variability:
S=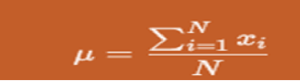
Where:
- s is the sample standard deviation.
- n is the number of data points in the sample.
- xˉ is the sample mean.
- Steps to Calculate Standard Deviation:
- Calculate the Mean: Find the average of the dataset. This is done by summing all the data points and dividing by the total number of data points.
μ=∑iN=1xi/N
Find the Differences from the Mean: Subtract the mean from each data point to determine how far each value deviates from the mean.
- Square the Differences: Square each of the differences obtained in step 2. This step ensures that negative and positive deviations don’t cancel each other out.
- Average the Squared Differences: For a population, find the average of these squared differences by dividing by NNN (the number of data points). For a sample, divide by n−1 to account for the sample size and reduce bias.
- Take the Square Root: Finally, take the square root of the result from step 4. This gives the standard deviation.
- Interpreting Standard Deviation:
- Low Standard Deviation: A small standard deviation means the data points are close to the mean. The data is tightly clustered, indicating low variability or consistency.
- High Standard Deviation: A large standard deviation means the data points are spread out over a wider range of values. This indicates higher variability and more uncertainty in the dataset.
For example, if you have two datasets with the same mean:
- Dataset 1: [10, 11, 9, 10, 10]
- Dataset 2: [1, 20, 5, 16, 9]
Even though both have the same mean (10), Dataset 1 has much less variability, so its standard deviation will be smaller than that of Dataset 2.
- Uses of Standard Deviation:
- Finance and Investing: Standard deviation is used to measure the volatility or risk of an asset, such as a stock or portfolio. A higher standard deviation indicates greater price fluctuations, which can indicate more risk.
- Quality Control: In manufacturing, standard deviation helps assess product consistency. A small standard deviation in production measurements indicates that products are being produced with high precision.
- Statistics: Standard deviation is used to understand the spread of data and to calculate other statistical measures like confidence intervals, regression models, and hypothesis tests.
- Relation to Normal Distribution:
In a normal distribution (bell-shaped curve), about:
- 68% of the data falls within 1 standard deviation of the mean,
- 95% falls within 2 standard deviations, and
- 99.7% falls within 3 standard deviations.
This is known as the 68-95-99.7 rule or the empirical rule, which highlights how standard deviation plays a key role in understanding the distribution of data.
- Example:
Consider the following dataset: [4, 8, 6, 5, 3]
Step 1: Calculate the mean (μ):
μ=4+8+6+5+3/5=5.2
Step 2: Subtract the mean from each data point and square the result:
(4−5.2)2=1.44,
(8−5.2)2=7.84,
(6−5.2)2=0.64,
(5−5.2)2=0.04,
(3−5.2)2=4.84
Step 3: Average the squared differences (for sample standard deviation, divide by n−1=4):
1.44+7.84+0.64+0.04+4.84/4=3.20
Step 4: Take the square root of 3.20:
s=√3.20≈1.79
Thus, the standard deviation of the dataset is approximately 1.79.
Conclusion:
Standard deviation is a powerful statistical tool that helps quantify the amount of variability in a dataset. It is used in a wide range of applications to assess risk, measure consistency, and understand data distribution. While it can be a bit more complex to calculate for large datasets, it provides valuable insight into the data’s spread and is widely used in fields such as finance, engineering, and research.