The parabolic SAR – or parabolic stop and reverse – is a technical indicator that is used to forecast potential reversals or continuations in an underlying market. A reversal can be a bullish market changing into a bearish market, or a bearish market changing into a bullish market, while continuations signify that a market will maintain its previous momentum. A trader can use the parabolic SAR to time their entry into a long or short position.
The indicator was first used by the same trader and analyst who created the relative strength index (RSI), J Welles Wilder Jr. He made the parabolic SAR with three primary functions: to highlight the current trend, to attempt to forecast a reversal in the prevailing trend, and to provide potential exit and entry signals during a reversal.
How to trade using the parabolic SAR
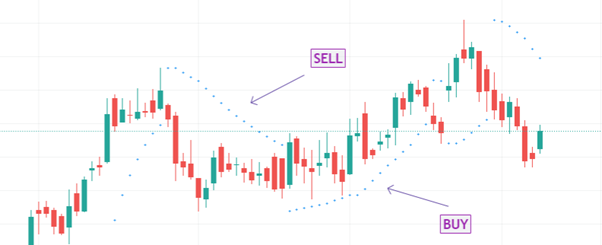
To trade using the parabolic SAR, you first need to understand what the different signals mean. The parabolic SAR will produce a series of dots – known as a parabolic line – above and below the price movements in an asset’s market chart. These dots will be either green or red.
When trading with the parabolic SAR, you would buy a market when the dots move below the current asset price and are green in colour. Alternatively, you would sell a market when the dots move above the current asset price and are red in colour.
After a series of red dots – indicating a bearish market – traders will often consider the first green dot to be a signal for a reversal from the prevailing trend. This is the time at which many will choose to close their current short position if they had one, and open a long position on the same market.
For a red dot following a series of green dots, the opposite is true. The series of green dots shows that the market is currently bullish. But, the first red dot will often serve as a signal for a trader to close their current long position and open a short position on the same market as the trend is reversing from bullish to bearish.
That being said, the signals provided by the parabolic SAR indicator are not always completely accurate and you should carry out your own fundamental analysis and technical analysis of each market that you wish to trade before opening a position.
Parabolic SAR trading strategies
The parabolic SAR trading strategy is essentially a trend trading strategy. It is used to identify a particular trend, and it attempts to forecast trend continuations and potential trend reversals.
For example, if the parabolic line is green, you would follow the bullish trend and keep your long position open. If the parabolic line was red, you would follow the bearish trend and keep your short position open.
But, if a green parabolic line is interrupted by one or two red dots, you might think about closing your current long position and opening a short position. On the other hand, if a red parabolic line is interrupted by one or two green dots, you might think about closing your current short position and opening a long position.
You can use other trend trading technical indicators alongside the parabolic SAR to attempt to confirm the prevailing trend or any potential trend reversals. Examples of trend trading technical indicators include the moving average indicator, the relative strength index (RSI) and the average directional index (ADX).
Advantages
High gain: Parabolic reflector antennas are able to provide very high levels of gain. The larger the ‘dish’ in terms of wavelengths, the higher the gain.
High directivity: As with the gain, so too the parabolic reflector or dish antenna is able to provide high levels of directivity. The higher the gain, the narrower the beam width. This can be a significant advantage in applications where the power is only required to be directed over a small area. This can prevent it, for example causing interference to other users, and this is important when communicating with satellites because it enables satellites using the same frequency bands to be separated by distance or more particularly by angle at the antenna.
Disadvantages
Requires reflector and drive element: the parabolic reflector itself is only part of the antenna. It requires a feed system to be placed at the focus of the parabolic reflector.
Cost: The antenna needs to be manufactured with care. A paraboloid is needed to reflect the radio signals which must be made carefully. In addition to this a feed system is also required. This can add cost to the system
Size: The antenna is not as small as some types of antenna, although many used for satellite television reception are quite compact.
Summary
The parabolic SAR is a technical indicator which traders use to attempt to forecast whether a prevailing trend will continue or reverse
The indicator is based on parabolic lines, which are a series of coloured dots
A series of green dots signals that the current trend is bullish
A series of red dots signals that the current trend is bearish
One or two red dots after a green parabolic line might signal a bearish reversal, and one or two green dots after a red parabolic line might signal a bullish reversal.