Introduction
The Relative Strength Index (RSI), developed by J. Welles Wilder, is a momentum oscillator that measures the speed and change of price movements. The RSI oscillates between zero and 100. Traditionally the RSI is considered overbought when above 70 and oversold when below 30. Signals can be generated by looking for divergences and failure swings. RSI can also be used to identify the general trend.
Relative Strength Index (acronym RSI) is one of the most extensively used momentum oscillators in the realm of technical analysis of stocks. It was introduced by Welles Wilder in June 1978 and its computation is explained in detail in his book New Concepts in Technical Trading System. Momentum oscillator measures the velocity and magnitude of price movements of a security. RSI compares the magnitude of average gains and average losses of a security for drawing inferences about its strength and weakness over a predetermined time period.
How this indicator works
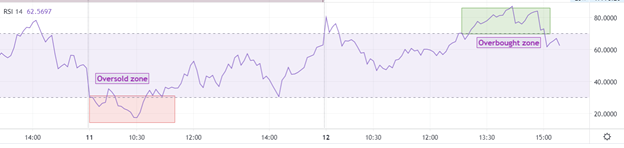
RSI is considered overbought when above 70 and oversold when below 30. These traditional levels can also be adjusted if necessary to better fit the security. For example, if a security is repeatedly reaching the overbought level of 70 you may want to adjust this level to 80.
Note– During strong trends, the RSI may remain in overbought or oversold for extended periods.
RSI also often forms chart patterns that may not show on the underlying price chart, such as double tops and bottoms and trend lines. Also, look for support or resistance on the RSI.
In an uptrend or bull market, the RSI tends to remain in the 40 to 90 range with the 40-50 zones acting as support. During a downtrend or bear market the RSI tends to stay between the 10 to 60 ranges with the 50-60 zones acting as resistance. These ranges will vary depending on the RSI settings and the strength of the security’s or market’s underlying trend.
If underlying prices make a new high or low that isn’t confirmed by the RSI, this divergence can signal a price reversal. If the RSI makes a lower high and then follows with a downside move below a previous low, a Top Swing Failure has occurred. If the RSI makes a higher low and then follows with an upside move above a previous high, a Bottom Swing Failure has occurred.
Divergence
According to Wilder, divergences signal a potential reversal point because directional momentum does not confirm price. In a downtrend, RSI is making higher high and higher lows while price is making lower high and lower lows, termed as ‘Positive Divergence’. However, in a upward trend RSI is making lower high and lower lows while price is making higher high and higher lows, called as ‘Negative Divergence’. Nevertheless divergence loses its significance in sideways market.
Calculation
The RSI is a fairly simple formula, but is difficult to explain without pages of examples. Refer to Wilder’s book for additional calculation information. The basic formula is:
RSI = 100 – [100 / (1 + (Average of Upward Price Change / Average of Downward Price Change))]
Why is RSI so Important ?
Why is RSI Important?
By using the RSI to identify these conditions, traders can better time their trades and potentially increase their profitability. For example, a trader may use the RSI to identify an oversold condition and then wait for a confirmation signal, such as a trend line break or a bullish candlestick pattern, before entering a long position.
In addition to the above conditions, the RSI can also be used to confirm trends and divergences in the market. For example, if the RSI is trending higher along with the price of an asset, it can confirm that the trend is strong and likely to continue. On the other hand, if RSI is trending lower while the price of an asset is trending higher, it can indicate a bearish divergence and a potential reversal in the market.
Overall, the RSI is an important tool for traders because it provides valuable insight into market conditions and can assist in making informed trading decisions. However, it’s important to remember that the RSI is not a perfect tool and should be used in addition to other technical analysis tools and in consideration of market conditions. With practice and experience, traders can learn to effectively incorporate the RSI into their trading strategy and improve their overall performance.
Using RSI with trends
Traders use the Relative Strength Index (RSI) to confirm the strength of a trend. If the RSI is trending higher along with the price of an asset, it can confirm that the trend is strong and likely to continue. Conversely, if the RSI is trending lower while the price of an asset is trending higher, it can indicate a potential bearish divergence and a weakening of the trend. Traders should also adjust the timeframe and parameters of the RSI to suit the asset being traded. With practice and experience, traders can learn to effectively interpret the RSI and use it to improve their overall trading performance.
Interpretation of RSI and RSI Ranges
The RSI can be interpreted in several ways depending on the trading strategy and market conditions. An RSI reading above 70 is usually considered an overbought condition, indicating that the asset may be expecting a price correction or reversal. Similarly, an RSI reading below 30 is usually considered an oversold condition, indicating that the asset may be due for a price rebound or reversal. However, these levels can be adjusted to suit the asset being traded and the strategy being used.
Traders can also use the RSI to identify bullish and bearish divergences. Bullish divergence happens when the RSI forms a higher low while the price of the asset forms a lower low. This can indicate that the momentum of the downtrend is weakening, and a potential price reversal may occur. In contrast, a bearish divergence occurs when the RSI forms a lower high while the price of the asset forms a higher high. This can indicate that the momentum of the uptrend is weakening, and a potential price reversal may occur.
It’s important that the RSI should not be used solely and should be used in addition to other technical analysis tools and in consideration of market conditions. For example, traders may use trendlines, moving averages, and support and resistance levels in combination with the RSI to confirm signals and identify potential trading opportunities.
Traders should also adjust the timeframe and parameters of the RSI to suit the asset being traded. For example, a shorter timeframe and lower RSI range may be more appropriate for day trading, while a longer timeframe and higher RSI range may be more appropriate for swing trading or position trading.
With practice and experience, traders can learn to effectively interpret the RSI and use it to improve their overall trading performance. By combining the RSI with other technical analysis tools and considering market conditions, traders can gain a better understanding of the market and make more informed trading decisions.
Example of RSI Divergence
An example of bullish RSI divergence occurs when an asset is in a downtrend, and the RSI forms a higher low while the price of the asset forms a lower low. This indicates that the momentum of the downtrend is weakening and that a potential price reversal may occur.
For instance, let’s say that stock XYZ has been in a downtrend for several months, with the price steadily decreasing. During this time, the RSI has been trending lower as well, indicating that the selling pressure is strong. However, as the price of the stock reaches a new low, the RSI forms a higher low, indicating that the selling pressure may be weakening and that a potential reversal may occur.
Traders may interpret this as a signal to enter a long position in anticipation of a price rebound. Traders may also consider using stop-loss orders and other risk management techniques to manage their positions.
Overall, the RSI divergence can be a powerful tool for identifying potential trading opportunities. By combining the RSI with other technical analysis tools and considering market conditions, traders can gain a better understanding of the market and make more informed trading decisions.
Conclusion
The Relative Strength Index (RSI) is a valuable tool for traders to make informed trading decisions. By identifying overbought and oversold conditions in a market, traders can better time their trades and potentially increase their profitability. However, it’s important to remember that the RSI is not a perfect tool and should be used in addition to other technical analysis tools and in consideration of market conditions. With practice and experience, traders can learn to effectively incorporate the RSI into their trading strategy and improve their overall performance.
If you want a reliable technical analysis tool to make informed trading decisions, consider using the Relative Strength Index (RSI). Remember to always approach trading with caution and to consider all relevant information before making a trade.