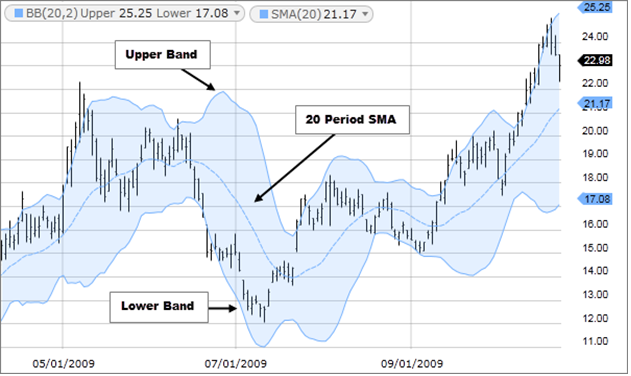
Bollinger Bands are a popular technical analysis tool used to assess market volatility and identify potential trading opportunities. They consist of three lines: a simple moving average (SMA) in the middle, and two outer bands that are typically set two standard deviations away from the SMA.
The upper and lower bands expand or contract based on market volatility. When prices touch or cross the bands, it may signal overbought or oversold conditions. Traders use Bollinger Bands to identify potential price reversals, breakouts, or trends, making them useful for timing entry and exit points in the market.
What are Bollinger Bands?
- Bollinger Bands – a technical analysis tool that consists of a moving average line and two standard deviation lines that are plotted above and below the moving average line. The moving average line is usually set at 20 periods, but traders can adjust it according to their preference.
- The standard deviation lines are set at two standard deviations from the moving average line. The Bollinger Bands help traders to identify the volatility and potential price range of security
How to Calculate Bollinger Bands ?
- Bollinger Opens in a new window. (Price envelopes define upper and lower price range levels.) Bollinger Bands are envelopes that are displayed above and below a straightforward moving average of the price at a standard deviation level.. Because the distance of the bands is based on standard deviation, they adjust to volatility swings in the underlying price.
- Bollinger Bands use 2 parameters, Period and Standard Deviations, Steve. The default values are 20 for period, and 2 for standard deviations, although you may customize the combinations.
- Bollinger bands help determine whether prices are high or low on a relative basis. They are used in pairs, both upper and lower bands and in conjunction with a moving average. Further, the pair of bands is not intended to be used on its own. Use the pair to confirm signals given with other indicators.
Calculation of Bollinger Band
First, calculate a simple moving average. Next, calculate the standard deviation over the same number of periods as the simple moving average. For the upper band, add the standard deviation to the moving average. For the lower band, subtract the standard deviation from the moving average.
Typical values used-
Short term: 10 day moving average, bands at 1.5 standard deviations. (1.5 times the standard dev. +/- the SMA)
Medium term: 20 day moving average, bands at 2 standard deviations.
Long term: 50 day moving average, bands at 2.5 standard deviations.
How it indicator works
When the bands tighten during a period of low volatility, it raises the likelihood of a sharp price move in either direction. This may begin a trending move. Watch out for a false move in opposite direction which reverses before the proper trend begins.
When the bands separate by an unusual large amount, volatility increases and any existing trend may be ending.
Prices have a tendency to bounce within the bands’ envelope, touching one band then moving to the other band. You can use these swings to help identify potential profit targets. For example, if a price bounces off the lower band and then crosses above the moving average, the upper band then becomes the profit target.
Price can exceed or hug a band envelope for prolonged periods during strong trends. On divergence with a momentum oscillator, you may want to do additional research to determine if taking additional profits is appropriate for you.
A strong trend continuation can be expected when the price moves out of the bands. However, if prices move immediately back inside the band, then the suggested strength is negated.
What do Bolling Bands tell you?
- The primary information that Bollinger Bands can provide is the level of market volatility. If the bands are narrow, it indicates that the market is experiencing low volatility. Conversely, if the bands are wide, it suggests that the market is experiencing high volatility. This information can be useful for traders in adjusting their trading strategies accordingly.
- In addition, Bollinger Bands can also provide traders with potential buy or sell signals. If the price of an asset touches or crosses the upper band, it may be an indication that the asset is overbought, and a sell signal may be generated. Conversely, if the price touches or crosses the lower band, it may be an indication that the asset is oversold, and a buy signal may be generated.
- However, it’s important to note that Bollinger Bands should not be relied upon as the sole indicator for making trading decisions. Traders should use them in addition with other technical indicators and fundamental analyses to confirm signals and make informed trading decisions. False signals can occur, which can lead to losses if traders rely too heavily on the bands.
- Overall, Bollinger Bands can provide traders with valuable information about market volatility and potential trading opportunities, but they should be used in combination with other tools and analysis methods to make informed decisions.
Example of Bollinger Bands
An example of Bollinger Bands in action is as follows:
- Let’s say a trader is analyzing the price of a stock over a 20-day period. They use a 20-day simple moving average (SMA) as the middle line and set the upper and lower bands two standard deviations away from the SMA.
- If the stock price is trading within the upper and lower bands, it indicates that the market is not experiencing extreme volatility. If the price moves outside of the upper or lower bands, it suggests that the market is experiencing high volatility.
- Traders can use this to identify potential buy or sell signals. For example, if the price touches the upper band, it may be an indication that the stock is overbought, and a sell signal may be generated. Conversely, if the price touches the lower band, it may be an indication that the stock is oversold, and a buy signal may be generated.
- However, traders should be cautious when using Bollinger Bands® as the sole indicator for trading decisions. They should use them in conjunction with other technical analysis tools to confirm signals and avoid false signals.
Limitations of Bollinger Bands
Bollinger Bands also have some limitations, including:
- False Signals
Bollinger Bands can generate false signals, especially in markets that are not trending. Traders should use Bollinger Bands in conjunction with other technical analysis tools to confirm signals.
- May Not Work in All Market Conditions
Bollinger Bands may not work in all market conditions. In choppy or sideways markets, Bollinger Bands® may not provide accurate signals.
How Accurate are Bolling Bands
- It’s important to note that Bollinger Bands are not always accurate and should not be relied upon as the sole indicator for making trading decisions. Market conditions can change quickly, and the bands may not always accurately reflect current volatility levels. In addition, false signals can occur, which can lead to losses if traders rely too heavily on the bands.
- Traders should use Bollinger Bands in addition with other technical indicators and fundamental analysis to identify signals and make informed trading decisions. They should also consider their own risk tolerance and trading style when using Bollinger Bands® or any other technical indicator.
Conclusion
- Bollinger Bands are an important technical analysis tool that traders use to identify potential trends, reversals, breakouts and measure volatility. Traders should be aware of the common misconceptions about Bollinger Bands and use other indicators to confirm their trading decisions. While Bollinger Bands can be used in various trading strategies, traders should test their methods using previous data before using them in live trading.
- To improve your trading skills, consider adding Bollinger Bands to your technical analysis toolbox. With practice and discipline, Bollinger Bands can improve your decision-making for trading and also achieve your financial goals.