Different technical indicators are used by intraday traders to enter and exit transactions profitably. Moving averages, Fibonacci retracement, stochastic oscillator, Bollinger bands, Relative Strength Index, and Super-Trend indicators are a few of the algorithms they employ. Among these, Olivier Seban’s super-trend indicator has gained popularity for its ability to help investors accurately identify trades (buy and sell).
As the name implies, it shows the direction of price movement in a market that is trending or moving in a specific direction. Investors may see the trend represented on stock price charts, which are colored red for declining prices and green for advancing prices.
Introduction:
When it comes to making wise transactions on the stock market, an indicator or technical analysis tool might be the difference between success and failure. The Super Trend Indicator combines ten separate tools into a single straightforward indicator that has an astounding level of accuracy and dependability and can track up to 200 stocks simultaneously.
In order to provide you a better understanding of the market situation, the Super Trend Indicator is an overlay that connects various time frames. In essence, the Super Trend Indicator combines various time frames into one, enabling you to determine if a trend will hold from one time frame to the next. The Super Trend Indicator examines many time ranges.
What is a super trend indicator?
The Super Trend Indicator’s objective is not to time transactions but to determine the direction of the market. It functions well across all markets, including stocks, futures, FX, bonds, etc., and has undergone thorough back testing. Although it was intended for commodities, stocks can also use it just as well. When volatility occasionally hits severe levels, as it has in recent years, the indicator has proved remarkably accurate.
However, you should hold off on making a trade until the indication is confirmed because false signals frequently appear during times of extreme volatility. If you want to use your signal successfully, you will need to have patience because a confirmed signal typically happens a day or two following your original signal. This is a great trading method for beginning traders who are still learning it.
Simply put, it’s a method that uses different time frames to help predict market direction. An indication should never be utilized in isolation from our other trading strategies and tools. A supertrend indicator is the best tool for determining trend direction and continuation patterns like reversals, pin bars, and gartleys.
How does a super trend indicator work?
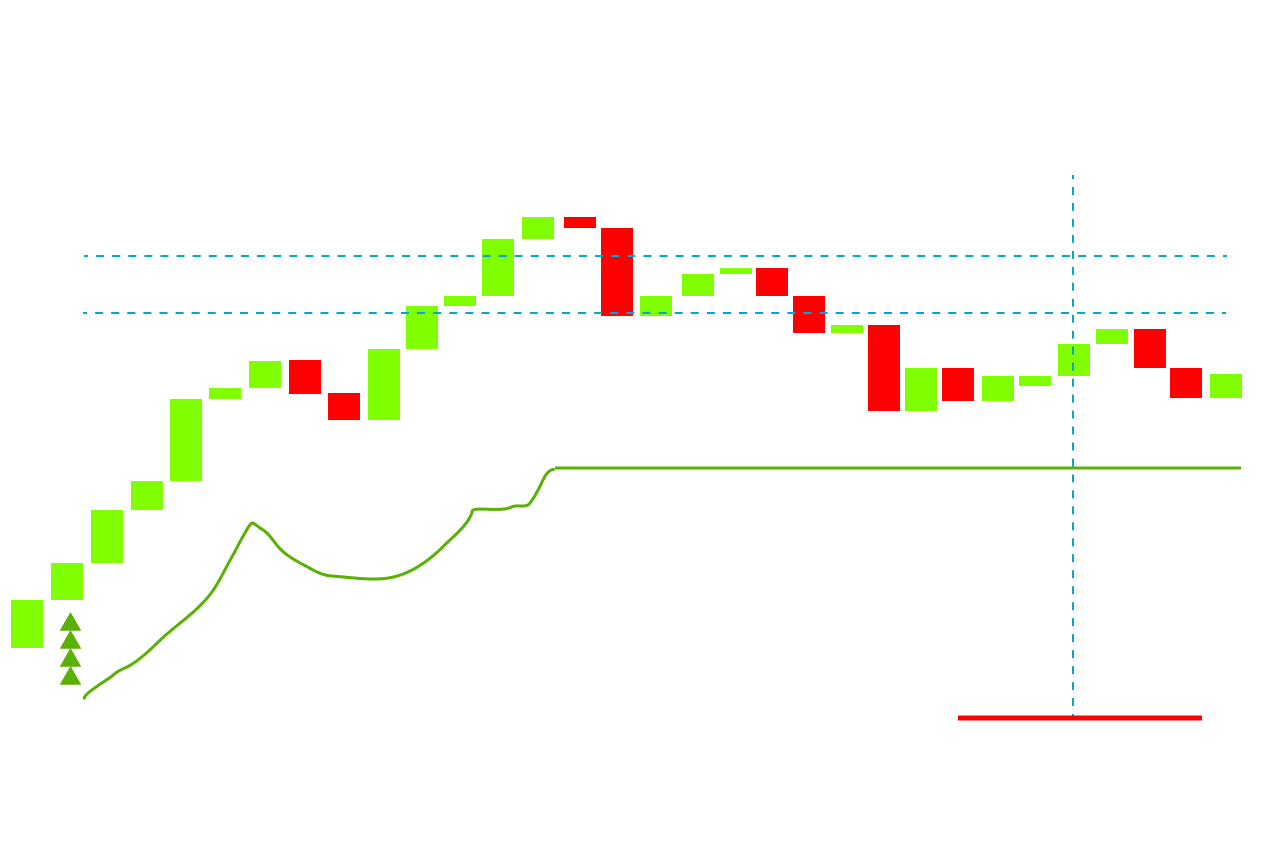
The Super-Trend Indicator forecasts price movement using the wave theory. It is made up of various indicators that are used to spot price changes. It is simple to identify support and resistance levels that are likely to be broken or violated by consistently watching these indications, and one can benefit by purchasing at support levels and selling at resistance levels by identifying those levels. The Supertrend Indicator’s best feature is that it generates indications based on changes in the market. As a result, once a signal is issued, it is no longer necessary to check on it.
A support level is a price at which an asset starts to decline after reaching a new high, whereas a resistance level is a point at which an asset reaches a low but then begins to rise after falling below a particular support level. These two terms are extremely important since they determine whether to buy or sell. Price movement over a specific support level should be interpreted as a signal to buy more positions in order to capitalize on further price growth. Similar to this, investors should refrain from opening new positions as long as prices are below a particular resistance level because the downward trend will persist for a while and cause losses to escalate.
What are the parameters of a super trend indicator?
Period and multiplier are two essential dynamic values that the super-trend indicator depends on. However, before we do that, it’s crucial to comprehend the idea of ATR, or average true range. ATR is another another indicator that provides you with a value for market volatility by decompressing the price range of an asset at a certain point in time.
The highest of these values—current high minus current low, absolute value (intrinsic value) of current high minus previous close, and absolute value of current low minus prior close—represents a true-range indicator.
super trend indicator formula?
Using the aforementioned details in the ATR formula, it appears as follows:
TR = Max [(current high-current low), Abs(current high-previous close), Abs(current low-previous close)]
ATR=(1/n)
The correct range is TRi.
N is the number of trade days or periods.
This formula will help us comprehend how the indicator functions. However, most trading terminals only require you to check the super-trend indicator and select the Periods (ATR number of days) and multiplier settings. A multiplier is a quantity that would multiply ATR. Typically, traders employ a multiplier of three and ten periods. More signals can be generated and price changes can be more quickly responded to with shorter values of n. There will be fewer signals to act upon as a result of the noise of daily price actions being reduced by a longer value of n.
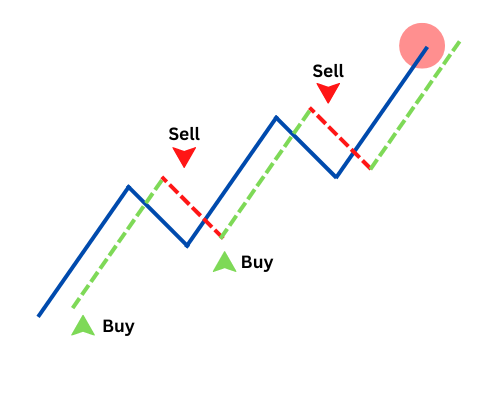
How to identify buy and sell signals using super trend indicators?
The biggest challenge for intraday traders is comprehending and interpreting buying and selling signals in supertrend. The tool illustrates both upward and downward trends. A signal is given when the indicator switches from the closing price to the indicator. When the indicator is green, a buy indication is there; when it is red, a sell signal is present. When it closes above the price, a sell signal is generated.
Pros and cons of super trend indicator?
Knowing the supertrend indicator’s characteristics, how it operates, and when to utilize it are the keys to effective trading with it. In periods of higher volatility, the indicator can be useful because it lets traders decide whether to go long or short. An investor can uncover high-probability trade opportunities with big profit potentials using this unique technical analysis tool. It can also be an effective tool for timing market entries.
However, you must be aware of when to look for divergences versus genuine price changes if you want to become competent at employing it. You will have more clarity about your deals if you know which one will take place.
Also, you need at least two years’ worth of data for these indicators to properly evolve into what is best referred to as trend inertia behavior if you want to utilize them to successfully predict market changes during stressful periods. The Super Trend Indicator is a moving average crossover system that is remarkable, easy to use, extremely potent, and yet not often used. This trading method is simple to apply and effective in any market conditions because it only calls for two indicators and can be used to any time frame chart.
Conclusion
The drawback is that a super-trend indicator works best in markets that are trending, where there are obvious price up- and down-trends. When markets are trending sideways, it can not be advantageous because it could generate erroneous signals that lead to bad trades. Super-trend is combined with other indicators like moving averages and MACD for more effective signals.


