7.1 Order types, Transaction costs, Market Makers role
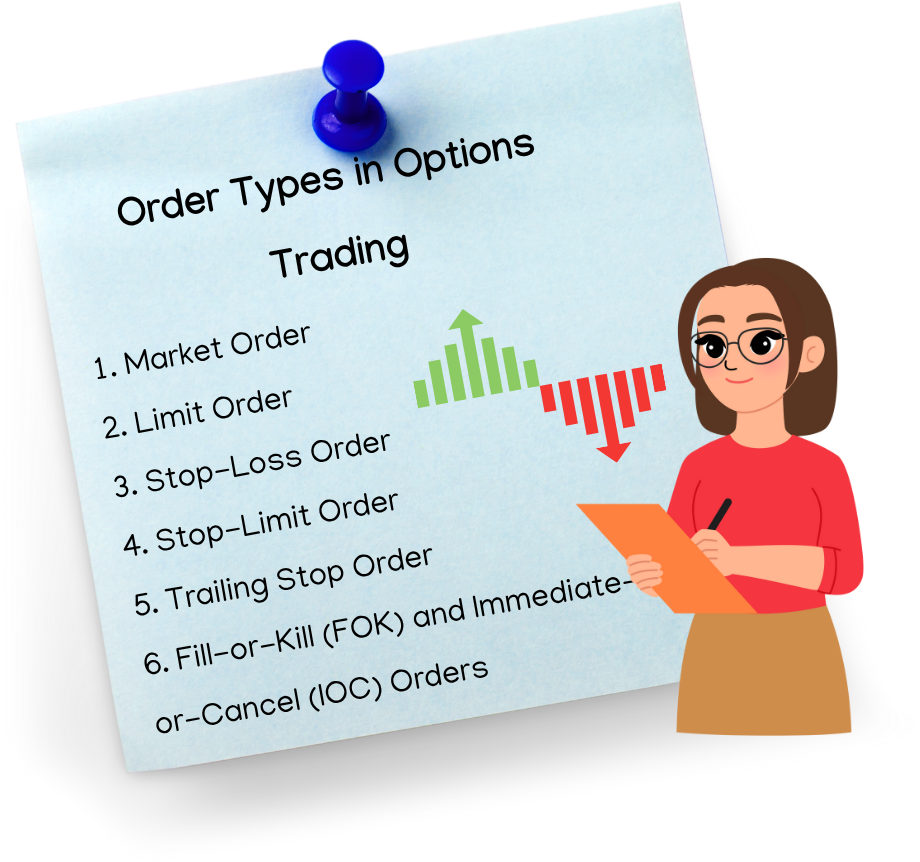
Order Types in Options Trading
Order types define the way traders buy or sell options contracts. Selecting the right order type is crucial for maximizing profits and minimizing risks. Here are the most common types of orders used in options trading:
Market Order
A market order is an order to buy or sell an options contract at the best available price. This order type ensures immediate execution but does not guarantee a specific price. Market orders are best used in highly liquid markets where bid-ask spreads are narrow.
Limit Order
A limit order allows traders to specify the price at which they want to buy or sell an option. The order will only execute if the market reaches the desired price. This is useful in controlling entry and exit points but comes with the risk of the order not being filled if the price does not move accordingly.
Stop-Loss Order
A stop-loss order is used to limit losses by triggering a market order when an option reaches a predetermined price. For example, if an investor owns a call option and wants to limit downside risk, they can set a stop-loss order below the current price.
Stop-Limit Order
A stop-limit order combines the features of a stop-loss order and a limit order. It becomes active only when the price reaches the stop level but will only be executed at the limit price or better. This order helps traders avoid unwanted price execution, especially in volatile markets.
Trailing Stop Order
A trailing stop order adjusts dynamically as the price of an option moves favourably. If the price rises, the stop-loss level moves up, allowing investors to lock in gains while protecting against downside risks.
Fill-or-Kill (FOK) and Immediate-or-Cancel (IOC) Orders
- Fill-or-Kill (FOK):The entire order must be executed immediately at the specified price or be cancelled.
- Immediate-or-Cancel (IOC):The order executes partially or entirely immediately, with any unfilled portion getting cancelled.
Transaction Costs in Options Trading
Transaction costs are a critical aspect of trading that directly impact profitability. Here’s a breakdown of key costs:
- Brokerage Fees
Brokers charge fees for executing trades. Depending on the broker, pricing models can include:
- Flat fees per trade
- Percentage-based fees
- Subscription-based trading models
- Bid-Ask Spread
The bid-ask spread represents the difference between what buyers are willing to pay (bid price) and what sellers are asking (ask price). A wide spread results in higher transaction costs because traders must overcome the price gap to realize profits.
- Exchange Fees
Stock exchanges levy transaction fees for every executed trade. These fees vary based on volume, trader type, and exchange location.
- Regulatory and Clearing Fees
Regulatory bodies such as the Securities and Exchange Board of India (SEBI) charge fees for compliance and governance. Additionally, clearing houses impose fees for processing options transactions.
- Slippage Costs
Slippage occurs when the actual trade execution price differs from the expected price due to market volatility or order delays. Slippage is common in non liquid markets and when large orders influence pricing. Understanding transaction costs is essential for traders to optimize their strategies and ensure cost-effective trade execution.
Market Makers in Options Trading
Market makers are financial institutions or traders that provide liquidity by consistently offering to buy and sell options contracts. Their role is vital in ensuring smooth trading.
- Role of Market Makers
- Liquidity Provision:Market makers ensure that there are enough buyers and sellers in the market, preventing price gaps.
- Bid-Ask Spreads:By maintaining bid and ask prices, market makers help stabilize the pricing of options contracts.
- Risk Management:Market makers hedge their trades using advanced techniques to minimize exposure to sudden market movements.
- How Market Makers Profit
Market makers earn profits by capturing the bid-ask spread—the difference between buying and selling prices. Since they execute high-frequency trades, small spreads translate into significant earnings.
- Market Maker Adjustments
Market makers adjust their pricing based on:
- Implied volatilityin the options market
- Underlying asset price fluctuations
- Economic events affecting liquidity
- Market Maker vs. Retail Trader Dynamics
Retail traders operate differently from market makers. While retail traders aim for directional bets or hedging strategies, market makers continuously rebalance their positions to accommodate liquidity demands.
7.2 Understanding Option Trading Essentials

Bid-Ask Spread
The bid-ask spread represents the difference between the highest price a buyer (bid) is willing to pay for an option contract and the lowest price a seller (ask) is willing to accept. It acts as a measure of market liquidity and transaction costs.
Factors Influencing Bid-Ask Spread
- Liquidity– Highly liquid options have narrow bid-ask spreads, ensuring smoother execution. Non liquid options have wider spreads, making it costlier to trade.
- Implied Volatility– Options with higher implied volatility often have larger bid-ask spreads because of the uncertainty surrounding their price movements.
- Option Type (ITM, ATM, OTM)– In-the-money (ITM) options tend to have tighter spreads compared to out-of-the-money (OTM) options, which have lower trading volume and higher uncertainty.
- Market Conditions– During periods of market volatility, spreads widen as market makers factor in potential price fluctuations.
Implications of Bid-Ask Spread
- Cost for Traders:A wide bid-ask spread increases trading costs, requiring more significant price movements for profitability.
- Market Efficiency:Narrow spreads indicate a highly efficient market with ample participation, whereas wide spreads suggest low liquidity.
- Slippage Risk:Slippage occurs when an order is executed at a different price than expected, often due to large spreads or sudden price movements.
Traders must consider the bid-ask spread when entering and exiting positions, as it directly affects profitability.
Expiry Series
Options contracts have predefined expiration dates, referred to as expiry series. The expiration defines the last day on which the contract can be exercised.
Types of Expiry Series
- Weekly Expiry– Short-term contracts that expire every Thursday (common in NSE options). Traders use them for high-frequency strategies.
- Monthly Expiry– Expire on the last Thursday of every month. Suitable for longer-term positions and hedging strategies.
- LEAPS (Long-Term Equity Anticipation Securities)– These options have expirations extending beyond one year, ideal for investors who want long-term exposure to price movements.
- Quarterly and Annual Expiry– Some indices and institutional contracts have quarterly or annual expirations to match investment cycles.
Impact of Expiry Series on Trading
- Time Decay (Theta)– As expiration approaches, an option’s time value decreases, affecting premium pricing.
- Liquidity Considerations– Monthly expirations often have more liquidity compared to weekly contracts.
- Rolling Over Strategies– Traders often roll over expiring positions to a new contract by closing the old contract and initiating a new one in the following series.
7.3 The four strategies BOX – Call and Put Options
The Box Spread Strategy is a risk-free arbitrage options strategy that involves four different options positions using both call and put options. This strategy is designed to profit from mispriced options and helps traders lock in a guaranteed return without exposure to market risk.
Understanding the Box Strategy
The box spread consists of two spreads:
- Bull Call Spread– Buying a lower strike call and selling a higher strike call.
- Bear Put Spread– Buying a lower strike put and selling a higher strike put.
How It Works
By combining these two spreads, traders create a synthetic long position and a synthetic short position simultaneously, resulting in a risk-free payoff when there is a pricing inefficiency in the options market.
Breakdown of the Four Options Contracts in a Box Spread
|
Options Trade |
Action |
|
Buy Call (Low Strike) |
Long Call |
|
Sell Call (High Strike) |
Short Call |
|
Buy Put (Low Strike) |
Long Put |
|
Sell Put (High Strike) |
Short Put |
This structure creates a fixed payoff, ensuring traders earn a profit when option contracts are mispriced.
Example of a Box Strategy Trade
Imagine Nifty is trading at 18,000, and a trader executes the following positions:
- Buy 17,900 Call→ Bullish trade
- Sell 18,100 Call→ Bearish trade
- Buy 17,900 Put→ Bearish trade
- Sell 18,100 Put→ Bullish trade
Since a box spread guarantees a fixed return, traders profit when the difference between the debit and credit of these trades is mispriced.
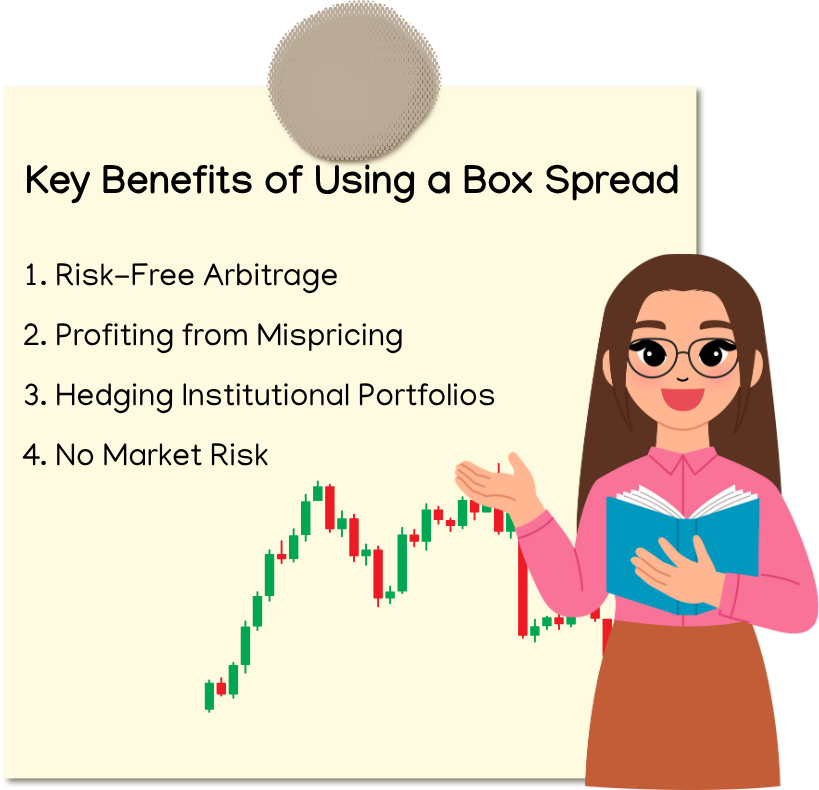
Key Benefits of Using a Box Spread
- Risk-Free Arbitrage:Allows traders to earn guaranteed profits with no directional risk.
- Profiting from Mispricing:Used when there’s a discrepancy in option contract valuations.
- Hedging Institutional Portfolios:Institutions use box spreads to hedge large positions.
- No Market Risk:Since the payoff is fixed, the strategy remains independent of underlying price movements.
Limitations to Consider
- High Margin Requirements:Since a box spread consists of four options positions, margin requirements can be significant.
- Low Returns Due to Efficiency:Arbitrage opportunities are rare since markets tend to price options efficiently.
7.4 Pitfalls of Short Calls and Short Puts
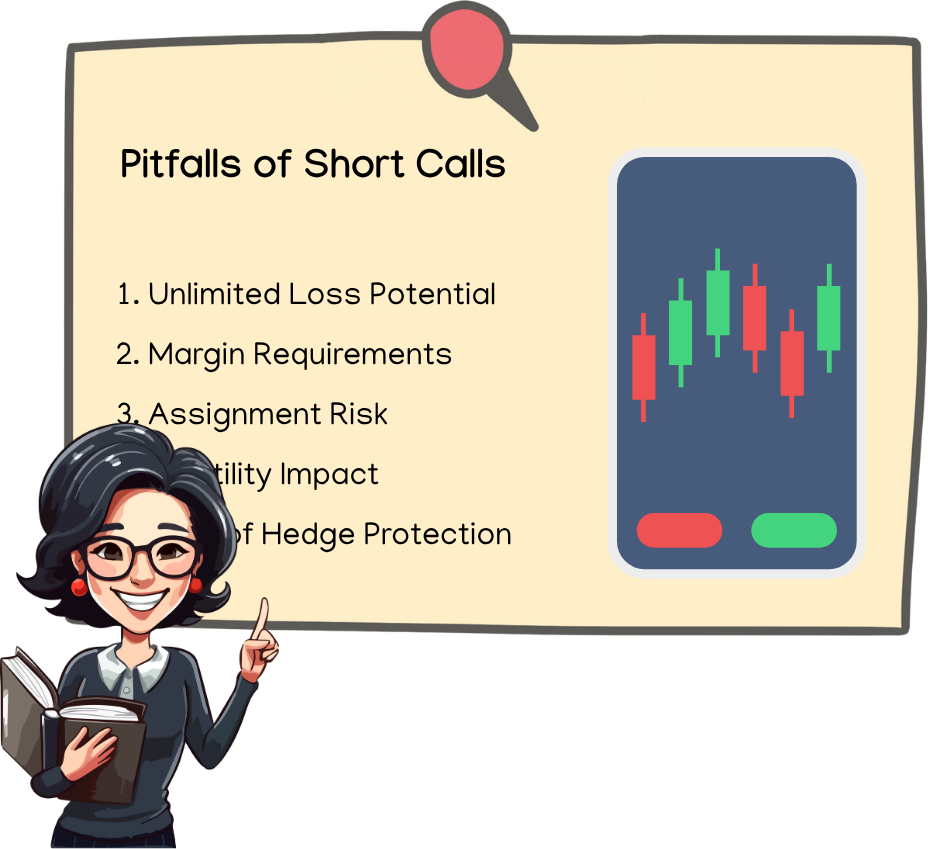
Pitfalls of Short Calls
A short call position involves selling a call option, obligating the seller to deliver the underlying asset at the strike price if the buyer exercises the option. While this strategy can generate profits in a stable or bearish market, the risks are substantial.
- Unlimited Loss Potential
Unlike short puts, where losses are capped at the strike price minus the premium received, short calls have unlimited risk. If the price of the underlying stock rises sharply, the seller must purchase shares at the market price to fulfill the contract, leading to extreme losses.
- Margin Requirements
Short call positions require significant margin deposits, particularly if the stock is volatile. Brokers enforce margin calls when losses exceed account balances, potentially forcing traders to liquidate other positions.
- Assignment Risk
If the stock price exceeds the strike price, buyers may exercise the call option early, forcing the seller to deliver shares at a lower price. This results in substantial losses if the stock price has risen dramatically.
- Volatility Impact
Sharp price movements increase implied volatility, inflating options premiums. If volatility spikes, traders shorting calls may face extreme price swings, making it difficult to manage risks.
- Lack of Hedge Protection
Unless paired with a covered call strategy, a naked short call exposes traders to unlimited market risk, making it one of the riskiest options strategies.
Pitfalls of Short Puts
A short put position involves selling a put option, obligating the seller to buy the underlying asset at the strike price if the buyer exercises the contract. While short puts can be profitable in bullish markets, they also carry notable risks.
- Large Losses in Market Downturns
If the underlying stock experiences a sudden decline, short put sellers face significant losses. The further the stock drops, the more expensive it becomes for the seller to fulfill their obligation to purchase shares.
- High Margin Requirements
Just like short calls, short puts require margin collateral, which brokers may increase during times of high volatility. If losses exceed margin limits, traders face forced liquidations.
- Assignment and Forced Purchase
If the stock drops below the strike price, put buyers will exercise their options, forcing the short seller to buy shares. If the stock keeps declining, the trader may be stuck with an asset worth far less than the purchase price.
- Market Sentiment Misjudgement
Selling puts assumes that the stock will remain stable or rise. However, unexpected market crashes, earnings disappointments, or economic downturns can lead to significant losses.
- Low Reward-to-Risk Ratio
The maximum profit from selling a put is only the premium received, whereas potential losses can be much greater if the stock price collapses. This asymmetric risk makes short puts highly speculative without proper hedging.
7.5 Four Strategy choices – 2 Bullish and 2 Bearish

Bullish Strategies
These strategies are designed for traders expecting the price of the underlying asset to rise.
- Bull Call Spread
A Bull Call Spread involves buying a lower strike call option and selling a higher strike call option. This strategy reduces costs compared to buying a call outright while still benefiting from upside movement.
- Example:If a stock is trading at ₹100, you could buy a ₹95 call and sell a ₹105 call to lower premium costs.
- Maximum Profit:Difference between strike prices minus the net premium paid.
- Maximum Loss:Limited to the premium paid.
- Ideal Market Condition:Gradual bullish movement.
- Cash-Secured Put (Bullish Strategy)
A cash-secured put involves selling a put option while keeping enough cash in reserve to buy the stock if assigned. Traders use this strategy when they want to own the stock at a lower price while collecting premium income.
- Example:If a stock is trading at ₹100, selling a ₹95 put allows you to collect premium while being prepared to buy at ₹95 if assigned.
- Maximum Profit:Premium received.
- Maximum Loss:Occurs if stock falls sharply below the strike price.
- Ideal Market Condition:Moderate bullish or sideways movement.
Bearish Strategies
These strategies work well when traders expect the underlying asset price to decline.
- Bear Put Spread
A Bear Put Spread involves buying a higher strike put and selling a lower strike put to profit from a downtrend while limiting cost.
- Example:If a stock is trading at ₹100, buying a ₹105 put and selling a ₹95 put allows you to profit if the stock declines.
- Maximum Profit:Difference between strike prices minus premium paid.
- Maximum Loss:Limited to the premium paid.
- Ideal Market Condition:Gradual bearish movement.
- Covered Call (Bearish to Neutral)
A covered call involves owning the stock while selling a call option against it. This strategy generates premium income but caps potential upside gains.
- Example:Holding a stock trading at ₹100 and selling a ₹110 call ensures you collect premium while limiting profit if the stock rises above ₹110.
- Maximum Profit:Premium received plus capital appreciation up to the strike price.
- Maximum Loss:Loss in stock value, offset by premium income.
- Ideal Market Condition:Mild bearish or sideways movement.
7.6 Strategy -Case Studies

Case Study 1: Using a Covered Call for Passive Income
Background:
An investor holds 100 shares of XYZ Ltd., currently trading at ₹500 per share. Instead of waiting for price appreciation, the investor decides to generate additional income by selling call options.
Strategy: Covered Call
A covered call involves selling a call option while holding the underlying stock. This strategy provides income through premium collection while capping potential gains.
Trade Setup:
- Stock Owned:100 XYZ Ltd. shares at ₹500
- Call Option Sold:Strike price ₹520, expiration in 30 days
- Premium Received:₹10 per share
Possible Outcomes:
- Stock Remains Below ₹520 (Options Expire Worthless)
- Investor keeps the premium ₹10 × 100 = ₹1,000
- Stock remains in portfolio
- Outcome: Profit from premium without selling the stock
2. Stock Rises Above ₹520 (Assignment Occurs)
- Investor sells stock at ₹520 per share
- Earns capital gains of ₹20 per share (+₹10 premium)
- Outcome: Gains are capped but total profit = ₹3,000
3. Stock Drops Below ₹500
- Stock value decreases, but the premium cushions losses
- Outcome: Investor faces unrealized loss but still has premium income
Key Learnings:
- Covered calls work well in neutral to mildly bullish markets.
- They generate passive income but limit upside potential.
- Traders should carefully select strike prices to balance risk and reward.
Case Study 2: Using a Bear Put Spread for Downside Protection
Background:
An investor expects ABC Ltd. to decline but wants a cost-effective hedge rather than buying puts outright. The investor uses a Bear Put Spread, which involves buying a higher strike put and selling a lower strike put to reduce costs.
Strategy: Bear Put Spread
A bear put spread is used when traders expect a moderate decline in stock prices while limiting downside risk.
Trade Setup:
- Stock Price: ₹1,200
- Buy Put Option: Strike price ₹1,180, premium ₹40
- Sell Put Option: Strike price ₹1,160, premium ₹20
- Net Cost: ₹40 – ₹20 = ₹20 per contract
Possible Outcomes:
- Stock Falls Below ₹1,160 (Maximum Profit)
- Long put gains value, short put offsets part of the risk
- Net profit = ₹20 difference in strike prices – ₹20 premium paid = ₹20 per share
- Outcome:Maximum gain from spread
- Stock Stays Between ₹1,160 and ₹1,180
- Partial profit depending on stock price movement
- Outcome:Limited gains as long put increases in value
- Stock Rises Above ₹1,180 (Options Expire Worthless)
- Both options expire worthless
- Loss limited to ₹20 premium paid
- Outcome:Controlled loss scenario
Key Learnings:
- Bear put spreads offer controlled risk exposure for bearish trades.
- They are more cost-efficient than buying puts outright.
- Traders must carefully select strike prices based on expected price movements.
Order Types & Market Maker Role – Strategic Execution Advice
When to Use Which Order Type
|
Order Type |
When to Use |
Why It Matters |
|
Market Order |
Only when bid-ask spread is < ₹0.50 in liquid NIFTY options |
Ensures immediate execution but avoid in wide-spread or low-volume conditions to prevent slippage. |
|
Limit Order |
Crucial for non-liquid stock options, deep OTM strikes, or option spreads |
Gives control over execution price and avoids unnecessary losses from wide bid-ask spreads. |
|
Stop-Limit Order |
Avoid during fast-moving markets like news events or expiry days |
Can result in non-execution during rapid price swings due to limit constraints. |
7.7 Market Maker (MM) Role – What Traders Must Know

Market Makers (MMs) provide liquidity, but they also manage risk—especially in volatile or low-volume conditions. Understanding their behavior can give you a strategic edge.
How MMs Influence Spreads
During Low Volume or High IV Events (e.g., RBI Policy, Budget Week):
MMs widen spreads significantly to hedge against uncertainty. Execution becomes costly if you trade blindly during these periods.
In Illiquid or Deep OTM Options:
MMs either stay passive or quote wide spreads, especially at the start of the week or outside trading hours. This is common in weekly NIFTY/BANKNIFTY OTM options on Monday mornings.
Market Maker (MM) Role – What Traders Must Know
Market Makers (MMs) provide liquidity, but they also manage risk—especially in volatile or low-volume conditions. Understanding their behavior can give you a strategic edge.
How MMs Influence Spreads
During Low Volume or High IV Events (e.g., RBI Policy, Budget Week):
MMs widen spreads significantly to hedge against uncertainty. Execution becomes costly if you trade blindly during these periods.
In Illiquid or Deep OTM Options:
MMs either stay passive or quote wide spreads, especially at the start of the week or outside trading hours. This is common in weekly NIFTY/BANKNIFTY OTM options on Monday mornings.
Execution Strategy for Traders
|
Situation |
Best Execution Strategy |
|
RBI policy, Budget week, or major news |
Use limit orders with patience. Avoid aggressive market orders during the announcement window. |
|
Monday mornings (especially in OTM weeklies) |
Wait for spreads to normalize post-opening or trade closer to ATM where liquidity is better. |
|
Trading Illiquid Stock Options |
Prefer mid-price limit orders, adjust slowly if not filled—don’t chase price. |
|
Scalping or fast trades |
Stick to high-volume strikes with <₹0.30 spread and use limit orders to define risk. |
7.1 Order types, Transaction costs, Market Makers role
Order Types in Options Trading
Order types define the way traders buy or sell options contracts. Selecting the right order type is crucial for maximizing profits and minimizing risks. Here are the most common types of orders used in options trading:
Market Order
A market order is an order to buy or sell an options contract at the best available price. This order type ensures immediate execution but does not guarantee a specific price. Market orders are best used in highly liquid markets where bid-ask spreads are narrow.
Limit Order
A limit order allows traders to specify the price at which they want to buy or sell an option. The order will only execute if the market reaches the desired price. This is useful in controlling entry and exit points but comes with the risk of the order not being filled if the price does not move accordingly.
Stop-Loss Order
A stop-loss order is used to limit losses by triggering a market order when an option reaches a predetermined price. For example, if an investor owns a call option and wants to limit downside risk, they can set a stop-loss order below the current price.
Stop-Limit Order
A stop-limit order combines the features of a stop-loss order and a limit order. It becomes active only when the price reaches the stop level but will only be executed at the limit price or better. This order helps traders avoid unwanted price execution, especially in volatile markets.
Trailing Stop Order
A trailing stop order adjusts dynamically as the price of an option moves favourably. If the price rises, the stop-loss level moves up, allowing investors to lock in gains while protecting against downside risks.
Fill-or-Kill (FOK) and Immediate-or-Cancel (IOC) Orders
- Fill-or-Kill (FOK):The entire order must be executed immediately at the specified price or be cancelled.
- Immediate-or-Cancel (IOC):The order executes partially or entirely immediately, with any unfilled portion getting cancelled.
Transaction Costs in Options Trading
Transaction costs are a critical aspect of trading that directly impact profitability. Here’s a breakdown of key costs:
- Brokerage Fees
Brokers charge fees for executing trades. Depending on the broker, pricing models can include:
- Flat fees per trade
- Percentage-based fees
- Subscription-based trading models
- Bid-Ask Spread
The bid-ask spread represents the difference between what buyers are willing to pay (bid price) and what sellers are asking (ask price). A wide spread results in higher transaction costs because traders must overcome the price gap to realize profits.
- Exchange Fees
Stock exchanges levy transaction fees for every executed trade. These fees vary based on volume, trader type, and exchange location.
- Regulatory and Clearing Fees
Regulatory bodies such as the Securities and Exchange Board of India (SEBI) charge fees for compliance and governance. Additionally, clearing houses impose fees for processing options transactions.
- Slippage Costs
Slippage occurs when the actual trade execution price differs from the expected price due to market volatility or order delays. Slippage is common in non liquid markets and when large orders influence pricing. Understanding transaction costs is essential for traders to optimize their strategies and ensure cost-effective trade execution.
Market Makers in Options Trading
Market makers are financial institutions or traders that provide liquidity by consistently offering to buy and sell options contracts. Their role is vital in ensuring smooth trading.
- Role of Market Makers
- Liquidity Provision:Market makers ensure that there are enough buyers and sellers in the market, preventing price gaps.
- Bid-Ask Spreads:By maintaining bid and ask prices, market makers help stabilize the pricing of options contracts.
- Risk Management:Market makers hedge their trades using advanced techniques to minimize exposure to sudden market movements.
- How Market Makers Profit
Market makers earn profits by capturing the bid-ask spread—the difference between buying and selling prices. Since they execute high-frequency trades, small spreads translate into significant earnings.
- Market Maker Adjustments
Market makers adjust their pricing based on:
- Implied volatilityin the options market
- Underlying asset price fluctuations
- Economic events affecting liquidity
- Market Maker vs. Retail Trader Dynamics
Retail traders operate differently from market makers. While retail traders aim for directional bets or hedging strategies, market makers continuously rebalance their positions to accommodate liquidity demands.
7.2 Understanding Option Trading Essentials
Bid-Ask Spread
The bid-ask spread represents the difference between the highest price a buyer (bid) is willing to pay for an option contract and the lowest price a seller (ask) is willing to accept. It acts as a measure of market liquidity and transaction costs.
Factors Influencing Bid-Ask Spread
- Liquidity– Highly liquid options have narrow bid-ask spreads, ensuring smoother execution. Non liquid options have wider spreads, making it costlier to trade.
- Implied Volatility– Options with higher implied volatility often have larger bid-ask spreads because of the uncertainty surrounding their price movements.
- Option Type (ITM, ATM, OTM)– In-the-money (ITM) options tend to have tighter spreads compared to out-of-the-money (OTM) options, which have lower trading volume and higher uncertainty.
- Market Conditions– During periods of market volatility, spreads widen as market makers factor in potential price fluctuations.
Implications of Bid-Ask Spread
- Cost for Traders:A wide bid-ask spread increases trading costs, requiring more significant price movements for profitability.
- Market Efficiency:Narrow spreads indicate a highly efficient market with ample participation, whereas wide spreads suggest low liquidity.
- Slippage Risk:Slippage occurs when an order is executed at a different price than expected, often due to large spreads or sudden price movements.
Traders must consider the bid-ask spread when entering and exiting positions, as it directly affects profitability.
Expiry Series
Options contracts have predefined expiration dates, referred to as expiry series. The expiration defines the last day on which the contract can be exercised.
Types of Expiry Series
- Weekly Expiry– Short-term contracts that expire every Thursday (common in NSE options). Traders use them for high-frequency strategies.
- Monthly Expiry– Expire on the last Thursday of every month. Suitable for longer-term positions and hedging strategies.
- LEAPS (Long-Term Equity Anticipation Securities)– These options have expirations extending beyond one year, ideal for investors who want long-term exposure to price movements.
- Quarterly and Annual Expiry– Some indices and institutional contracts have quarterly or annual expirations to match investment cycles.
Impact of Expiry Series on Trading
- Time Decay (Theta)– As expiration approaches, an option’s time value decreases, affecting premium pricing.
- Liquidity Considerations– Monthly expirations often have more liquidity compared to weekly contracts.
- Rolling Over Strategies– Traders often roll over expiring positions to a new contract by closing the old contract and initiating a new one in the following series.
7.3 The four strategies BOX – Call and Put Options
The Box Spread Strategy is a risk-free arbitrage options strategy that involves four different options positions using both call and put options. This strategy is designed to profit from mispriced options and helps traders lock in a guaranteed return without exposure to market risk.
Understanding the Box Strategy
The box spread consists of two spreads:
- Bull Call Spread– Buying a lower strike call and selling a higher strike call.
- Bear Put Spread– Buying a lower strike put and selling a higher strike put.
How It Works
By combining these two spreads, traders create a synthetic long position and a synthetic short position simultaneously, resulting in a risk-free payoff when there is a pricing inefficiency in the options market.
Breakdown of the Four Options Contracts in a Box Spread
|
Options Trade |
Action |
|
Buy Call (Low Strike) |
Long Call |
|
Sell Call (High Strike) |
Short Call |
|
Buy Put (Low Strike) |
Long Put |
|
Sell Put (High Strike) |
Short Put |
This structure creates a fixed payoff, ensuring traders earn a profit when option contracts are mispriced.
Example of a Box Strategy Trade
Imagine Nifty is trading at 18,000, and a trader executes the following positions:
- Buy 17,900 Call→ Bullish trade
- Sell 18,100 Call→ Bearish trade
- Buy 17,900 Put→ Bearish trade
- Sell 18,100 Put→ Bullish trade
Since a box spread guarantees a fixed return, traders profit when the difference between the debit and credit of these trades is mispriced.
Key Benefits of Using a Box Spread
- Risk-Free Arbitrage:Allows traders to earn guaranteed profits with no directional risk.
- Profiting from Mispricing:Used when there’s a discrepancy in option contract valuations.
- Hedging Institutional Portfolios:Institutions use box spreads to hedge large positions.
- No Market Risk:Since the payoff is fixed, the strategy remains independent of underlying price movements.
Limitations to Consider
- High Margin Requirements:Since a box spread consists of four options positions, margin requirements can be significant.
- Low Returns Due to Efficiency:Arbitrage opportunities are rare since markets tend to price options efficiently.
7.4 Pitfalls of Short Calls and Short Puts
Pitfalls of Short Calls
A short call position involves selling a call option, obligating the seller to deliver the underlying asset at the strike price if the buyer exercises the option. While this strategy can generate profits in a stable or bearish market, the risks are substantial.
- Unlimited Loss Potential
Unlike short puts, where losses are capped at the strike price minus the premium received, short calls have unlimited risk. If the price of the underlying stock rises sharply, the seller must purchase shares at the market price to fulfill the contract, leading to extreme losses.
- Margin Requirements
Short call positions require significant margin deposits, particularly if the stock is volatile. Brokers enforce margin calls when losses exceed account balances, potentially forcing traders to liquidate other positions.
- Assignment Risk
If the stock price exceeds the strike price, buyers may exercise the call option early, forcing the seller to deliver shares at a lower price. This results in substantial losses if the stock price has risen dramatically.
- Volatility Impact
Sharp price movements increase implied volatility, inflating options premiums. If volatility spikes, traders shorting calls may face extreme price swings, making it difficult to manage risks.
- Lack of Hedge Protection
Unless paired with a covered call strategy, a naked short call exposes traders to unlimited market risk, making it one of the riskiest options strategies.
Pitfalls of Short Puts
A short put position involves selling a put option, obligating the seller to buy the underlying asset at the strike price if the buyer exercises the contract. While short puts can be profitable in bullish markets, they also carry notable risks.
- Large Losses in Market Downturns
If the underlying stock experiences a sudden decline, short put sellers face significant losses. The further the stock drops, the more expensive it becomes for the seller to fulfill their obligation to purchase shares.
- High Margin Requirements
Just like short calls, short puts require margin collateral, which brokers may increase during times of high volatility. If losses exceed margin limits, traders face forced liquidations.
- Assignment and Forced Purchase
If the stock drops below the strike price, put buyers will exercise their options, forcing the short seller to buy shares. If the stock keeps declining, the trader may be stuck with an asset worth far less than the purchase price.
- Market Sentiment Misjudgement
Selling puts assumes that the stock will remain stable or rise. However, unexpected market crashes, earnings disappointments, or economic downturns can lead to significant losses.
- Low Reward-to-Risk Ratio
The maximum profit from selling a put is only the premium received, whereas potential losses can be much greater if the stock price collapses. This asymmetric risk makes short puts highly speculative without proper hedging.
7.5 Four Strategy choices – 2 Bullish and 2 Bearish
Bullish Strategies
These strategies are designed for traders expecting the price of the underlying asset to rise.
- Bull Call Spread
A Bull Call Spread involves buying a lower strike call option and selling a higher strike call option. This strategy reduces costs compared to buying a call outright while still benefiting from upside movement.
- Example:If a stock is trading at ₹100, you could buy a ₹95 call and sell a ₹105 call to lower premium costs.
- Maximum Profit:Difference between strike prices minus the net premium paid.
- Maximum Loss:Limited to the premium paid.
- Ideal Market Condition:Gradual bullish movement.
- Cash-Secured Put (Bullish Strategy)
A cash-secured put involves selling a put option while keeping enough cash in reserve to buy the stock if assigned. Traders use this strategy when they want to own the stock at a lower price while collecting premium income.
- Example:If a stock is trading at ₹100, selling a ₹95 put allows you to collect premium while being prepared to buy at ₹95 if assigned.
- Maximum Profit:Premium received.
- Maximum Loss:Occurs if stock falls sharply below the strike price.
- Ideal Market Condition:Moderate bullish or sideways movement.
Bearish Strategies
These strategies work well when traders expect the underlying asset price to decline.
- Bear Put Spread
A Bear Put Spread involves buying a higher strike put and selling a lower strike put to profit from a downtrend while limiting cost.
- Example:If a stock is trading at ₹100, buying a ₹105 put and selling a ₹95 put allows you to profit if the stock declines.
- Maximum Profit:Difference between strike prices minus premium paid.
- Maximum Loss:Limited to the premium paid.
- Ideal Market Condition:Gradual bearish movement.
- Covered Call (Bearish to Neutral)
A covered call involves owning the stock while selling a call option against it. This strategy generates premium income but caps potential upside gains.
- Example:Holding a stock trading at ₹100 and selling a ₹110 call ensures you collect premium while limiting profit if the stock rises above ₹110.
- Maximum Profit:Premium received plus capital appreciation up to the strike price.
- Maximum Loss:Loss in stock value, offset by premium income.
- Ideal Market Condition:Mild bearish or sideways movement.
7.6 Strategy -Case Studies
Case Study 1: Using a Covered Call for Passive Income
Background:
An investor holds 100 shares of XYZ Ltd., currently trading at ₹500 per share. Instead of waiting for price appreciation, the investor decides to generate additional income by selling call options.
Strategy: Covered Call
A covered call involves selling a call option while holding the underlying stock. This strategy provides income through premium collection while capping potential gains.
Trade Setup:
- Stock Owned:100 XYZ Ltd. shares at ₹500
- Call Option Sold:Strike price ₹520, expiration in 30 days
- Premium Received:₹10 per share
Possible Outcomes:
- Stock Remains Below ₹520 (Options Expire Worthless)
- Investor keeps the premium ₹10 × 100 = ₹1,000
- Stock remains in portfolio
- Outcome: Profit from premium without selling the stock
2. Stock Rises Above ₹520 (Assignment Occurs)
- Investor sells stock at ₹520 per share
- Earns capital gains of ₹20 per share (+₹10 premium)
- Outcome: Gains are capped but total profit = ₹3,000
3. Stock Drops Below ₹500
- Stock value decreases, but the premium cushions losses
- Outcome: Investor faces unrealized loss but still has premium income
Key Learnings:
- Covered calls work well in neutral to mildly bullish markets.
- They generate passive income but limit upside potential.
- Traders should carefully select strike prices to balance risk and reward.
Case Study 2: Using a Bear Put Spread for Downside Protection
Background:
An investor expects ABC Ltd. to decline but wants a cost-effective hedge rather than buying puts outright. The investor uses a Bear Put Spread, which involves buying a higher strike put and selling a lower strike put to reduce costs.
Strategy: Bear Put Spread
A bear put spread is used when traders expect a moderate decline in stock prices while limiting downside risk.
Trade Setup:
- Stock Price: ₹1,200
- Buy Put Option: Strike price ₹1,180, premium ₹40
- Sell Put Option: Strike price ₹1,160, premium ₹20
- Net Cost: ₹40 – ₹20 = ₹20 per contract
Possible Outcomes:
- Stock Falls Below ₹1,160 (Maximum Profit)
- Long put gains value, short put offsets part of the risk
- Net profit = ₹20 difference in strike prices – ₹20 premium paid = ₹20 per share
- Outcome:Maximum gain from spread
- Stock Stays Between ₹1,160 and ₹1,180
- Partial profit depending on stock price movement
- Outcome:Limited gains as long put increases in value
- Stock Rises Above ₹1,180 (Options Expire Worthless)
- Both options expire worthless
- Loss limited to ₹20 premium paid
- Outcome:Controlled loss scenario
Key Learnings:
- Bear put spreads offer controlled risk exposure for bearish trades.
- They are more cost-efficient than buying puts outright.
- Traders must carefully select strike prices based on expected price movements.
Order Types & Market Maker Role – Strategic Execution Advice
When to Use Which Order Type
|
Order Type |
When to Use |
Why It Matters |
|
Market Order |
Only when bid-ask spread is < ₹0.50 in liquid NIFTY options |
Ensures immediate execution but avoid in wide-spread or low-volume conditions to prevent slippage. |
|
Limit Order |
Crucial for non-liquid stock options, deep OTM strikes, or option spreads |
Gives control over execution price and avoids unnecessary losses from wide bid-ask spreads. |
|
Stop-Limit Order |
Avoid during fast-moving markets like news events or expiry days |
Can result in non-execution during rapid price swings due to limit constraints. |
7.7 Market Maker (MM) Role – What Traders Must Know
Market Makers (MMs) provide liquidity, but they also manage risk—especially in volatile or low-volume conditions. Understanding their behavior can give you a strategic edge.
How MMs Influence Spreads
During Low Volume or High IV Events (e.g., RBI Policy, Budget Week):
MMs widen spreads significantly to hedge against uncertainty. Execution becomes costly if you trade blindly during these periods.
In Illiquid or Deep OTM Options:
MMs either stay passive or quote wide spreads, especially at the start of the week or outside trading hours. This is common in weekly NIFTY/BANKNIFTY OTM options on Monday mornings.
Market Maker (MM) Role – What Traders Must Know
Market Makers (MMs) provide liquidity, but they also manage risk—especially in volatile or low-volume conditions. Understanding their behavior can give you a strategic edge.
How MMs Influence Spreads
During Low Volume or High IV Events (e.g., RBI Policy, Budget Week):
MMs widen spreads significantly to hedge against uncertainty. Execution becomes costly if you trade blindly during these periods.
In Illiquid or Deep OTM Options:
MMs either stay passive or quote wide spreads, especially at the start of the week or outside trading hours. This is common in weekly NIFTY/BANKNIFTY OTM options on Monday mornings.
Execution Strategy for Traders
|
Situation |
Best Execution Strategy |
|
RBI policy, Budget week, or major news |
Use limit orders with patience. Avoid aggressive market orders during the announcement window. |
|
Monday mornings (especially in OTM weeklies) |
Wait for spreads to normalize post-opening or trade closer to ATM where liquidity is better. |
|
Trading Illiquid Stock Options |
Prefer mid-price limit orders, adjust slowly if not filled—don’t chase price. |
|
Scalping or fast trades |
Stick to high-volume strikes with <₹0.30 spread and use limit orders to define risk. |
4.1 What are Options Greek?
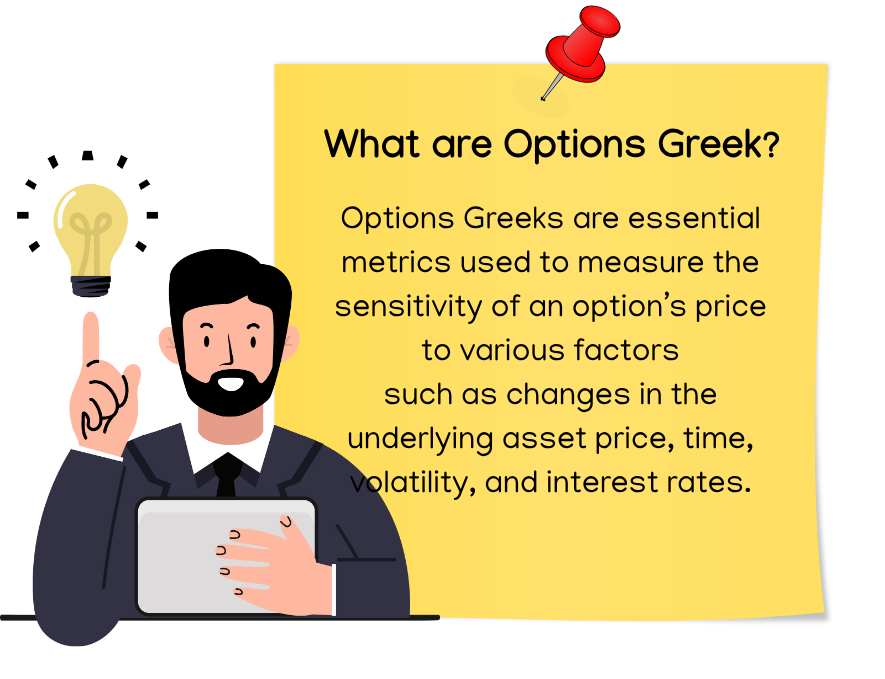
Options Greeks are essential metrics used to measure the sensitivity of an option’s price to various factors such as changes in the underlying asset price, time, volatility, and interest rates. These metrics provide critical insights for traders to assess risk, make informed decisions, and develop effective trading strategies.
The key Greeks include Delta, which measures the change in an option’s price relative to a ₹1 change in the underlying asset’s price, and Gamma, which indicates the rate at which Delta changes with price movements. Theta measures the impact of time decay on an option’s premium, reflecting how options lose value as expiration nears. Vega assesses an option’s price sensitivity to changes in implied volatility, a critical factor during periods of market uncertainty. Lastly, Rho represents the effect of changes in interest rates on the price of an option.
These Greeks are interconnected, allowing traders to understand how various factors influence options pricing simultaneously. For example, Delta shows price sensitivity, while Gamma monitors changes in Delta. By mastering Options Greeks, traders can effectively manage risk, optimize their portfolio, and capitalize on opportunities in volatile markets. They are indispensable for both novice and experienced traders in navigating the dynamic world of options trading.
4.2 What is Delta (Δ)
Delta (Δ) is one of the most crucial Options Greeks, measuring how sensitive an option’s price is to changes in the price of the underlying asset. It reflects the relationship between the price movement of the underlying asset and the price of the option.
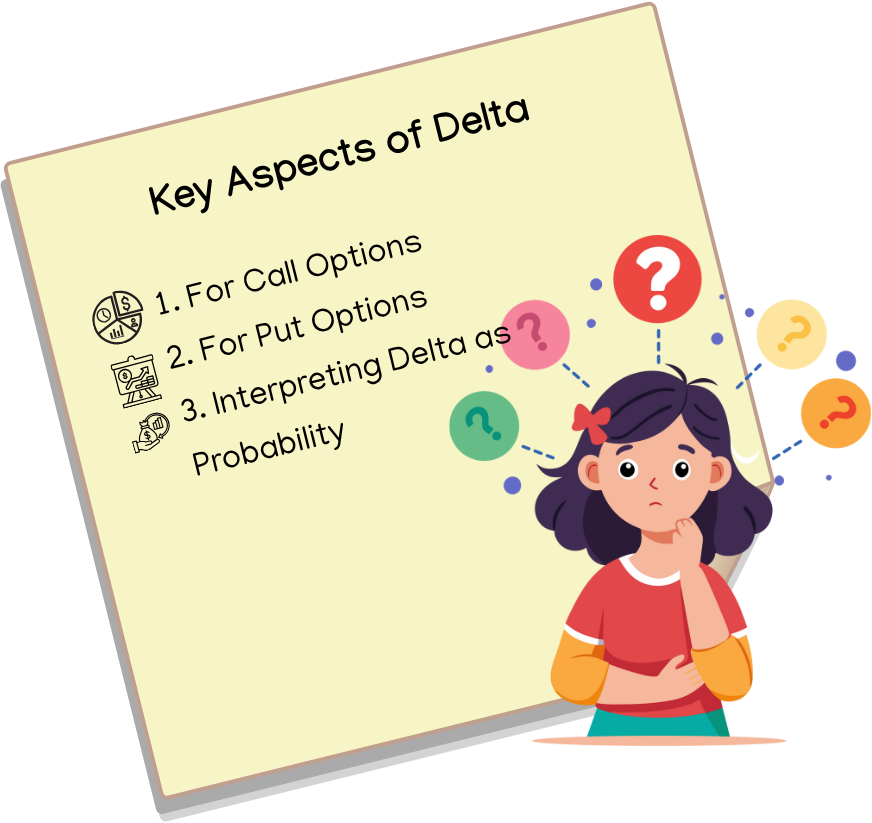
Key Aspects of Delta
For Call Options:
- Delta ranges from 0 to 1.
- A call option with a delta of 0.50 means the option price will increase by ₹0.50 for every ₹1 increase in the price of the underlying asset.
- As the option gets closer to being in-the-money (strike price close to the underlying price), delta approaches 1.
For Put Options:
- Delta ranges from -1 to 0.
- A put option with a delta of -0.50 means the option price will increase by ₹0.50 for every ₹1 decrease in the underlying price.
- As the option becomes deeper in-the-money, delta approaches -1.
Interpreting Delta as Probability:
- Delta can also be seen as the probability of the option expiring in-the-money. For example, a delta of 0.70 for a call option implies a 70% chance of expiring in-the-money.
Delta Behavior
- At-the-Money Options: Delta is approximately 0.50 (for calls) or -0.50 (for puts), meaning they’re equally sensitive to price changes.
- In-the-Money Options: Delta approaches 1 (for calls) or -1 (for puts), reflecting higher sensitivity.
- Out-of-the-Money Options: Delta is closer to 0, as these options are less likely to be exercised.
4.3 Gamma (Γ)
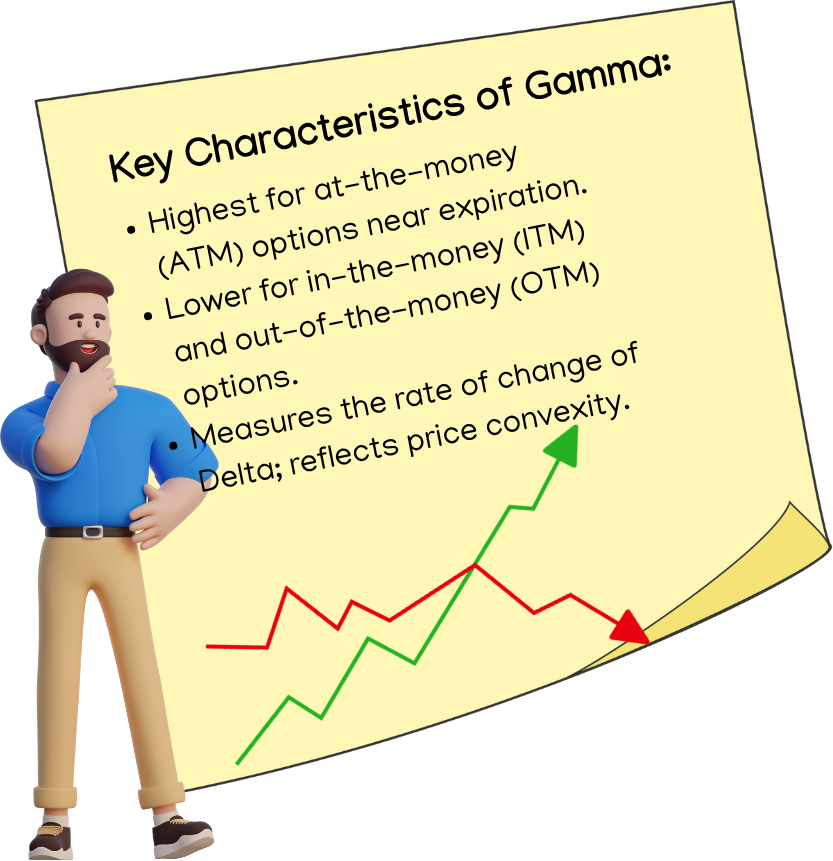
Gamma measures the rate of change in Delta as the underlying asset’s price changes. In other words, Gamma shows how much Delta will increase or decrease when the underlying price moves by ₹1.
Key Characteristics
- Gamma is largest for at-the-money (ATM) options and near expiration.
- It decreases for in-the-money (ITM) and out-of-the-money (OTM) options.
- Gamma is a second-order derivative of the option’s price with respect to the underlying’s price, reflecting the convexity of the option’s price movement.
Impact of Gamma
- High Gamma indicates that Delta changes rapidly, making the option price highly sensitive to the underlying asset’s movement.
- Low Gamma means that Delta is relatively stable, causing minimal changes in the option’s sensitivity.
Application
Gamma is especially useful in hedging:
- Consider a portfolio with an option whose Delta is 0.5 and Gamma is 0.1. If the underlying price increases by ₹2, Delta will change from 0.5 to 0.7 (0.5 + 0.1 × 2). The trader can use Gamma to adjust their Delta-neutral hedging strategy as the underlying price fluctuates.
Challenges of High Gamma
- High Gamma close to expiration creates significant risks, as small price movements in the underlying can lead to large changes in Delta, requiring constant rebalancing.
4.4 What is Theta (Θ)
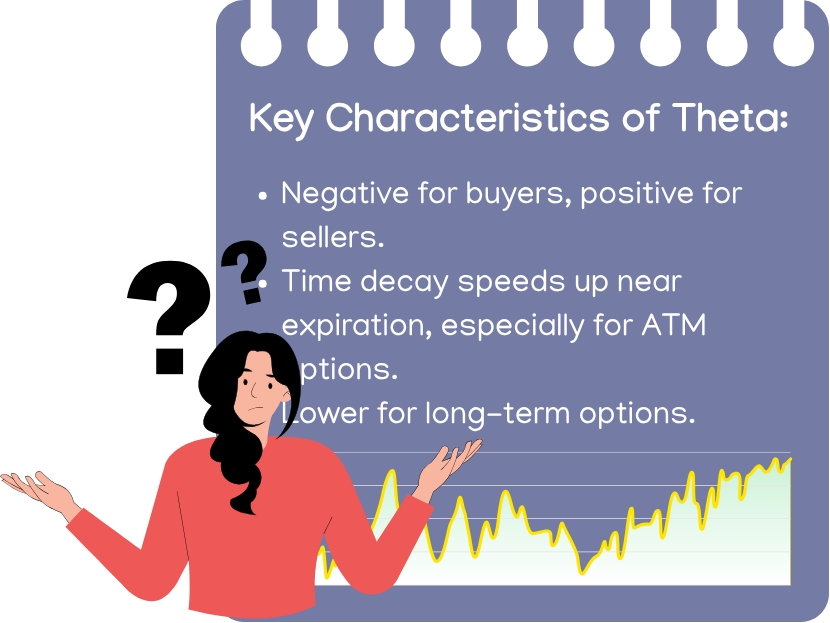
Theta measures the impact of time decay on the option’s price, reflecting how much the option’s value decreases each day as it approaches expiration.
Key Characteristics
- Theta is always negative for option buyers (they lose value over time) and positive for option sellers (they gain value as time passes).
- Time decay accelerates as expiration nears, particularly for at-the-money (ATM) options.
- Long-term options (far from expiration) have lower Theta compared to short-term options.
Impact of Theta
- Time decay works against buyers, as options lose value with each passing day if the underlying price doesn’t move significantly.
- Sellers benefit from Theta as the option premium decreases, especially if the market is range-bound.
Application
For example:
- A call option has a Theta of -5. This means the option will lose ₹5 in value daily, all else being equal.
- Traders selling options (e.g., selling a straddle or covered call) rely on Theta to profit from time decay when they expect minimal price movement.
Theta Management
Buyers must choose their timing carefully, as purchasing options with high Theta can lead to substantial losses if the expected price movement doesn’t occur before expiration.
4.5 Vega (ν)
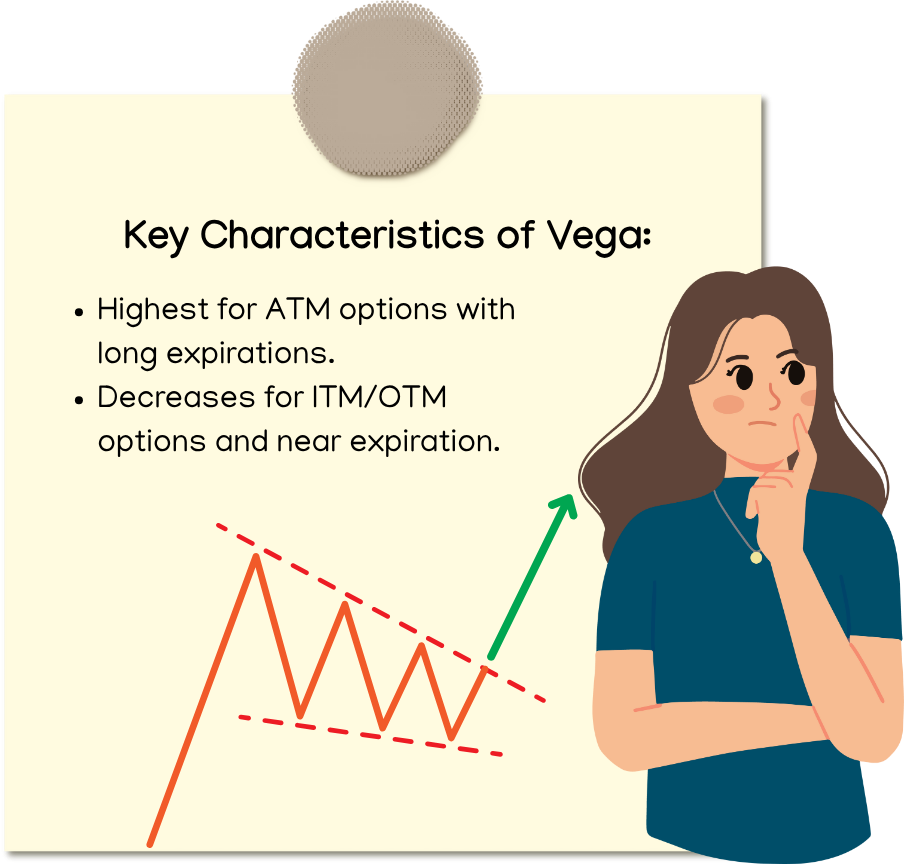
Vega measures the sensitivity of an option’s price to changes in implied volatility (IV). It shows how much the option’s price will increase or decrease for a 1% change in IV.
Key Characteristics
- Vega is highest for at-the-money (ATM) options with longer expiration periods.
- It decreases for in-the-money (ITM) or out-of-the-money (OTM) options and as expiration approaches.
Impact of Vega
- When implied volatility rises, option prices (both calls and puts) increase, benefiting buyers.
- When implied volatility drops, option prices decrease, benefiting sellers due to the volatility “crush.”
Application
Suppose an option has a Vega of 0.10 and its premium is ₹100. If implied volatility rises by 5%, the option’s price increases by ₹0.10 × 5 = ₹0.50, making the new premium ₹100.50.
Volatility Strategies
- Buyers look for opportunities in high-volatility environments, expecting significant price movements.
- Sellers capitalize on low volatility or post-event scenarios (volatility crush) to profit from declining premiums.
4.6 Rho (ρ)
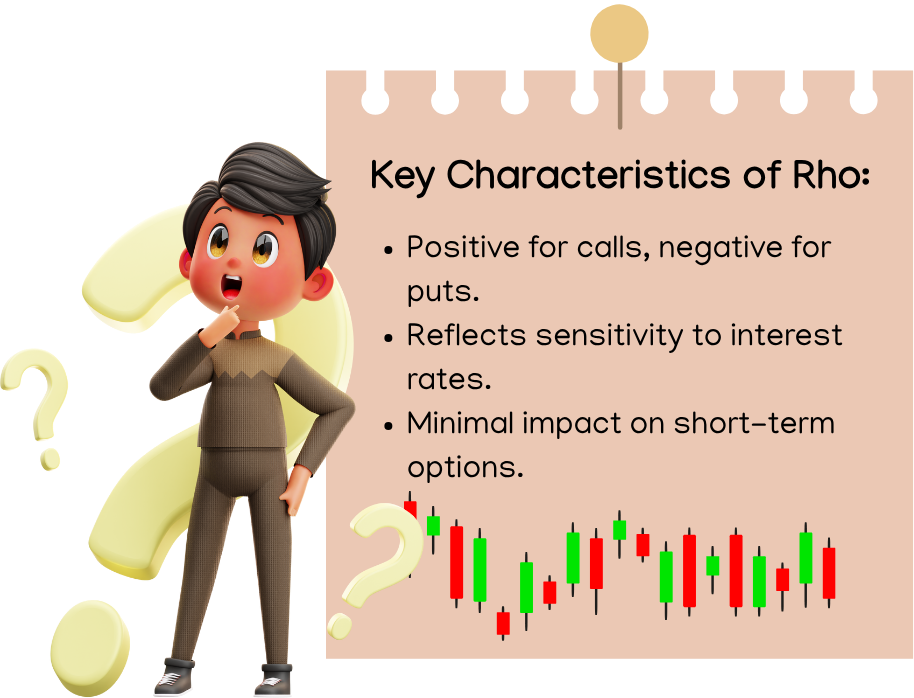
Rho measures the sensitivity of an option’s price to changes in the risk-free interest rate. It is less influential compared to other Greeks but becomes significant for long-term options.
Key Characteristics
- Call Options: Rho is positive because higher interest rates reduce the present value of the strike price, making calls more attractive.
- Put Options: Rho is negative because higher interest rates reduce the present value of the strike price, making puts less attractive.
- Rho’s impact is minimal for short-term options, as interest rate changes affect them less.
Impact of Rho
- A long-term call option with a Rho of 0.05 will gain ₹0.05 in value for every 1% increase in interest rates.
- A long-term put option with a Rho of -0.05 will lose ₹0.05 in value for every 1% increase in interest rates.
Application
Rho is important for traders focusing on longer-duration options or during periods of fluctuating interest rates, such as central bank policy announcements.
How the Greeks Work Together
- Gamma supports Delta: It refines Delta’s effectiveness by predicting its changes.
- Theta interacts with Vega: In high-volatility scenarios, Vega can offset Theta’s time decay.
- Rho complements the others: It factors in macroeconomic changes, particularly for long-term options.
4.7 Interplay of Greeks

The interplay of Greeks is critical in options trading as each Greek captures a specific risk factor. Monitoring and combining them provides a holistic view of how options behave under different scenarios. Let’s break down the points you mentioned in detail:
- Gamma Adjusts Delta
What It Means:
- Delta measures how much the option’s price will change with a ₹1 change in the underlying asset price.
- Gamma measures the rate of change of Delta for every ₹1 change in the underlying price. Essentially, Gamma adjusts Delta dynamically as the underlying price moves.
Why It Matters:
- Delta doesn’t remain constant; it changes as the price of the underlying asset fluctuates.
- High Gamma indicates that Delta changes rapidly, making the option more sensitive to price movements.
- Low Gamma means that Delta changes slowly, offering stability.
Practical Implications:
- Hedging:
- A Delta-neutral portfolio (where Delta = 0) must be adjusted frequently if Gamma is high. For example, as the underlying asset moves, traders rebalance their positions to keep Delta neutral.
- Gamma hedging ensures that adjustments account for the rapid changes in Delta.
Example:
- A call option has Delta of 0.50 and Gamma of 0.10. If the underlying price rises by ₹2, Delta increases to 0.70 (0.50 + 0.10 × 2). The trader must adjust their position to maintain Delta neutrality.
- Vega Offsets Theta During Volatile Conditions
What It Means:
- Theta measures the impact of time decay on an option’s price. As time passes, an option loses value due to Theta, especially for buyers.
- Vega measures the sensitivity of an option’s price to changes in implied volatility (IV). When volatility rises, Vega increases the option premium.
Why It Matters:
- During periods of high volatility, the increase in Vega can offset the loss caused by Theta. This is particularly beneficial for buyers of options.
- In contrast, when volatility drops, Vega decreases the option premium, amplifying the losses caused by Theta. This situation benefits sellers, as they profit from both time decay and volatility reduction.
Practical Implications:
- Volatility-Based Strategies:
- If a trader expects high volatility (e.g., before earnings reports), they might buy options to benefit from Vega outweighing Theta.
- If volatility crush is expected (e.g., after an event), sellers profit as both Vega and Theta work in their favor.
Example:
- A trader buys an at-the-money option with Theta of -2 and Vega of 0.10. If volatility increases by 5%, the option gains ₹0.50 due to Vega (0.10 × 5), potentially offsetting the ₹2 loss from Theta decay.
- Rho Complements Long-Term Interest Rate Strategies
What It Means:
- Rho measures the sensitivity of an option’s price to changes in interest rates.
- Changes in interest rates primarily affect the present value of the strike price. Call options gain value as interest rates rise, while put options lose value.
Why It Matters:
- Rho becomes significant for long-term options or during periods of interest rate fluctuations.
- It helps traders assess the broader macroeconomic impact on their positions, especially when central banks adjust interest rates.
Practical Implications:
- Long-Term Hedging:
- For long-term options (e.g., LEAPS), traders consider Rho to understand how rate changes will impact their portfolio value.
- Traders holding long-dated call options benefit from rising interest rates due to positive Rho.
Example:
- A trader holds a call option with a Rho of 0.05. If interest rates increase by 1%, the option’s price rises by ₹0.05. For portfolios sensitive to interest rates, Rho becomes a critical factor.
|
Greek |
Most Affected Strategies |
Importance |
|
Delta |
Covered Calls, Long Calls |
Directional Bias |
|
Gamma |
Gamma Scalping, Short Straddles |
Adjustments, Volatility Risk |
|
Theta |
Iron Condor, Credit Spreads |
Time Decay Income |
|
Vega |
Long Straddles, Calendar Spreads |
Volatility Trading |
|
Rho |
LEAPS, Long-Term Hedging |
Interest Rate Risk |
4.8 When is Greek most important?

|
Greek |
When is it Important? |
Strategies Most Sensitive |
|
Delta |
Directional price moves |
Long Calls/Puts, Spreads, Covered Calls |
|
Gamma |
Rapid price changes, hedging |
Straddles, ATM near expiry, Delta-neutral |
|
Theta |
Time decay near expiry |
Short Options, Credit Spreads, Iron Condors |
|
Vega |
Volatility changes |
Long Straddles, Calendars, Long Options |
|
Rho |
Interest rate shifts |
LEAPS, Bond Options, Long-term Calls/Puts |
4.9 Risk Graphs

Delta
Delta risk graphs are used to assess and manage option trading risks. Here’s why they are important:
- Risk Management:Traders use delta to understand how an option’s price will react to movements in the underlying asset. A high delta means the option moves almost like the stock itself, while a low delta means less sensitivity.
- Hedging Strategies:Institutions and traders use delta to hedge portfolios against market movements. A delta-neutral strategy, for example, balances positive and negative deltas to reduce risk exposure.
- Predicting Option Behavior:Seeing how delta shifts helps traders anticipate how an option will behave as the stock price moves and decide whether to buy or sell options.
- Position Adjustment:A changing delta can signal when to adjust positions to maintain a desired level of exposure or protection.
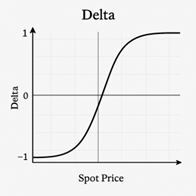
This graph represents the relationship between delta and the underlying asset’s spot price. Here’s how to interpret it:
- Delta (Y-Axis):Measures how much an option’s price changes with a ₹1 movement in the underlying asset. For call options, delta ranges from 0 to 1, and for put options, it ranges from 0 to -1.
- Spot Price (X-Axis):Represents the market price of the underlying asset.
- Shape of the Curve:
- For call options, delta increases as the spot price rises, moving closer to 1.
- For put options, delta decreases as the spot price rises, moving closer to -1.
Gamma Effect:This influences how steeply delta changes. A high gamma means delta adjusts rapidly when the spot price is near the strike price.
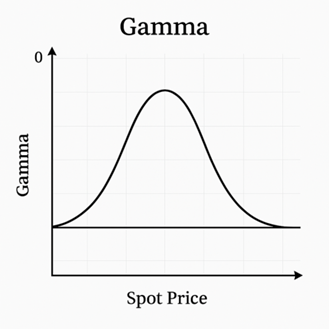
Gamma peaks at ATM and drops for ITM/OTM
This graph illustrates the behavior of gamma in relation to the underlying asset’s price and the option’s moneyness (ITM, ATM, OTM). Here’s how it works:
- Gamma (Y-Axis):Measures the rate of change of delta as the underlying asset price changes. A higher gamma means delta adjusts rapidly.
- Spot Price (X-Axis):Represents the market price of the underlying asset.
- Peak at ATM:Gamma is highest for at-the-money (ATM) options because delta is most sensitive when the option is near its strike price.
- Drop for ITM and OTM:Gamma declines as options move in-the-money (ITM) or out-of-the-money (OTM) because delta stabilizes.
- ITM options:Already have significant intrinsic value, so delta remains high and changes slowly.
- OTM options:Have low delta and are less sensitive to price movements.
Essentially, gamma is crucial for options traders because it affects how aggressively delta moves, helping them anticipate price shifts and adjust their strategies accordingly.
Theta decay over time (exponential curve)
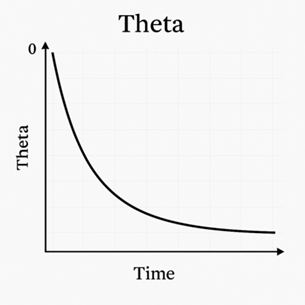
Theta measures how the value of an option decreases as time passes, especially as expiration approaches. The decay tends to follow an exponential curve, meaning that early in an option’s life, the time decay is gradual. However, as expiration nears, theta accelerates rapidly, causing the option’s value to drop significantly.
Key takeaways:
- Time Factor:Options lose value over time, assuming other factors remain constant.
- Acceleration Near Expiry:The decay rate speeds up as the option gets closer to expiration.
- Impact on Trading:Traders managing short options must be mindful of theta decay, while long option holders often struggle with time working against them.
Vega highest at ATM, especially for long-dated options
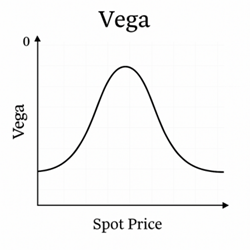
Vega measures an option’s sensitivity to changes in implied volatility. It is highest for at-the-money (ATM) options because volatility has the greatest impact when the option is near the strike price. The effect is even more pronounced for long-dated options, as they have more time for implied volatility to influence their price.
Key points:
- ATM Options: Experience the strongest Vega effects since small volatility shifts significantly impact the option’s value.
- Long-Dated Options: Higher Vega because time amplifies the role of volatility.
- Short-Term vs. Long-Term: Short-term options have lower Vega since they have less time for volatility to play a role.
4.10 Real World Examples

1. Delta (Δ) – Directional Sensitivity
When is it most important?
Delta measures how much an option’s price is expected to change for a ₹1 change in the underlying asset’s price. It is crucial when you have a directional view on the market and want to understand how option premiums will respond to price movements.
Strategies most sensitive to Delta:
- Long Calls and Puts
- Covered Calls
- Protective Puts
- Vertical Spreads
📌 Example:
Suppose you own 100 shares of Infosys, currently trading at ₹1,500. You decide to sell a call option with a strike price of ₹1,550, expiring in one month, for a premium of ₹30. This call option has a Delta of 0.55.
If Infosys’s stock price rises by ₹10 to ₹1,510, the price of the call option is expected to increase by ₹5.50 (₹10 × 0.55). This means the option you sold becomes more valuable, potentially leading to a loss if you need to buy it back. Understanding Delta helps you assess how much the option’s price will move relative to the stock’s price, aiding in strike price selection and risk management.
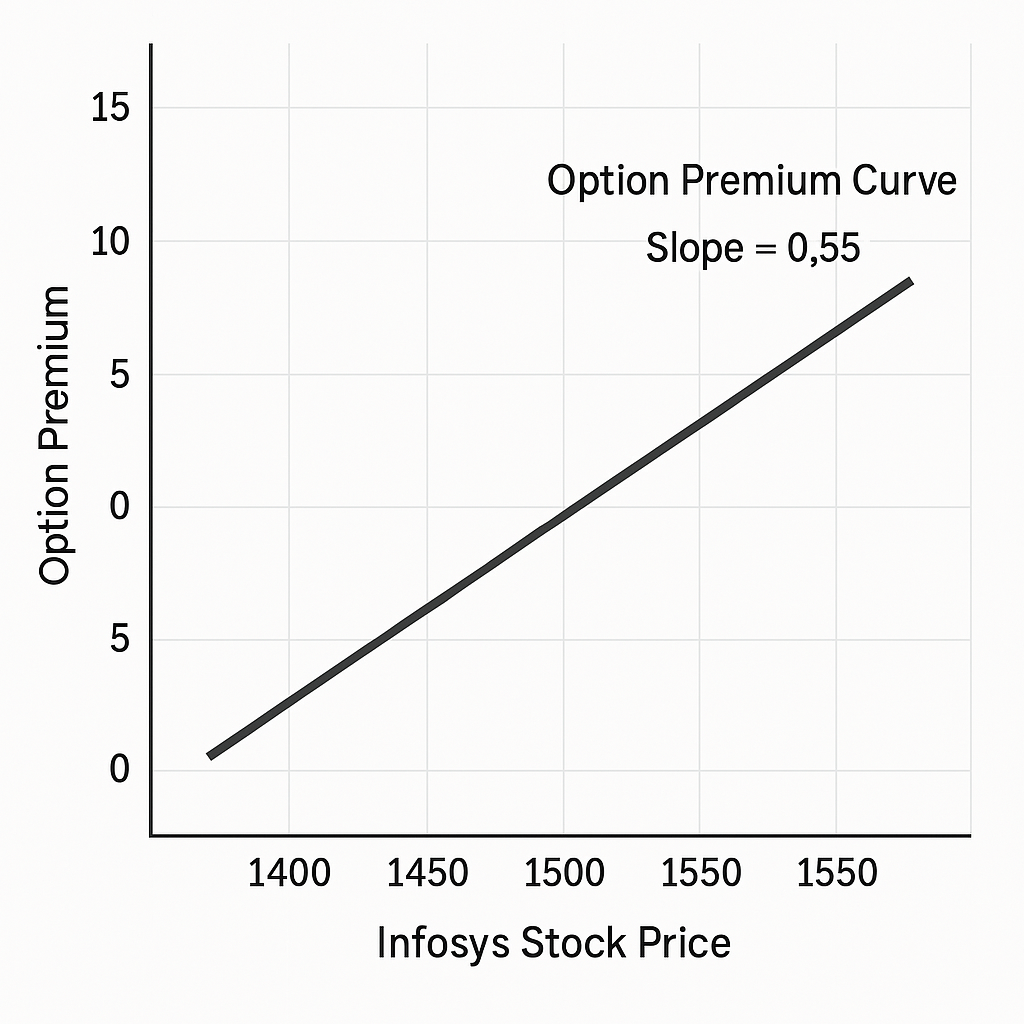
📊 Graph Description:
- X-axis: Infosys Stock Price
- Y-axis: Option Premium Curve:
- A straight line with a slope of 0.55, indicating that for every ₹1 increase in stock price, the option premium increases by ₹0.55 give image
2. Gamma (Γ) – Rate of Change of Delta
When is it most important?
Gamma measures the rate of change of Delta with respect to the underlying asset’s price. It is most significant for at-the-money options nearing expiration, as small movements in the underlying can lead to large changes in Delta.
Strategies most sensitive to Gamma:
- Long Straddles and Strangles
- Short-term ATM Options
- Delta-Neutral Portfolios
📌 Example:
Imagine you’re trading NIFTY options, and the index is at 18,000. You purchase a 18,000 strike price call option expiring in two days, which has a Delta of 0.50 and a Gamma of 0.10.
If NIFTY moves up by 100 points to 18,100, the Delta of your option would increase by 0.10 to 0.60. This means the option’s sensitivity to further price movements has increased, and its price will now change more rapidly with NIFTY’s movements. Gamma helps you understand how your position’s risk profile evolves with market movements, especially near expiration.
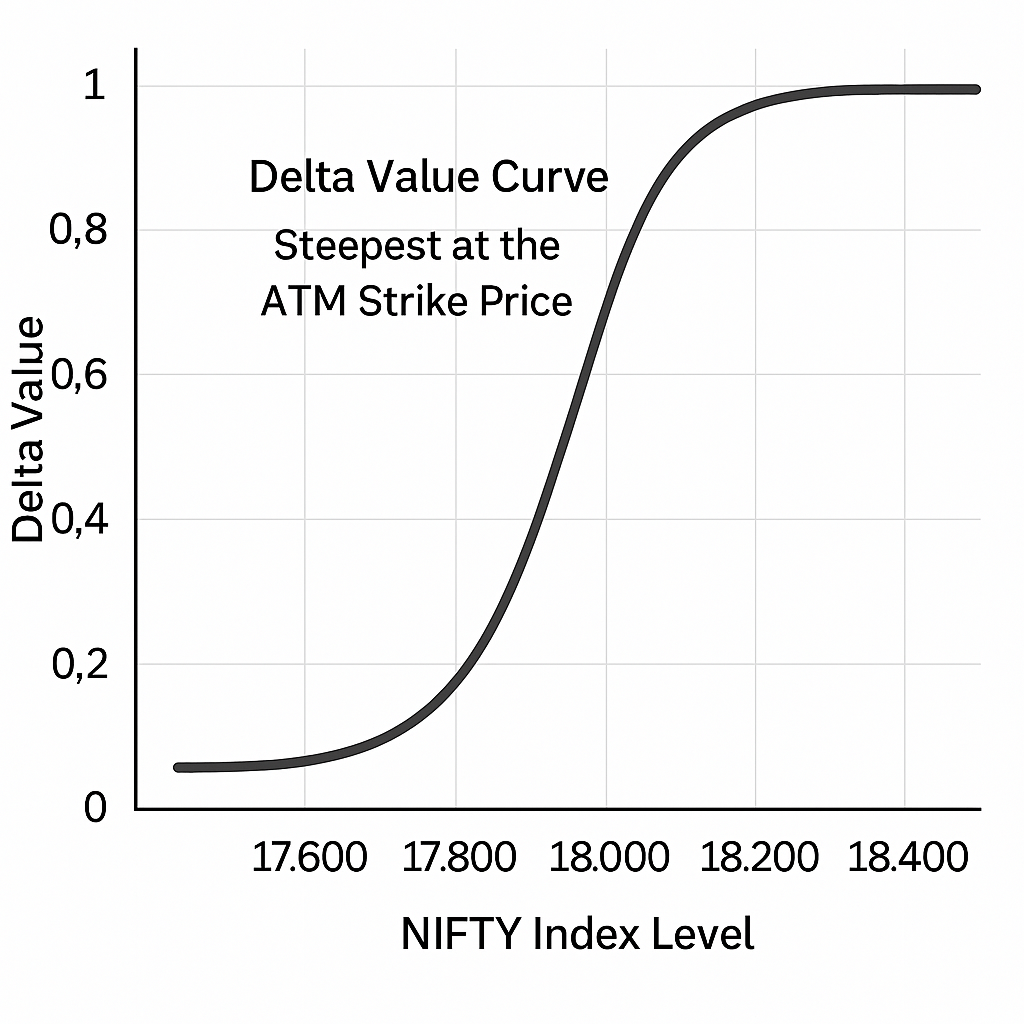
📊 Graph Description:
- X-axis: NIFTY Index Level
- Y-axis: Delta Value
- Curve: An S-shaped curve that is steepest at the ATM strike price, illustrating how Delta changes more rapidly near the ATM as expiration approaches.
-
Theta (Θ) – Time Decay
When is it most important?
Theta measures the rate at which an option’s value decreases as it approaches expiration, assuming all other factors remain constant. It is particularly important for options sellers and for short-term trading strategies.
Strategies most sensitive to Theta:
- Short Options (Naked Calls/Puts)
- Credit Spreads
- Iron Condors
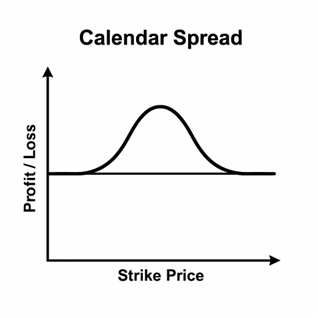
- Calendar Spreads (Short Leg)
📌Example:
Suppose you sell a Bank Nifty 40,000 strike price call option expiring in three days for a premium of ₹100. The option has a Theta of -₹20.
This means that, all else being equal, the option’s premium will decrease by ₹20 each day due to time decay. If Bank Nifty remains below 40,000, you can potentially profit from the erosion of the option’s value over time. Theta is crucial for understanding how the passage of time affects option premiums, especially for short-term strategies.
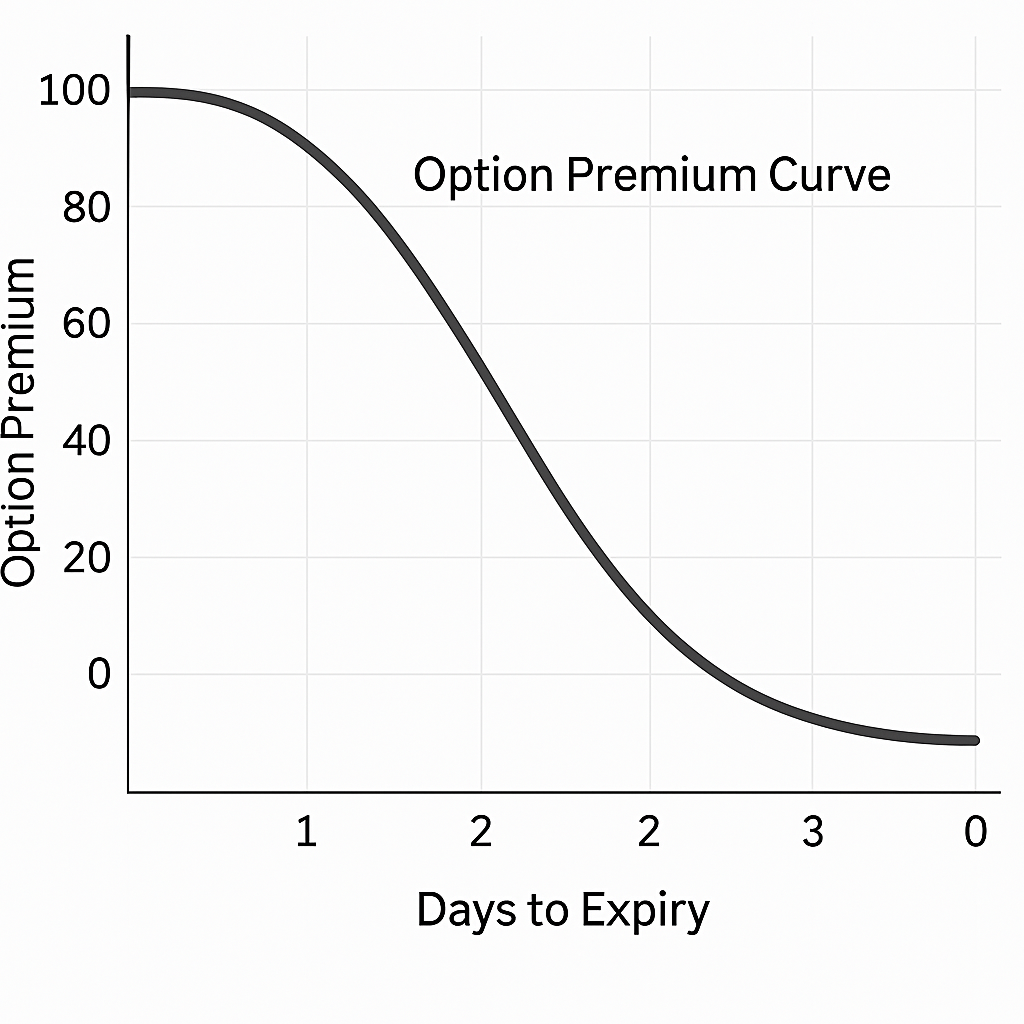
📊 Graph Description:
- X-axis: Days to Expiry
- Y-axis: Option Premium
- Curve: A downward-sloping curve that becomes steeper as expiration approaches, indicating accelerated time decay. give image
Vega (ν) – Volatility Sensitivity
When is it most important?
Vega measures the sensitivity of an option’s price to changes in the implied volatility of the underlying asset. It is vital when trading strategies that are sensitive to volatility changes, such as during earnings announcements or major economic events.
Strategies most sensitive to Vega:
- Long Straddles and Strangles
- Long Options
- Calendar and Diagonal Spreads
📌 Example:
Consider you anticipate increased volatility in Reliance Industries due to an upcoming earnings report. You buy a straddle by purchasing both a call and a put option at the ₹2,500 strike price, each with a Vega of ₹0.15.
If implied volatility increases by 5% after the earnings announcement, each option’s premium is expected to increase by ₹0.75 (₹0.15 × 5), benefiting your position. Vega helps you assess how changes in market expectations of volatility can impact your options’ value.
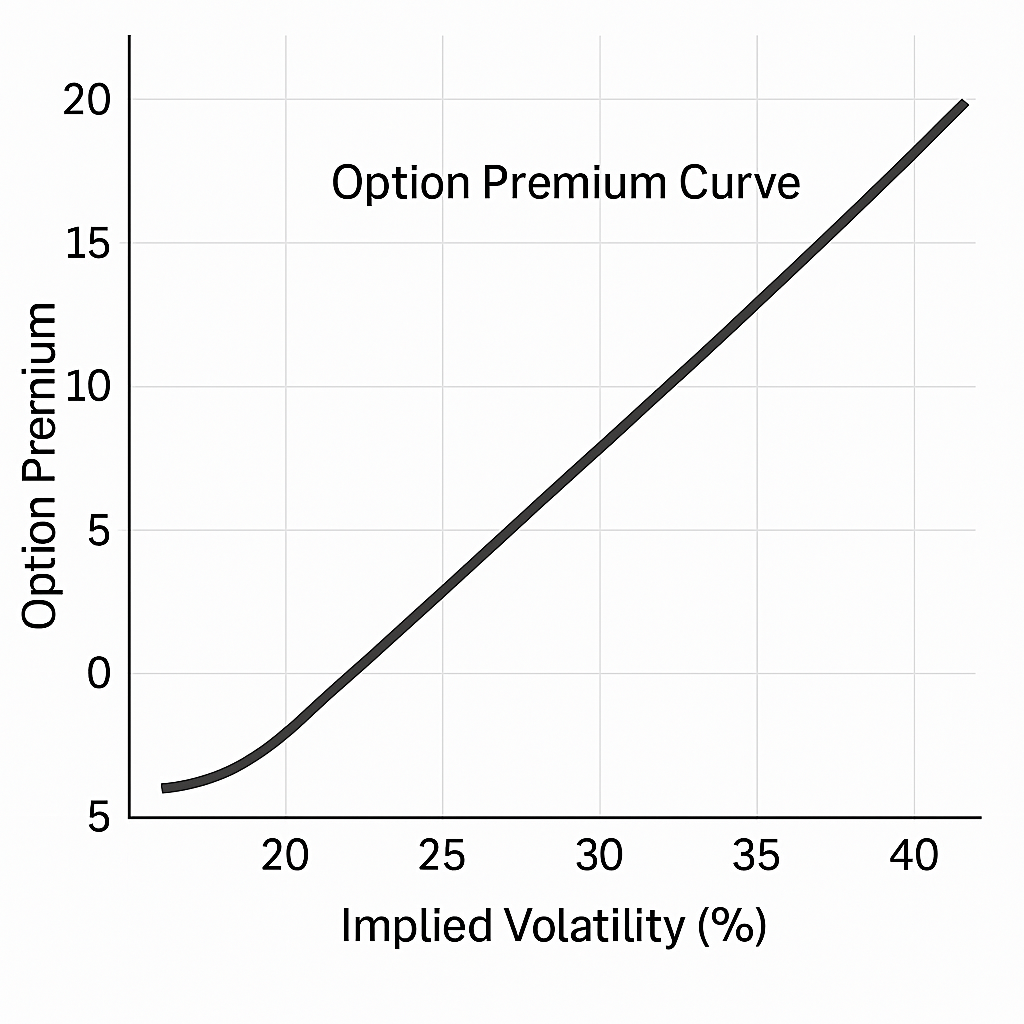
📊 Graph Description:
- X-axis: Implied Volatility (%)
- Y-axis: Option Premium
- Curve: An upward-sloping line, showing that as implied volatility increases, the option premium increases proportionally
Rho (ρ) – Interest Rate Sensitivity
When is it most important?
Rho measures the sensitivity of an option’s price to changes in the risk-free interest rate. It becomes more relevant for long-term options and in environments where interest rates are changing significantly.
Strategies most sensitive to Rho:
- Long-term Options (LEAPS)
- Interest Rate Sensitive Instruments
- Bond Options
📌 Example:
Suppose you hold a long-term call option on HDFC Bank with a strike price of ₹1,500, expiring in one year, and a Rho of 0.05.
If the Reserve Bank of India increases interest rates by 1%, the value of your call option is expected to increase by ₹0.05 (₹1 × 0.05), assuming all other factors remain constant. While Rho is often less significant than other Greeks, it can impact the pricing of long-dated options in changing interest rate environments.
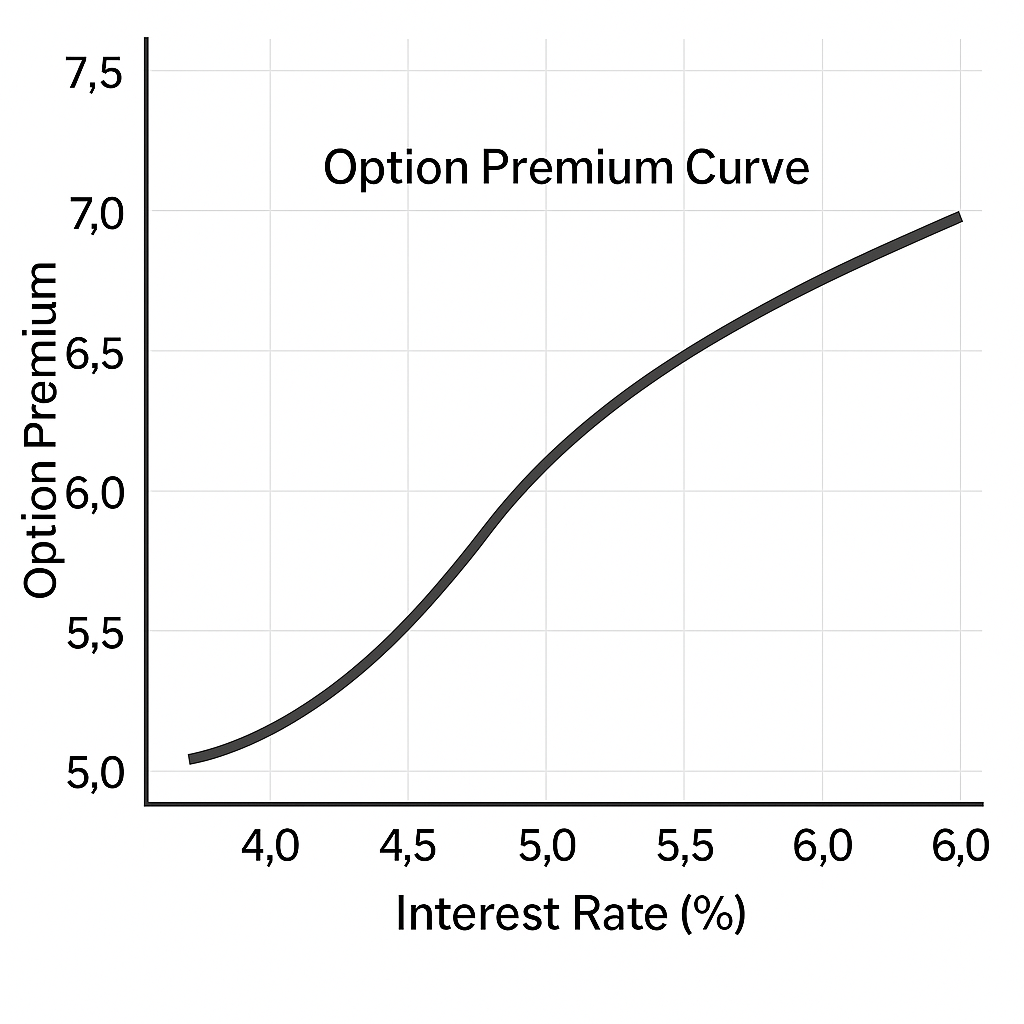
Graph Description:
- X-axis: Interest Rate (%)
- Y-axis: Option Premium
- Curve: A gently upward-sloping line, indicating that as interest rates increase, the premium of call options increases slightly.
Summary Table:
|
Greek |
Significance |
Sensitive Strategies |
Indian Market Example |
|
Delta (Δ) |
Measures option price change relative to underlying asset price changes |
Long Calls/Puts, Covered Calls, Vertical Spreads |
Infosys Covered Call |
|
Gamma (Γ) |
Measures rate of change of Delta; important for ATM options near expiration |
Straddles, Short-term ATM Options, Delta-Neutral Portfolios |
NIFTY ATM Call Option |
|
Theta (Θ) |
Measures time decay; crucial for options sellers |
Short Options, Credit Spreads, Iron Condors |
Bank Nifty Short Call |
|
Vega (ν) |
Measures sensitivity to volatility changes; important during events |
Long Straddles/Strangles, Calendar Spreads |
Reliance Earnings Straddle |
|
Rho (ρ) |
Measures sensitivity to interest rate changes; relevant for long-term options |
LEAPS, Bond Options |
HDFC Bank Long-Term Call |
4.11 Greeks in Multi-Leg Strategies

Offsetting Greeks in Spreads
Calendar Spreads (Vega and Theta):
- Structure:Involves selling a near-term option and buying a longer-term option at the same strike price.
- Greek Dynamics:
- Vega:The long-term option has higher Vega, making the position sensitive to changes in implied volatility.
- Theta:The near-term option decays faster, benefiting the seller due to higher Theta.
Practical Insight:If implied volatility increases, the long-term option’s value rises more than the short-term option’s loss, leading to a net gain.
Iron Condors (Delta and Gamma):
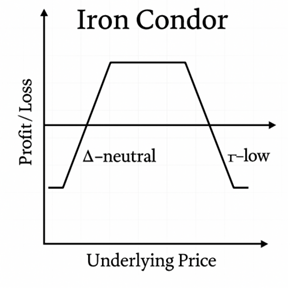
- Structure:Combines a bear call spread and a bull put spread, aiming to profit from low volatility.
- Greek Dynamics:
- Delta:Designed to be Delta-neutral, minimizing directional risk.
- Gamma:Low Gamma implies the position is less sensitive to large price movements.
Practical Insight:Ideal in stable markets, but sudden price swings can lead to significant losses due to Gamma risk.
Balancing Risk in Neutral Strategies
Straddles and Strangles:
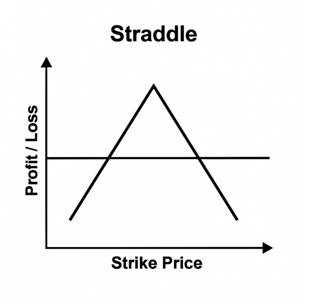
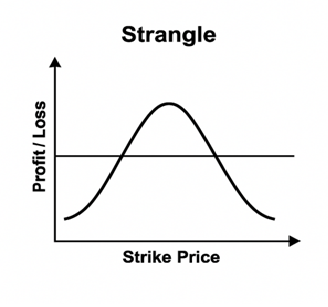
- Structure:Involves buying or selling both call and put options at the same (straddle) or different (strangle) strike prices.
- Greek Dynamics:
- Delta:Neutral at initiation but can become directional with price movements.
- Gamma:High Gamma near expiration, leading to rapid Delta changes.
- Theta:Short positions benefit from time decay; long positions suffer.
Practical Insight:Short straddles/strangles can be profitable in low volatility but carry significant risk if the underlying moves sharply.
Adjusting Across Expirations
Diagonal Spreads:
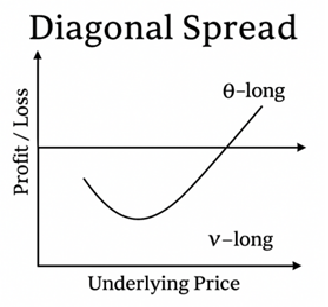
- Structure:Combines options of different strike prices and expiration dates.
- Greek Dynamics:
- Theta:Short-term option decays faster, benefiting the position.
- Vega:Long-term option is more sensitive to volatility changes.
Practical Insight:Useful when expecting gradual price movement and an increase in volatility.
4.12 Greeks in Expiry Trading (Weekly Options)

Theta and Gamma Risks Near Expiry
- Theta:Time decay accelerates as expiration approaches, especially for at-the-money (ATM) options.
- Gamma:Becomes more pronounced near expiry, causing Delta to change rapidly with small price movements.
- Practical Insight:Shorting ATM options close to expiry can be lucrative due to high Theta but risky due to Gamma spikes.
Gamma Spikes and Short Straddles
- Scenario:On expiry day, a short straddle (selling both call and put at the same strike) can be profitable if the underlying remains stable.
- Risk:A sudden price move can lead to significant losses due to rapid Delta changes driven by high Gamma.
- Practical Insight:Implementing stop-loss orders and closely monitoring positions is crucial on expiry days.
Delta Hedging Challenges
- Issue:Near expiry, high Gamma makes Delta hedging difficult, as small price changes require frequent adjustments.
- Practical Insight:Traders should be cautious with Delta-neutral strategies close to expiration and consider reducing position sizes.
4.13 Practical Tips for Retail Traders

- Avoid Shorting ATM Options on Thursdays:High Gamma risk can lead to significant losses with minimal price movement.
- Be Wary of Long Straddles Without Volatility Increase:If implied volatility doesn’t rise as expected, Theta decay can erode profits.
- Delta-Neutral Isn’t Risk-Neutral:Even if Delta is neutralized, Gamma and Vega can introduce significant risks.
- Monitor Implied Volatility:Understanding Vega’s impact is crucial, especially when trading around events like earnings announcements.
- Use Stop-Loss Orders:Protect against unexpected market movements, especially near expiry.
- Educate Yourself Continuously:Options trading is complex; ongoing learning is essential for success.