2.1 What Are ITM, ATM, and OTM Options?
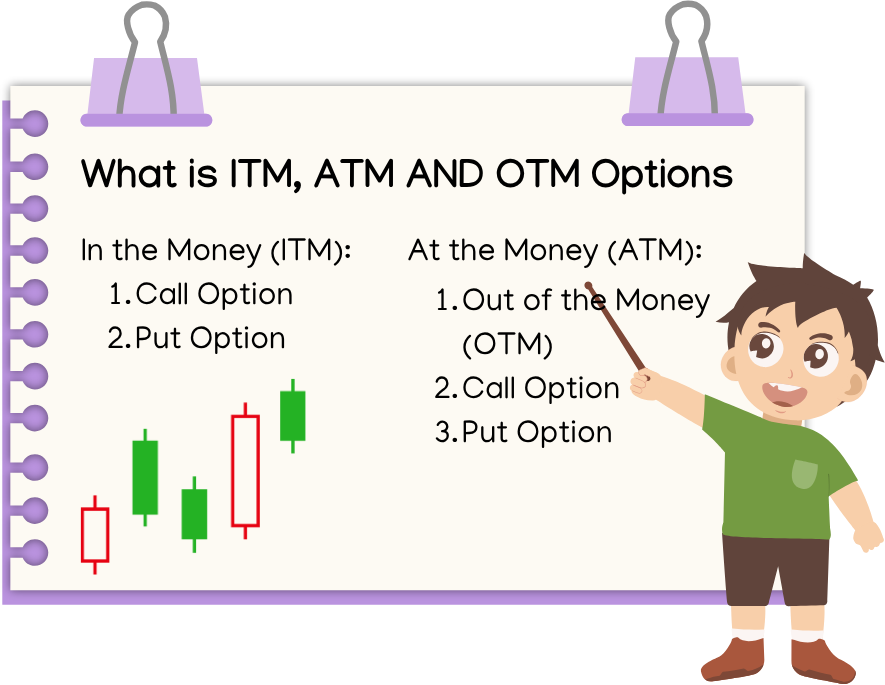
In the Money (ITM):
- Call Option:A call option is “in the money” when the strike price is below the current market price of the underlying asset. This means exercising the option would allow the buyer to purchase the asset at a lower price than its current market value.
- Put Option:A put option is “in the money” when the strike price is above the current market price of the underlying asset. This means exercising the option would allow the buyer to sell the asset at a higher price than its current market value.
At the Money (ATM):
An option is considered “at the money” when the strike price is equal to or very close to the current market price of the underlying asset. In this case, exercising the option results in no intrinsic profit.
Out of the Money (OTM):
- Call Option:A call option is “out of the money” when the strike price is above the current market price of the underlying asset. Exercising it would mean buying the asset at a price higher than its market value, which isn’t profitable.
- Put Option:A put option is “out of the money” when the strike price is below the current market price of the underlying asset. Exercising it would mean selling the asset at a lower price than its market value, which also isn’t profitable.
Example as per ITM, ATM and OTM with respect to Power Sector
In the Money (ITM):
Imagine a call option for electricity priced at ₹5 per unit, while the current market price is ₹6 per unit. This option is “in the money” because exercising it allows the buyer to purchase electricity at ₹5, which is cheaper than the market price.
Similarly, a put option priced at ₹7 per unit is “in the money” if the current market price is ₹6 per unit. Exercising this option lets the seller sell electricity at ₹7, higher than the market price.
At the Money (ATM):
If the strike price of the option is ₹6 per unit and the current market price is also ₹6 per unit, the option is “at the money.” Exercising it would result in no intrinsic profit.
Out of the Money (OTM):
A call option priced at ₹7 per unit is “out of the money” if the current market price is ₹6 per unit. Exercising it would mean buying electricity at ₹7, which is more expensive than the market price. A put option priced at ₹5 per unit is “out of the money” if the current market price is ₹6 per unit. Exercising it would mean selling electricity at ₹5, which is lower than the market price.
2.2 ITM vs ATM vs OTM Options – Risk Graphs Explained
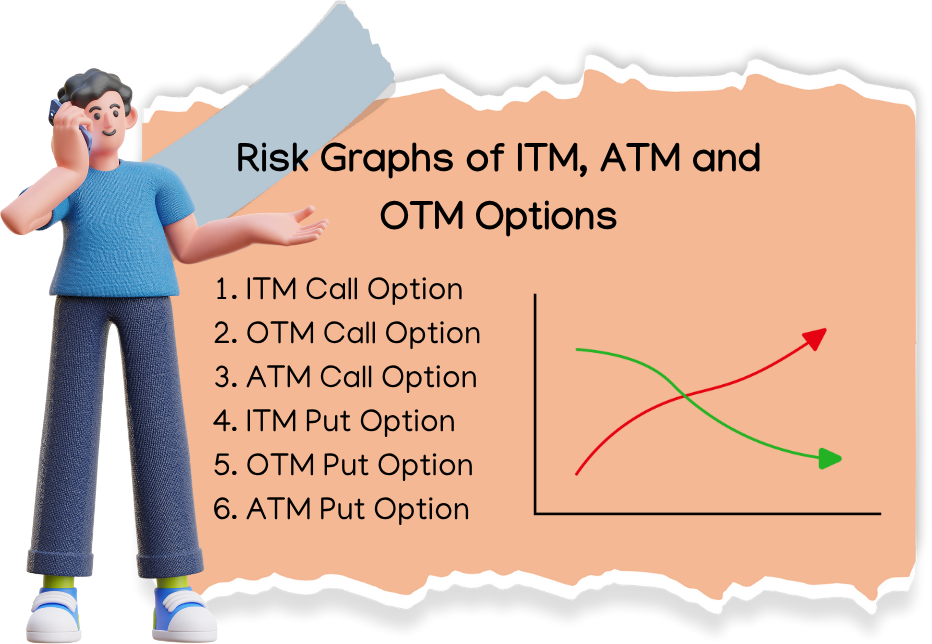
ITM Call Option:
- The graph will start above zero on the left (showing intrinsic value).
- It rises steeply with increasing underlying price.
- The risk is capped by the premium paid (as the price can never go lower than zero).

Imagine you purchase an ITM (In-The-Money) call option with:
- Strike Price: ₹100
- Premium Paid: ₹10
Here’s how it plays out at different stock prices at expiry:
- If the stock price is ₹90, you incur a loss of ₹10 (you can’t exercise the option, so you only lose the premium).
- If the stock price is ₹110, you break even. Your profit from the option is ₹10 (₹110 – ₹100), which offsets the ₹10 premium paid.
- If the stock price is ₹150, you make a profit of ₹40. Here’s how: ₹150 (stock price) – ₹100 (strike price) – ₹10 (premium paid) = ₹40.
This aligns with the graph’s key characteristics:
- The graph starts below zero to reflect the premium paid.
- It flattens until the stock price equals the strike price (no intrinsic value below this point).
- After crossing the strike price, it rises steeply, showing increasing profits as the stock price climbs.
OTM Call Option:
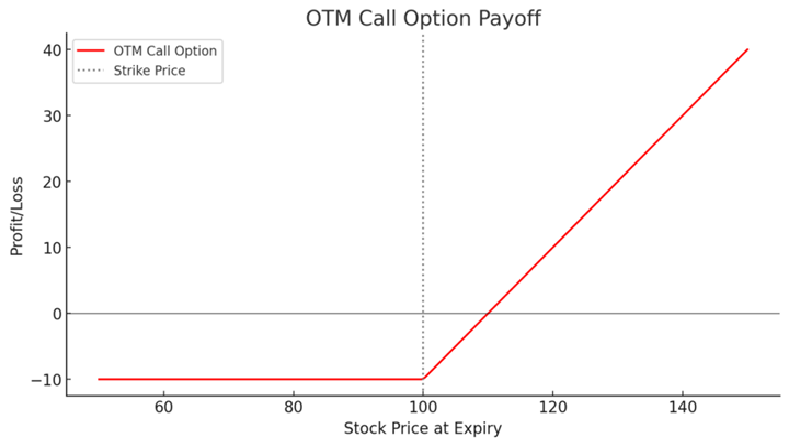
- The graph starts at zero, and only increases as the underlying price exceeds the strike price.
- The risk of loss increases as the price doesn’t move in favor of the option (as it can lose all the premium paid).
Suppose you buy an OTM call option with:
- Strike Price: ₹150
- Premium Paid: ₹10
Here’s what happens at different stock prices on expiry:
- If the stock price is ₹140, the option expires worthless because the stock price is below the strike price. You lose the entire premium of ₹10.
- If the stock price is ₹150, you still incur a loss of ₹10 (your premium) because the option doesn’t yield any intrinsic value (the strike price equals the stock price).
- If the stock price is ₹170, you make a profit of ₹10: ₹170 (stock price) – ₹150 (strike price) – ₹10 (premium paid) = ₹10.
- If the stock price is ₹200, your profit jumps to ₹40: ₹200 (stock price) – ₹150 (strike price) – ₹10 (premium paid) = ₹40.
How It Relates to the Graph:
- The graph starts at zero (at strike price ₹150) and rises steeply as the stock price exceeds the strike price, showing growing profits.
- The risk is limited to the premium paid (₹10), as the graph never dips below zero.
ATM Call Option:
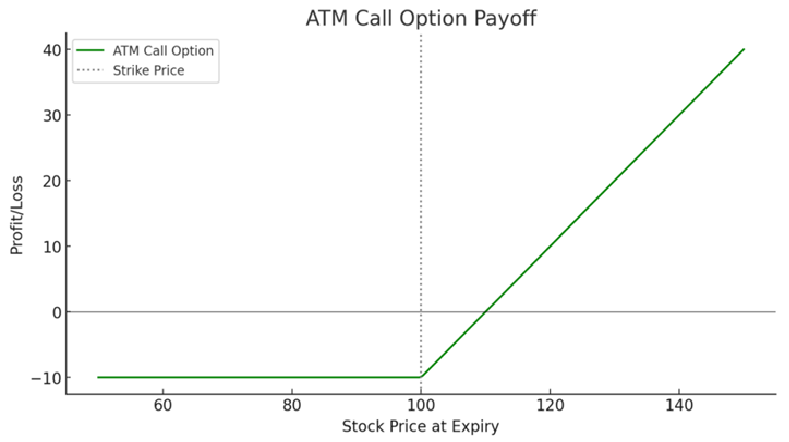
- The graph starts at zero (no intrinsic value).
- It slopes upward as the underlying price moves higher, but also has time decay working against it (the value decreases over time).
Let’s look at an example of an At-The-Money (ATM) Call Option to explain this graph.
Suppose:
- Strike Price: ₹100
- Premium Paid: ₹10
Scenario on Expiry:
- If the stock price is ₹90, the option expires worthless as it’s below the strike price. Your loss equals the premium paid (₹10).
- If the stock price is ₹100, the option is still worthless since the stock price equals the strike price. Loss = ₹10 (premium paid).
- If the stock price is ₹120, the option becomes profitable: ₹120 (stock price) – ₹100 (strike price) – ₹10 (premium paid) = ₹10 profit.
- If the stock price is ₹150, your profit increases further: ₹150 (stock price) – ₹100 (strike price) – ₹10 (premium paid) = ₹40 profit.
Time Decay (Theta Effect):
If the current stock price is near ₹100 (strike price) before expiry, the call option has time value. For example, even if the stock price is ₹100, the option might be worth ₹5 due to the potential for future movement. However, as the expiration date approaches, the time value erodes, causing the option’s value to decrease unless the stock price moves significantly higher. This is called time decay.
How It Matches the Graph:
- The graph starts at zero (no intrinsic value at the strike price of ₹100).
- It slopes upward as the stock price rises, showing increasing profit.
- Time decayworks against the option’s value, especially when the stock price is close to the strike price.
ITM Put Option:
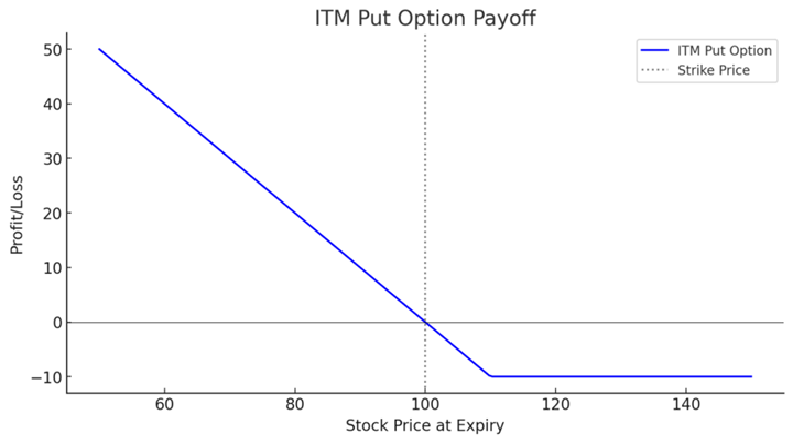
- The graph starts above zero, showing intrinsic value as the underlying price is lower than the strike price.
- The value increases with a falling underlying price.
Imagine you hold an ITM put option with a strike price of ₹100. This means you have the right to sell the underlying asset at ₹100, regardless of its market price. Now, consider the following scenarios:
- Stock price at expiry: ₹80You can sell the asset for ₹100 even though it’s only worth ₹80 in the market, making a profit of ₹20 per unit.
- Stock price at expiry: ₹60Selling at ₹100 while the market price is ₹60 results in a profit of ₹40 per unit. As the underlying price drops further, your profit continues to increase.
- Stock price at expiry: ₹120Here, the asset is worth more in the market than the strike price. Therefore, you wouldn’t exercise your option, resulting in a small loss—approximately ₹10 in this case.
This payoff structure illustrates how the graph starts above zero (representing intrinsic value) and increases as the underlying price falls below the strike price
OTM Put Option:
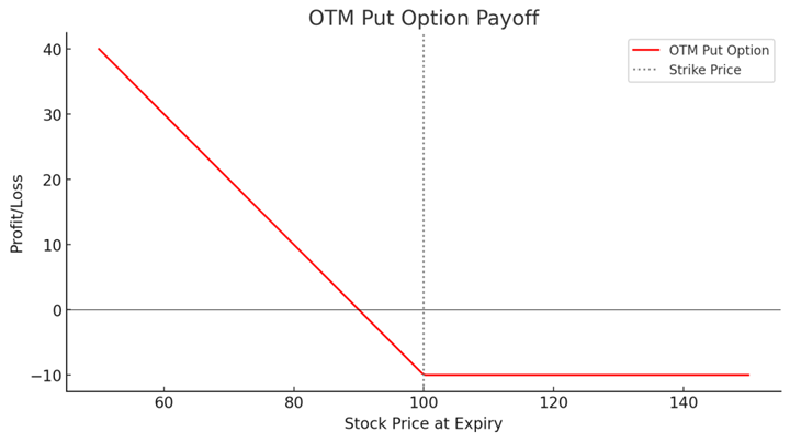
- The graph starts at zero and increases as the underlying price falls.
- The risk of loss increases as the underlying price doesn’t fall below the strike price.
₹100 (strike price) – ₹70 (stock price) – ₹10 (premium paid) = ₹20 profit per un
An OTM put option payoff graph represents the outcome when the underlying price stays above the strike price initially, and profits rise as the price falls below the strike price. Here’s an example:
- Strike Price:₹100
- Put Option Premium:₹10
Scenario 1: Stock Price at Expiry = ₹70 You have the right to sell the stock at ₹100, while it’s worth ₹70 in the market. Your profit:
Scenario 2: Stock Price at Expiry = ₹90
- ₹100 – ₹90 – ₹10 = ₹0. The premium paid matches the intrinsic value, resulting in no profit.
Scenario 3: Stock Price at Expiry = ₹110 Here, the stock is worth more in the market than your strike price. You don’t exercise the option. Your loss is capped at ₹10 (the premium paid).
This aligns with the graph—profit rises when prices fall below ₹100, and the loss (premium) stays fixed when prices stay above ₹100.
ATM Put Option:
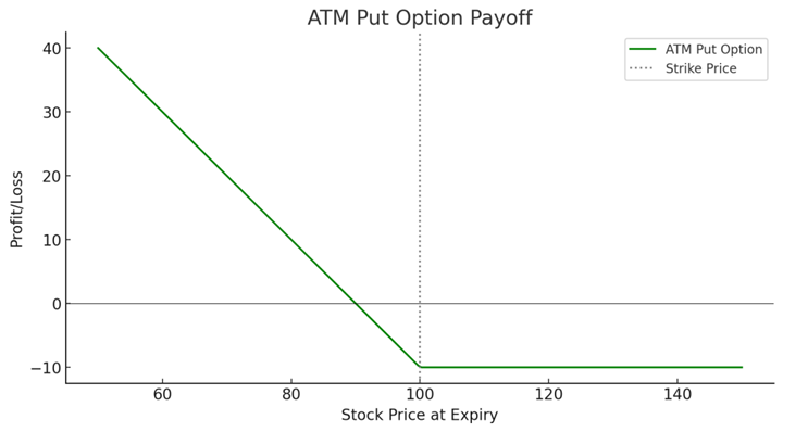
- The graph starts at zero (no intrinsic value).
- It increases as the underlying price moves lower, with similar time decay effects.
Example of ATM (At-the-Money) Put Option, where the strike price is ₹100 and the premium paid for the option is ₹10:
Examples:
- Stock price at expiry: ₹80You exercise the put option to sell at ₹100 while the stock is worth ₹80 in the market.
- Payoff calculation: ₹100 (strike price) – ₹80 (stock price) = ₹20 After deductng the premium: ₹20 – ₹10 = ₹10 profit.
- Stock price at expiry: ₹100Since the stock price is equal to the strike price, there’s no intrinsic value.
- Payoff calculation: ₹100 – ₹100 = ₹0 After deducting the premium: ₹0 – ₹10 = ₹10 loss.
Stock price at expiry: ₹120
The stock price is higher than the strike price, so the option is not exercised, resulting in a loss. Payoff calculation: ₹0 – ₹10 = ₹10 loss.
This aligns with the graph: the payoff starts at zero when the stock price equals the strike price (₹100). As the stock price falls below ₹100, the payoff rises, offsetting the premium paid. Losses, however, are capped at the premium when the stock price stays above the strike price.
Summary of Risk Profiles:
- ITM Options: Lower risk, as there is intrinsic value. Profit increases with favorable movement in the underlying.
- OTM Options: Higher risk, as they have no intrinsic value and are entirely dependent on the price moving significantly in the favorable direction.
- ATM Options: Moderate risk, as they are dependent on the underlying price moving significantly and are subject to time decay.
2.3 Option Seller Risk Profile – Short Calls and Puts
|
Option Type |
Max Profit |
Max Loss |
Ideal Market |
|
Buy Call |
Unlimited |
Premium |
Bullish |
|
Sell Call |
Premium |
Unlimited |
Bearish/Neutral |
|
Buy Put |
High (if price drops) |
Premium |
Bearish |
|
Sell Put |
Premium |
High (if price falls) |
Bullish/ Neutral |
1. Selling a Call Option (Short Call)
Maximum Profit: Limited to the premium received.
Maximum Loss: Unlimited (if the stock price rises significantly).
Break-even Point: Strike Price + Premium Received.
Risk Analysis
- The seller of a call option is obligated to sell the asset at the strike price if the buyer exercises the option.
- If the stock price stays belowthe strike price, the option expires worthless, and the seller keeps the premium as profit.
- If the stock price rises abovethe strike price, the seller must buy the stock at the market price and sell it at the strike price, leading to unlimited losses as the stock price can theoretically rise indefinitely.
- This strategy is very risky, especially if the stock price moves sharply upwards.
Example of Short Call Risk
- Strike Price: ₹100
- Premium Received: ₹5
- If the stock closes at ₹95, the option expires worthless, and the seller keeps the ₹5 premium.
- If the stock closes at ₹120, the seller has to sell at ₹100 but buy at ₹120, leading to a loss of ₹15 per share (₹20 loss – ₹5 premium).
- If the stock jumps to ₹200, the seller faces a massive loss of ₹95 per share.
Who Uses This Strategy?
- Traders who believe that the stock price won’t rise significantly.
- Investors who own the stock and write covered calls to generate extra income (covered call strategy).
2. Selling a Put Option (Short Put)
Maximum Profit: Limited to the premium received.
Maximum Loss: Significant but limited (if the stock price falls to zero).
Break-even Point: Strike Price – Premium Received.
Risk Analysis
- The seller of a put option is obligated to buythe asset at the strike price if the buyer exercises the option.
- If the stock price stays abovethe strike price, the option expires worthless, and the seller keeps the premium as profit.
- If the stock price drops significantly, the seller must buy the stock at the strike price, which can lead to substantial lossesif the stock collapses.
- The maximum loss occurs when the stock price falls to zero, meaning the seller must buy a worthless stock at the strike price.
Example of Short Put Risk
- Strike Price: ₹100
- Premium Received: ₹5
- If the stock closes at ₹105, the option expires worthless, and the seller keeps the ₹5 premium.
- If the stock closes at ₹80, the seller must buy at ₹100, leading to a loss of ₹15 per share (₹20 loss – ₹5 premium).
- If the stock drops to ₹20, the seller faces a loss of ₹75 per share.
- If the company goes bankrupt (₹0 stock price), the seller suffers a maximum loss of ₹95 per share.
Who Uses This Strategy?
- Traders who believe that the stock price won’t fall significantly.
- Investors who want to buy a stock at a lower price(cash-secured put strategy).
Key Takeaways
|
Option Type |
Maximum Profit |
Maximum Loss |
Ideal Market Condition |
|
Short Call |
Limited to premium |
Unlimited |
Bearish or Neutral |
|
Short Put |
Limited to premium |
Significant (Stock Price → 0) |
Bullish or Neutral |
2.4 Real-Life Example of Buying a Put Option for Hedging

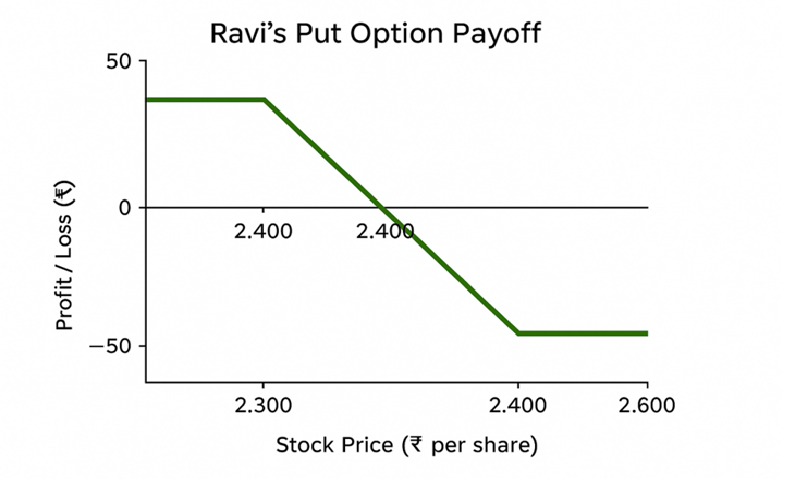
Imagine Ravi is an investor holding shares of Reliance Industries, currently trading at ₹2,500 per share. Ravi is concerned about a potential drop in the stock price due to market volatility. To protect his investment, he decided to buy a put option with a strike price of ₹2,400, expiring in one month. The premium for this option is ₹50 per share.
Scenario 1: Stock price falls below ₹2,400 If the stock price drops to ₹2,300 before the option expires, Ravi can exercise the put option and sell shares at ₹2,400 instead of the lower market price of ₹2,300. This minimizes his losses, as he effectively locked in a selling price of ₹2,400. After accounting for the ₹50 premium, his net selling price is ₹2,350, which is still better than ₹2,300.
Scenario 2: Stock price stays above ₹2,400 If the stock price remains above ₹2,400 (e.g., ₹2,600), Ravi wouldn’t exercise the put option, as he can sell shares at the higher market price. In this case, the put option expires worthless, and his only loss is the ₹50 premium he paid.
This example demonstrates how put options can act as a safety net for investors, helping them manage risks in a volatile market.
2.5 Put Options quotes and screens on a Trading platform
Put options quotes and screens are typically displayed on trading platforms through an options chain. This chain provides detailed information about various strike prices, expiration dates, and premiums for both call and put options.
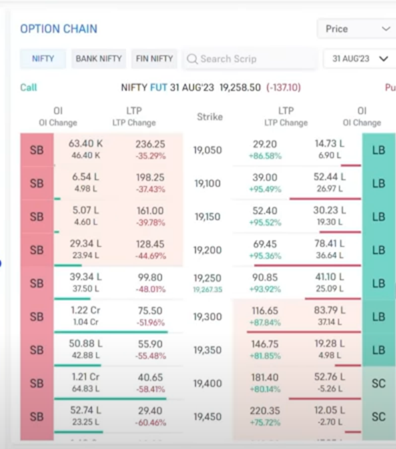
- Options Chain: The chain shows strike prices in the middle column, with bid and ask prices for calls and puts on either side. You can select specific strike prices to view detailed quotes.
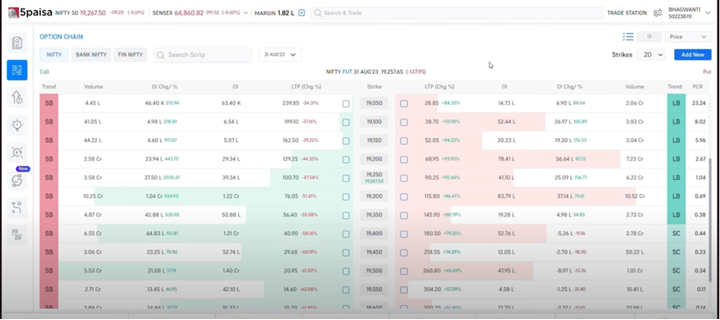
- Expiry Dates: Platforms allow you to toggle between different expiration dates, such as near-term or long-term options.
- Market Data: Real-time streaming quotes for the underlying asset and options are available if you subscribe to market data add-ons.
- Customizable Screens: Many platforms let you add or remove data columns, set up alerts, and group positions for better analysis
2.6 Option Chain Parameters for Put Options
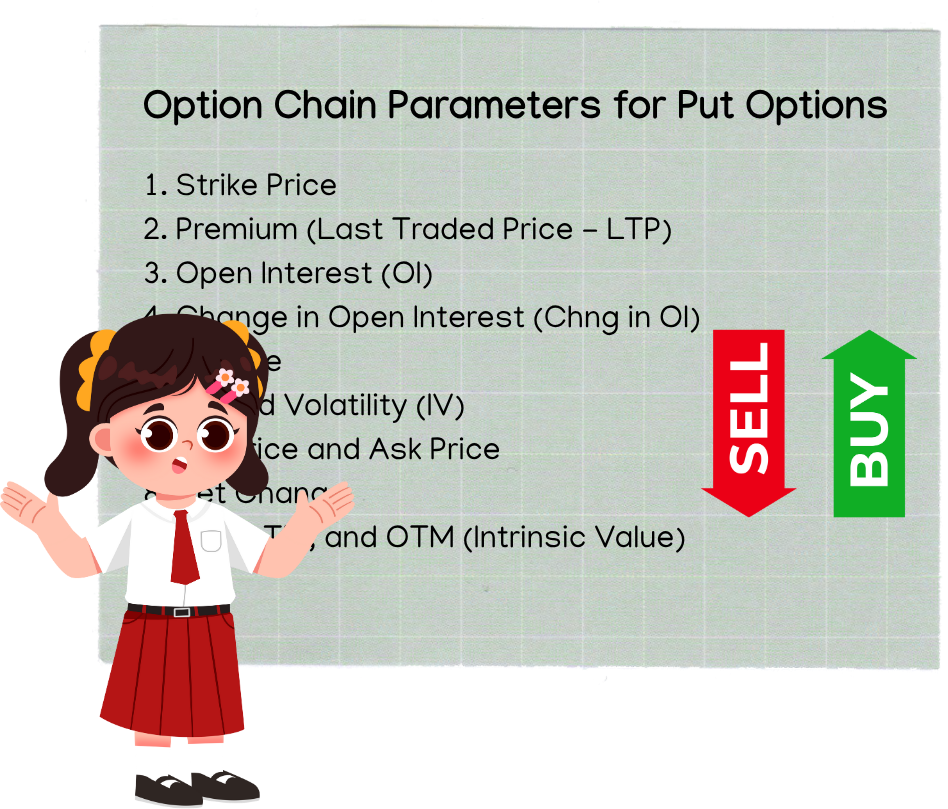
1. Strike Price
The strike price is the predetermined price at which the holder of a put option can sell the underlying asset. It forms the backbone of the option chain. For instance, in the option chain for Reliance Industries, strike prices might range from ₹2,300 to ₹2,700 in intervals (e.g., ₹2,300, ₹2,350, ₹2,400, and so on). Each strike price has unique associated data like premium, open interest, etc.
Example: If Reliance Industries is trading at ₹2,500, you might choose a strike price of ₹2,400 to hedge against a possible price drop.
2. Premium (Last Traded Price – LTP)
The premium is the cost of purchasing the put option, calculated per share. It reflects the current value of the option based on factors like market sentiment, time to expiration, and implied volatility.
Example: If the premium for a ₹2,400 strike price put option is ₹50, you would pay ₹50 per share to secure the right to sell at ₹2,400.
3. Open Interest (OI)
Open interest is the total number of contracts that are currently active for a particular strike price. It indicates market activity and liquidity for that option.
Example: If there are 5,000 contracts with the ₹2,400 strike price, this is the open interest. Higher open interest suggests significant market interest in this option.
4. Change in Open Interest
This shows the difference in open interest from the previous trading session. A positive change indicates more contracts have been opened, signaling increased market activity.
Example: If the open interest for the ₹2,400 strike price put option increases from 5,000 to 5,500, the change in open interest is +500 contracts.
5. Volume
Volume is the number of option contracts traded during the current trading session. Higher volume can indicate active trading and greater interest in that strike price.
Example: If 2,000 contracts of the ₹2,400 strike price put option were traded today, that’s the volume.
6. Implied Volatility (IV)
Implied volatility measures the market’s expectation of future price fluctuations for the underlying asset. Options with higher IVs tend to have higher premiums.
Example: If the IV of a ₹2,400 strike price put option is 30%, this indicates higher market uncertainty and results in a higher premium compared to an option with lower IV.
7. Bid Price and Ask Price
These represent the price range at which buyers and sellers are willing to transact. The bid price is the highest price a buyer is willing to pay, while the ask price is the lowest price a seller is willing to accept.
Example: For a ₹2,400 strike price put option:
- Bid price: ₹48
- Ask price: ₹52
This means buyers are ready to pay ₹48, while sellers want ₹52.
8. Net Change
This reflects the change in the option’s premium compared to the previous day’s closing price.
Example: If the premium for the ₹2,400 strike price put option increased from ₹50 to ₹55 today, the net change is +₹5.
9. ITM, ATM, and OTM (Intrinsic Value)
These terms classify options based on the relationship between the strike price and the current price of the underlying asset:
- In-the-Money (ITM): Strike price is below the current market price of the underlying asset. The put option has intrinsic value.
- At-the-Money (ATM): Strike price is equal to the current market price. The option has no intrinsic value, but time value remains.
- Out-of-the-Money (OTM): Strike price is above the current market price. The option has no intrinsic value.
Example: If Reliance Industries is trading at ₹2,500:
- ₹2,400 strike price: ITM
- ₹2,500 strike price: ATM
- ₹2,600 strike price: OTM
2.7 Using Put Options spreads to limit risk
Put option spreads are a strategic way to limit risk while managing costs in options trading. Here are some common types of put spreads and how they work:
1. Bear Put Spread
- How it works:This strategy involves buying a put option at a higher strike price and selling another put option at a lower strike price on the same underlying asset and expiration date.
- Purpose: It limits potential losses while reducing the cost of the trade.
- Example:Suppose a stock is trading at ₹1,000. You buy a put option with a strike price of ₹1,050 (premium ₹50) and sell a put option with a strike price of ₹950 (premium ₹20). Your net cost is ₹30, and your maximum profit is ₹70 if the stock price falls below ₹950.
2. Bull Put Spread
- How it works:This strategy involves selling a put option at a higher strike price and buying another put option at a lower strike price.
- Purpose: It generates income while limiting downside risk.
- Example: Suppose a stock is trading at ₹1,000. You sell a put option with a strike price of ₹950 (premium ₹20) and buy a put option with a strike price of ₹900 (premium ₹10). Your net credit is ₹10, and your maximum loss is ₹40 if the stock price falls below ₹900.
3. Protective Put Spread
- How it works:This strategy involves buying a put option to protect an existing stock position and selling another put option at a lower strike price to offset the cost.
- Purpose: It provides downside protection while reducing the cost of the hedge.
- Example:If you own shares of a stock trading at ₹1,000, you buy a put option with a strike price of ₹950 (premium ₹50) and sell a put option with a strike price of ₹900 (premium ₹20). Your net cost is ₹30, and you’re protected against losses below ₹950.
2.1 What Are ITM, ATM, and OTM Options?
In the Money (ITM):
- Call Option:A call option is “in the money” when the strike price is below the current market price of the underlying asset. This means exercising the option would allow the buyer to purchase the asset at a lower price than its current market value.
- Put Option:A put option is “in the money” when the strike price is above the current market price of the underlying asset. This means exercising the option would allow the buyer to sell the asset at a higher price than its current market value.
At the Money (ATM):
An option is considered “at the money” when the strike price is equal to or very close to the current market price of the underlying asset. In this case, exercising the option results in no intrinsic profit.
Out of the Money (OTM):
- Call Option:A call option is “out of the money” when the strike price is above the current market price of the underlying asset. Exercising it would mean buying the asset at a price higher than its market value, which isn’t profitable.
- Put Option:A put option is “out of the money” when the strike price is below the current market price of the underlying asset. Exercising it would mean selling the asset at a lower price than its market value, which also isn’t profitable.
Example as per ITM, ATM and OTM with respect to Power Sector
In the Money (ITM):
Imagine a call option for electricity priced at ₹5 per unit, while the current market price is ₹6 per unit. This option is “in the money” because exercising it allows the buyer to purchase electricity at ₹5, which is cheaper than the market price.
Similarly, a put option priced at ₹7 per unit is “in the money” if the current market price is ₹6 per unit. Exercising this option lets the seller sell electricity at ₹7, higher than the market price.
At the Money (ATM):
If the strike price of the option is ₹6 per unit and the current market price is also ₹6 per unit, the option is “at the money.” Exercising it would result in no intrinsic profit.
Out of the Money (OTM):
A call option priced at ₹7 per unit is “out of the money” if the current market price is ₹6 per unit. Exercising it would mean buying electricity at ₹7, which is more expensive than the market price. A put option priced at ₹5 per unit is “out of the money” if the current market price is ₹6 per unit. Exercising it would mean selling electricity at ₹5, which is lower than the market price.
2.2 ITM vs ATM vs OTM Options – Risk Graphs Explained
ITM Call Option:
- The graph will start above zero on the left (showing intrinsic value).
- It rises steeply with increasing underlying price.
- The risk is capped by the premium paid (as the price can never go lower than zero).
Imagine you purchase an ITM (In-The-Money) call option with:
- Strike Price: ₹100
- Premium Paid: ₹10
Here’s how it plays out at different stock prices at expiry:
- If the stock price is ₹90, you incur a loss of ₹10 (you can’t exercise the option, so you only lose the premium).
- If the stock price is ₹110, you break even. Your profit from the option is ₹10 (₹110 – ₹100), which offsets the ₹10 premium paid.
- If the stock price is ₹150, you make a profit of ₹40. Here’s how: ₹150 (stock price) – ₹100 (strike price) – ₹10 (premium paid) = ₹40.
This aligns with the graph’s key characteristics:
- The graph starts below zero to reflect the premium paid.
- It flattens until the stock price equals the strike price (no intrinsic value below this point).
- After crossing the strike price, it rises steeply, showing increasing profits as the stock price climbs.
OTM Call Option:
- The graph starts at zero, and only increases as the underlying price exceeds the strike price.
- The risk of loss increases as the price doesn’t move in favor of the option (as it can lose all the premium paid).
Suppose you buy an OTM call option with:
- Strike Price: ₹150
- Premium Paid: ₹10
Here’s what happens at different stock prices on expiry:
- If the stock price is ₹140, the option expires worthless because the stock price is below the strike price. You lose the entire premium of ₹10.
- If the stock price is ₹150, you still incur a loss of ₹10 (your premium) because the option doesn’t yield any intrinsic value (the strike price equals the stock price).
- If the stock price is ₹170, you make a profit of ₹10: ₹170 (stock price) – ₹150 (strike price) – ₹10 (premium paid) = ₹10.
- If the stock price is ₹200, your profit jumps to ₹40: ₹200 (stock price) – ₹150 (strike price) – ₹10 (premium paid) = ₹40.
How It Relates to the Graph:
- The graph starts at zero (at strike price ₹150) and rises steeply as the stock price exceeds the strike price, showing growing profits.
- The risk is limited to the premium paid (₹10), as the graph never dips below zero.
ATM Call Option:
- The graph starts at zero (no intrinsic value).
- It slopes upward as the underlying price moves higher, but also has time decay working against it (the value decreases over time).
Let’s look at an example of an At-The-Money (ATM) Call Option to explain this graph.
Suppose:
- Strike Price: ₹100
- Premium Paid: ₹10
Scenario on Expiry:
- If the stock price is ₹90, the option expires worthless as it’s below the strike price. Your loss equals the premium paid (₹10).
- If the stock price is ₹100, the option is still worthless since the stock price equals the strike price. Loss = ₹10 (premium paid).
- If the stock price is ₹120, the option becomes profitable: ₹120 (stock price) – ₹100 (strike price) – ₹10 (premium paid) = ₹10 profit.
- If the stock price is ₹150, your profit increases further: ₹150 (stock price) – ₹100 (strike price) – ₹10 (premium paid) = ₹40 profit.
Time Decay (Theta Effect):
If the current stock price is near ₹100 (strike price) before expiry, the call option has time value. For example, even if the stock price is ₹100, the option might be worth ₹5 due to the potential for future movement. However, as the expiration date approaches, the time value erodes, causing the option’s value to decrease unless the stock price moves significantly higher. This is called time decay.
How It Matches the Graph:
- The graph starts at zero (no intrinsic value at the strike price of ₹100).
- It slopes upward as the stock price rises, showing increasing profit.
- Time decayworks against the option’s value, especially when the stock price is close to the strike price.
ITM Put Option:
- The graph starts above zero, showing intrinsic value as the underlying price is lower than the strike price.
- The value increases with a falling underlying price.
Imagine you hold an ITM put option with a strike price of ₹100. This means you have the right to sell the underlying asset at ₹100, regardless of its market price. Now, consider the following scenarios:
- Stock price at expiry: ₹80You can sell the asset for ₹100 even though it’s only worth ₹80 in the market, making a profit of ₹20 per unit.
- Stock price at expiry: ₹60Selling at ₹100 while the market price is ₹60 results in a profit of ₹40 per unit. As the underlying price drops further, your profit continues to increase.
- Stock price at expiry: ₹120Here, the asset is worth more in the market than the strike price. Therefore, you wouldn’t exercise your option, resulting in a small loss—approximately ₹10 in this case.
This payoff structure illustrates how the graph starts above zero (representing intrinsic value) and increases as the underlying price falls below the strike price
OTM Put Option:
- The graph starts at zero and increases as the underlying price falls.
- The risk of loss increases as the underlying price doesn’t fall below the strike price.
₹100 (strike price) – ₹70 (stock price) – ₹10 (premium paid) = ₹20 profit per un
An OTM put option payoff graph represents the outcome when the underlying price stays above the strike price initially, and profits rise as the price falls below the strike price. Here’s an example:
- Strike Price:₹100
- Put Option Premium:₹10
Scenario 1: Stock Price at Expiry = ₹70 You have the right to sell the stock at ₹100, while it’s worth ₹70 in the market. Your profit:
Scenario 2: Stock Price at Expiry = ₹90
- ₹100 – ₹90 – ₹10 = ₹0. The premium paid matches the intrinsic value, resulting in no profit.
Scenario 3: Stock Price at Expiry = ₹110 Here, the stock is worth more in the market than your strike price. You don’t exercise the option. Your loss is capped at ₹10 (the premium paid).
This aligns with the graph—profit rises when prices fall below ₹100, and the loss (premium) stays fixed when prices stay above ₹100.
ATM Put Option:
- The graph starts at zero (no intrinsic value).
- It increases as the underlying price moves lower, with similar time decay effects.
Example of ATM (At-the-Money) Put Option, where the strike price is ₹100 and the premium paid for the option is ₹10:
Examples:
- Stock price at expiry: ₹80You exercise the put option to sell at ₹100 while the stock is worth ₹80 in the market.
- Payoff calculation: ₹100 (strike price) – ₹80 (stock price) = ₹20 After deductng the premium: ₹20 – ₹10 = ₹10 profit.
- Stock price at expiry: ₹100Since the stock price is equal to the strike price, there’s no intrinsic value.
- Payoff calculation: ₹100 – ₹100 = ₹0 After deducting the premium: ₹0 – ₹10 = ₹10 loss.
Stock price at expiry: ₹120
The stock price is higher than the strike price, so the option is not exercised, resulting in a loss. Payoff calculation: ₹0 – ₹10 = ₹10 loss.
This aligns with the graph: the payoff starts at zero when the stock price equals the strike price (₹100). As the stock price falls below ₹100, the payoff rises, offsetting the premium paid. Losses, however, are capped at the premium when the stock price stays above the strike price.
Summary of Risk Profiles:
- ITM Options: Lower risk, as there is intrinsic value. Profit increases with favorable movement in the underlying.
- OTM Options: Higher risk, as they have no intrinsic value and are entirely dependent on the price moving significantly in the favorable direction.
- ATM Options: Moderate risk, as they are dependent on the underlying price moving significantly and are subject to time decay.
2.3 Option Seller Risk Profile – Short Calls and Puts
|
Option Type |
Max Profit |
Max Loss |
Ideal Market |
|
Buy Call |
Unlimited |
Premium |
Bullish |
|
Sell Call |
Premium |
Unlimited |
Bearish/Neutral |
|
Buy Put |
High (if price drops) |
Premium |
Bearish |
|
Sell Put |
Premium |
High (if price falls) |
Bullish/ Neutral |
1. Selling a Call Option (Short Call)
Maximum Profit: Limited to the premium received.
Maximum Loss: Unlimited (if the stock price rises significantly).
Break-even Point: Strike Price + Premium Received.
Risk Analysis
- The seller of a call option is obligated to sell the asset at the strike price if the buyer exercises the option.
- If the stock price stays belowthe strike price, the option expires worthless, and the seller keeps the premium as profit.
- If the stock price rises abovethe strike price, the seller must buy the stock at the market price and sell it at the strike price, leading to unlimited losses as the stock price can theoretically rise indefinitely.
- This strategy is very risky, especially if the stock price moves sharply upwards.
Example of Short Call Risk
- Strike Price: ₹100
- Premium Received: ₹5
- If the stock closes at ₹95, the option expires worthless, and the seller keeps the ₹5 premium.
- If the stock closes at ₹120, the seller has to sell at ₹100 but buy at ₹120, leading to a loss of ₹15 per share (₹20 loss – ₹5 premium).
- If the stock jumps to ₹200, the seller faces a massive loss of ₹95 per share.
Who Uses This Strategy?
- Traders who believe that the stock price won’t rise significantly.
- Investors who own the stock and write covered calls to generate extra income (covered call strategy).
2. Selling a Put Option (Short Put)
Maximum Profit: Limited to the premium received.
Maximum Loss: Significant but limited (if the stock price falls to zero).
Break-even Point: Strike Price – Premium Received.
Risk Analysis
- The seller of a put option is obligated to buythe asset at the strike price if the buyer exercises the option.
- If the stock price stays abovethe strike price, the option expires worthless, and the seller keeps the premium as profit.
- If the stock price drops significantly, the seller must buy the stock at the strike price, which can lead to substantial lossesif the stock collapses.
- The maximum loss occurs when the stock price falls to zero, meaning the seller must buy a worthless stock at the strike price.
Example of Short Put Risk
- Strike Price: ₹100
- Premium Received: ₹5
- If the stock closes at ₹105, the option expires worthless, and the seller keeps the ₹5 premium.
- If the stock closes at ₹80, the seller must buy at ₹100, leading to a loss of ₹15 per share (₹20 loss – ₹5 premium).
- If the stock drops to ₹20, the seller faces a loss of ₹75 per share.
- If the company goes bankrupt (₹0 stock price), the seller suffers a maximum loss of ₹95 per share.
Who Uses This Strategy?
- Traders who believe that the stock price won’t fall significantly.
- Investors who want to buy a stock at a lower price(cash-secured put strategy).
Key Takeaways
|
Option Type |
Maximum Profit |
Maximum Loss |
Ideal Market Condition |
|
Short Call |
Limited to premium |
Unlimited |
Bearish or Neutral |
|
Short Put |
Limited to premium |
Significant (Stock Price → 0) |
Bullish or Neutral |
2.4 Real-Life Example of Buying a Put Option for Hedging
Imagine Ravi is an investor holding shares of Reliance Industries, currently trading at ₹2,500 per share. Ravi is concerned about a potential drop in the stock price due to market volatility. To protect his investment, he decided to buy a put option with a strike price of ₹2,400, expiring in one month. The premium for this option is ₹50 per share.
Scenario 1: Stock price falls below ₹2,400 If the stock price drops to ₹2,300 before the option expires, Ravi can exercise the put option and sell shares at ₹2,400 instead of the lower market price of ₹2,300. This minimizes his losses, as he effectively locked in a selling price of ₹2,400. After accounting for the ₹50 premium, his net selling price is ₹2,350, which is still better than ₹2,300.
Scenario 2: Stock price stays above ₹2,400 If the stock price remains above ₹2,400 (e.g., ₹2,600), Ravi wouldn’t exercise the put option, as he can sell shares at the higher market price. In this case, the put option expires worthless, and his only loss is the ₹50 premium he paid.
This example demonstrates how put options can act as a safety net for investors, helping them manage risks in a volatile market.
2.5 Put Options quotes and screens on a Trading platform
Put options quotes and screens are typically displayed on trading platforms through an options chain. This chain provides detailed information about various strike prices, expiration dates, and premiums for both call and put options.
- Options Chain: The chain shows strike prices in the middle column, with bid and ask prices for calls and puts on either side. You can select specific strike prices to view detailed quotes.
- Expiry Dates: Platforms allow you to toggle between different expiration dates, such as near-term or long-term options.
- Market Data: Real-time streaming quotes for the underlying asset and options are available if you subscribe to market data add-ons.
- Customizable Screens: Many platforms let you add or remove data columns, set up alerts, and group positions for better analysis
2.6 Option Chain Parameters for Put Options
1. Strike Price
The strike price is the predetermined price at which the holder of a put option can sell the underlying asset. It forms the backbone of the option chain. For instance, in the option chain for Reliance Industries, strike prices might range from ₹2,300 to ₹2,700 in intervals (e.g., ₹2,300, ₹2,350, ₹2,400, and so on). Each strike price has unique associated data like premium, open interest, etc.
Example: If Reliance Industries is trading at ₹2,500, you might choose a strike price of ₹2,400 to hedge against a possible price drop.
2. Premium (Last Traded Price – LTP)
The premium is the cost of purchasing the put option, calculated per share. It reflects the current value of the option based on factors like market sentiment, time to expiration, and implied volatility.
Example: If the premium for a ₹2,400 strike price put option is ₹50, you would pay ₹50 per share to secure the right to sell at ₹2,400.
3. Open Interest (OI)
Open interest is the total number of contracts that are currently active for a particular strike price. It indicates market activity and liquidity for that option.
Example: If there are 5,000 contracts with the ₹2,400 strike price, this is the open interest. Higher open interest suggests significant market interest in this option.
4. Change in Open Interest
This shows the difference in open interest from the previous trading session. A positive change indicates more contracts have been opened, signaling increased market activity.
Example: If the open interest for the ₹2,400 strike price put option increases from 5,000 to 5,500, the change in open interest is +500 contracts.
5. Volume
Volume is the number of option contracts traded during the current trading session. Higher volume can indicate active trading and greater interest in that strike price.
Example: If 2,000 contracts of the ₹2,400 strike price put option were traded today, that’s the volume.
6. Implied Volatility (IV)
Implied volatility measures the market’s expectation of future price fluctuations for the underlying asset. Options with higher IVs tend to have higher premiums.
Example: If the IV of a ₹2,400 strike price put option is 30%, this indicates higher market uncertainty and results in a higher premium compared to an option with lower IV.
7. Bid Price and Ask Price
These represent the price range at which buyers and sellers are willing to transact. The bid price is the highest price a buyer is willing to pay, while the ask price is the lowest price a seller is willing to accept.
Example: For a ₹2,400 strike price put option:
- Bid price: ₹48
- Ask price: ₹52
This means buyers are ready to pay ₹48, while sellers want ₹52.
8. Net Change
This reflects the change in the option’s premium compared to the previous day’s closing price.
Example: If the premium for the ₹2,400 strike price put option increased from ₹50 to ₹55 today, the net change is +₹5.
9. ITM, ATM, and OTM (Intrinsic Value)
These terms classify options based on the relationship between the strike price and the current price of the underlying asset:
- In-the-Money (ITM): Strike price is below the current market price of the underlying asset. The put option has intrinsic value.
- At-the-Money (ATM): Strike price is equal to the current market price. The option has no intrinsic value, but time value remains.
- Out-of-the-Money (OTM): Strike price is above the current market price. The option has no intrinsic value.
Example: If Reliance Industries is trading at ₹2,500:
- ₹2,400 strike price: ITM
- ₹2,500 strike price: ATM
- ₹2,600 strike price: OTM
2.7 Using Put Options spreads to limit risk
Put option spreads are a strategic way to limit risk while managing costs in options trading. Here are some common types of put spreads and how they work:
1. Bear Put Spread
- How it works:This strategy involves buying a put option at a higher strike price and selling another put option at a lower strike price on the same underlying asset and expiration date.
- Purpose: It limits potential losses while reducing the cost of the trade.
- Example:Suppose a stock is trading at ₹1,000. You buy a put option with a strike price of ₹1,050 (premium ₹50) and sell a put option with a strike price of ₹950 (premium ₹20). Your net cost is ₹30, and your maximum profit is ₹70 if the stock price falls below ₹950.
2. Bull Put Spread
- How it works:This strategy involves selling a put option at a higher strike price and buying another put option at a lower strike price.
- Purpose: It generates income while limiting downside risk.
- Example: Suppose a stock is trading at ₹1,000. You sell a put option with a strike price of ₹950 (premium ₹20) and buy a put option with a strike price of ₹900 (premium ₹10). Your net credit is ₹10, and your maximum loss is ₹40 if the stock price falls below ₹900.
3. Protective Put Spread
- How it works:This strategy involves buying a put option to protect an existing stock position and selling another put option at a lower strike price to offset the cost.
- Purpose: It provides downside protection while reducing the cost of the hedge.
- Example:If you own shares of a stock trading at ₹1,000, you buy a put option with a strike price of ₹950 (premium ₹50) and sell a put option with a strike price of ₹900 (premium ₹20). Your net cost is ₹30, and you’re protected against losses below ₹950.
2.1 What Are ITM, ATM, and OTM Options?
In the Money (ITM):
At the Money (ATM):An option is considered “at the money” when the strike price is equal to or very close to the current market price of the underlying asset. In this case, exercising the option results in no intrinsic profit. Out of the Money (OTM):
Example as per ITM, ATM and OTM with respect to Power SectorIn the Money (ITM):Imagine a call option for electricity priced at ₹5 per unit, while the current market price is ₹6 per unit. This option is “in the money” because exercising it allows the buyer to purchase electricity at ₹5, which is cheaper than the market price. Similarly, a put option priced at ₹7 per unit is “in the money” if the current market price is ₹6 per unit. Exercising this option lets the seller sell electricity at ₹7, higher than the market price. At the Money (ATM):If the strike price of the option is ₹6 per unit and the current market price is also ₹6 per unit, the option is “at the money.” Exercising it would result in no intrinsic profit. Out of the Money (OTM):A call option priced at ₹7 per unit is “out of the money” if the current market price is ₹6 per unit. Exercising it would mean buying electricity at ₹7, which is more expensive than the market price. A put option priced at ₹5 per unit is “out of the money” if the current market price is ₹6 per unit. Exercising it would mean selling electricity at ₹5, which is lower than the market price. 2.2 ITM vs ATM vs OTM Options – Risk Graphs Explained
ITM Call Option:
Imagine you purchase an ITM (In-The-Money) call option with:
Here’s how it plays out at different stock prices at expiry:
This aligns with the graph’s key characteristics:
OTM Call Option:
Suppose you buy an OTM call option with:
Here’s what happens at different stock prices on expiry:
How It Relates to the Graph:
ATM Call Option:
Let’s look at an example of an At-The-Money (ATM) Call Option to explain this graph. Suppose:
Scenario on Expiry:
Time Decay (Theta Effect): If the current stock price is near ₹100 (strike price) before expiry, the call option has time value. For example, even if the stock price is ₹100, the option might be worth ₹5 due to the potential for future movement. However, as the expiration date approaches, the time value erodes, causing the option’s value to decrease unless the stock price moves significantly higher. This is called time decay. How It Matches the Graph:
ITM Put Option:
Imagine you hold an ITM put option with a strike price of ₹100. This means you have the right to sell the underlying asset at ₹100, regardless of its market price. Now, consider the following scenarios:
This payoff structure illustrates how the graph starts above zero (representing intrinsic value) and increases as the underlying price falls below the strike price OTM Put Option:
₹100 (strike price) – ₹70 (stock price) – ₹10 (premium paid) = ₹20 profit per un An OTM put option payoff graph represents the outcome when the underlying price stays above the strike price initially, and profits rise as the price falls below the strike price. Here’s an example:
Scenario 1: Stock Price at Expiry = ₹70 You have the right to sell the stock at ₹100, while it’s worth ₹70 in the market. Your profit: Scenario 2: Stock Price at Expiry = ₹90
Scenario 3: Stock Price at Expiry = ₹110 Here, the stock is worth more in the market than your strike price. You don’t exercise the option. Your loss is capped at ₹10 (the premium paid). This aligns with the graph—profit rises when prices fall below ₹100, and the loss (premium) stays fixed when prices stay above ₹100. ATM Put Option:
Example of ATM (At-the-Money) Put Option, where the strike price is ₹100 and the premium paid for the option is ₹10: Examples:
Stock price at expiry: ₹120 The stock price is higher than the strike price, so the option is not exercised, resulting in a loss. Payoff calculation: ₹0 – ₹10 = ₹10 loss. This aligns with the graph: the payoff starts at zero when the stock price equals the strike price (₹100). As the stock price falls below ₹100, the payoff rises, offsetting the premium paid. Losses, however, are capped at the premium when the stock price stays above the strike price. Summary of Risk Profiles:
2.3 Option Seller Risk Profile – Short Calls and Puts
1. Selling a Call Option (Short Call)Maximum Profit: Limited to the premium received. Risk Analysis
Example of Short Call Risk
Who Uses This Strategy?
2. Selling a Put Option (Short Put)Maximum Profit: Limited to the premium received. Maximum Loss: Significant but limited (if the stock price falls to zero). Risk Analysis
Example of Short Put Risk
Who Uses This Strategy?
Key Takeaways
2.4 Real-Life Example of Buying a Put Option for Hedging
|