1.1.What is FnO 360 all about??

FnO 360 is a specialized trading platform designed by 5paisa for derivatives trading, including futures and options (F&O)
Key Features
- Advanced Analysis Tools: FnO 360 provides real-time market data and multiple tools to help traders analyze the market effectively. This includes open interest analysis, powerful screeners, and strategy charts.
- Elegant Orderbook and Position book: The platform offers quick access to orderbooks and position books, ensuring fast order confirmations and trade execution.
- Comprehensive Market Data: Users can view charts powered by Trading View and ChartIQ, providing real-time price plots and detailed market data.
- Advanced Option Chain Functionality: FnO 360 offers different viewing modes for the option chain, including Price, Open Interest (OI), Straddle, and Greeks.
- Convenient Order Placement: The platform includes features like quick rollovers, reverse conversions, and bulk order placement for high-volume trades.
- One-Click Strategies: Users can place advanced complex strategies with just one click, gaining visibility into maximum profit, loss, and other critical data points.
- Automated Strategies: FnO 360 allows users to turn their derivative strategies into automated strategies with defined entry and exit parameters.
Benefits
- Informed Trading Decisions: With real-time data and advanced tools, traders can make more informed decisions.
- Efficient Trade Execution: The platform ensures lightning-fast trading and easy trade execution.
- Customization: Users can customize their watchlists and access a range of features tailored to derivatives trading
Who can access FnO360 ?
FnO360 can be accessed by existing customers of 5Paisa who have a Demat account by following two easy steps:
- Log in to your 5paisa account with the help of relevant credentials
- Click on the FnO360 option located in the top right corner
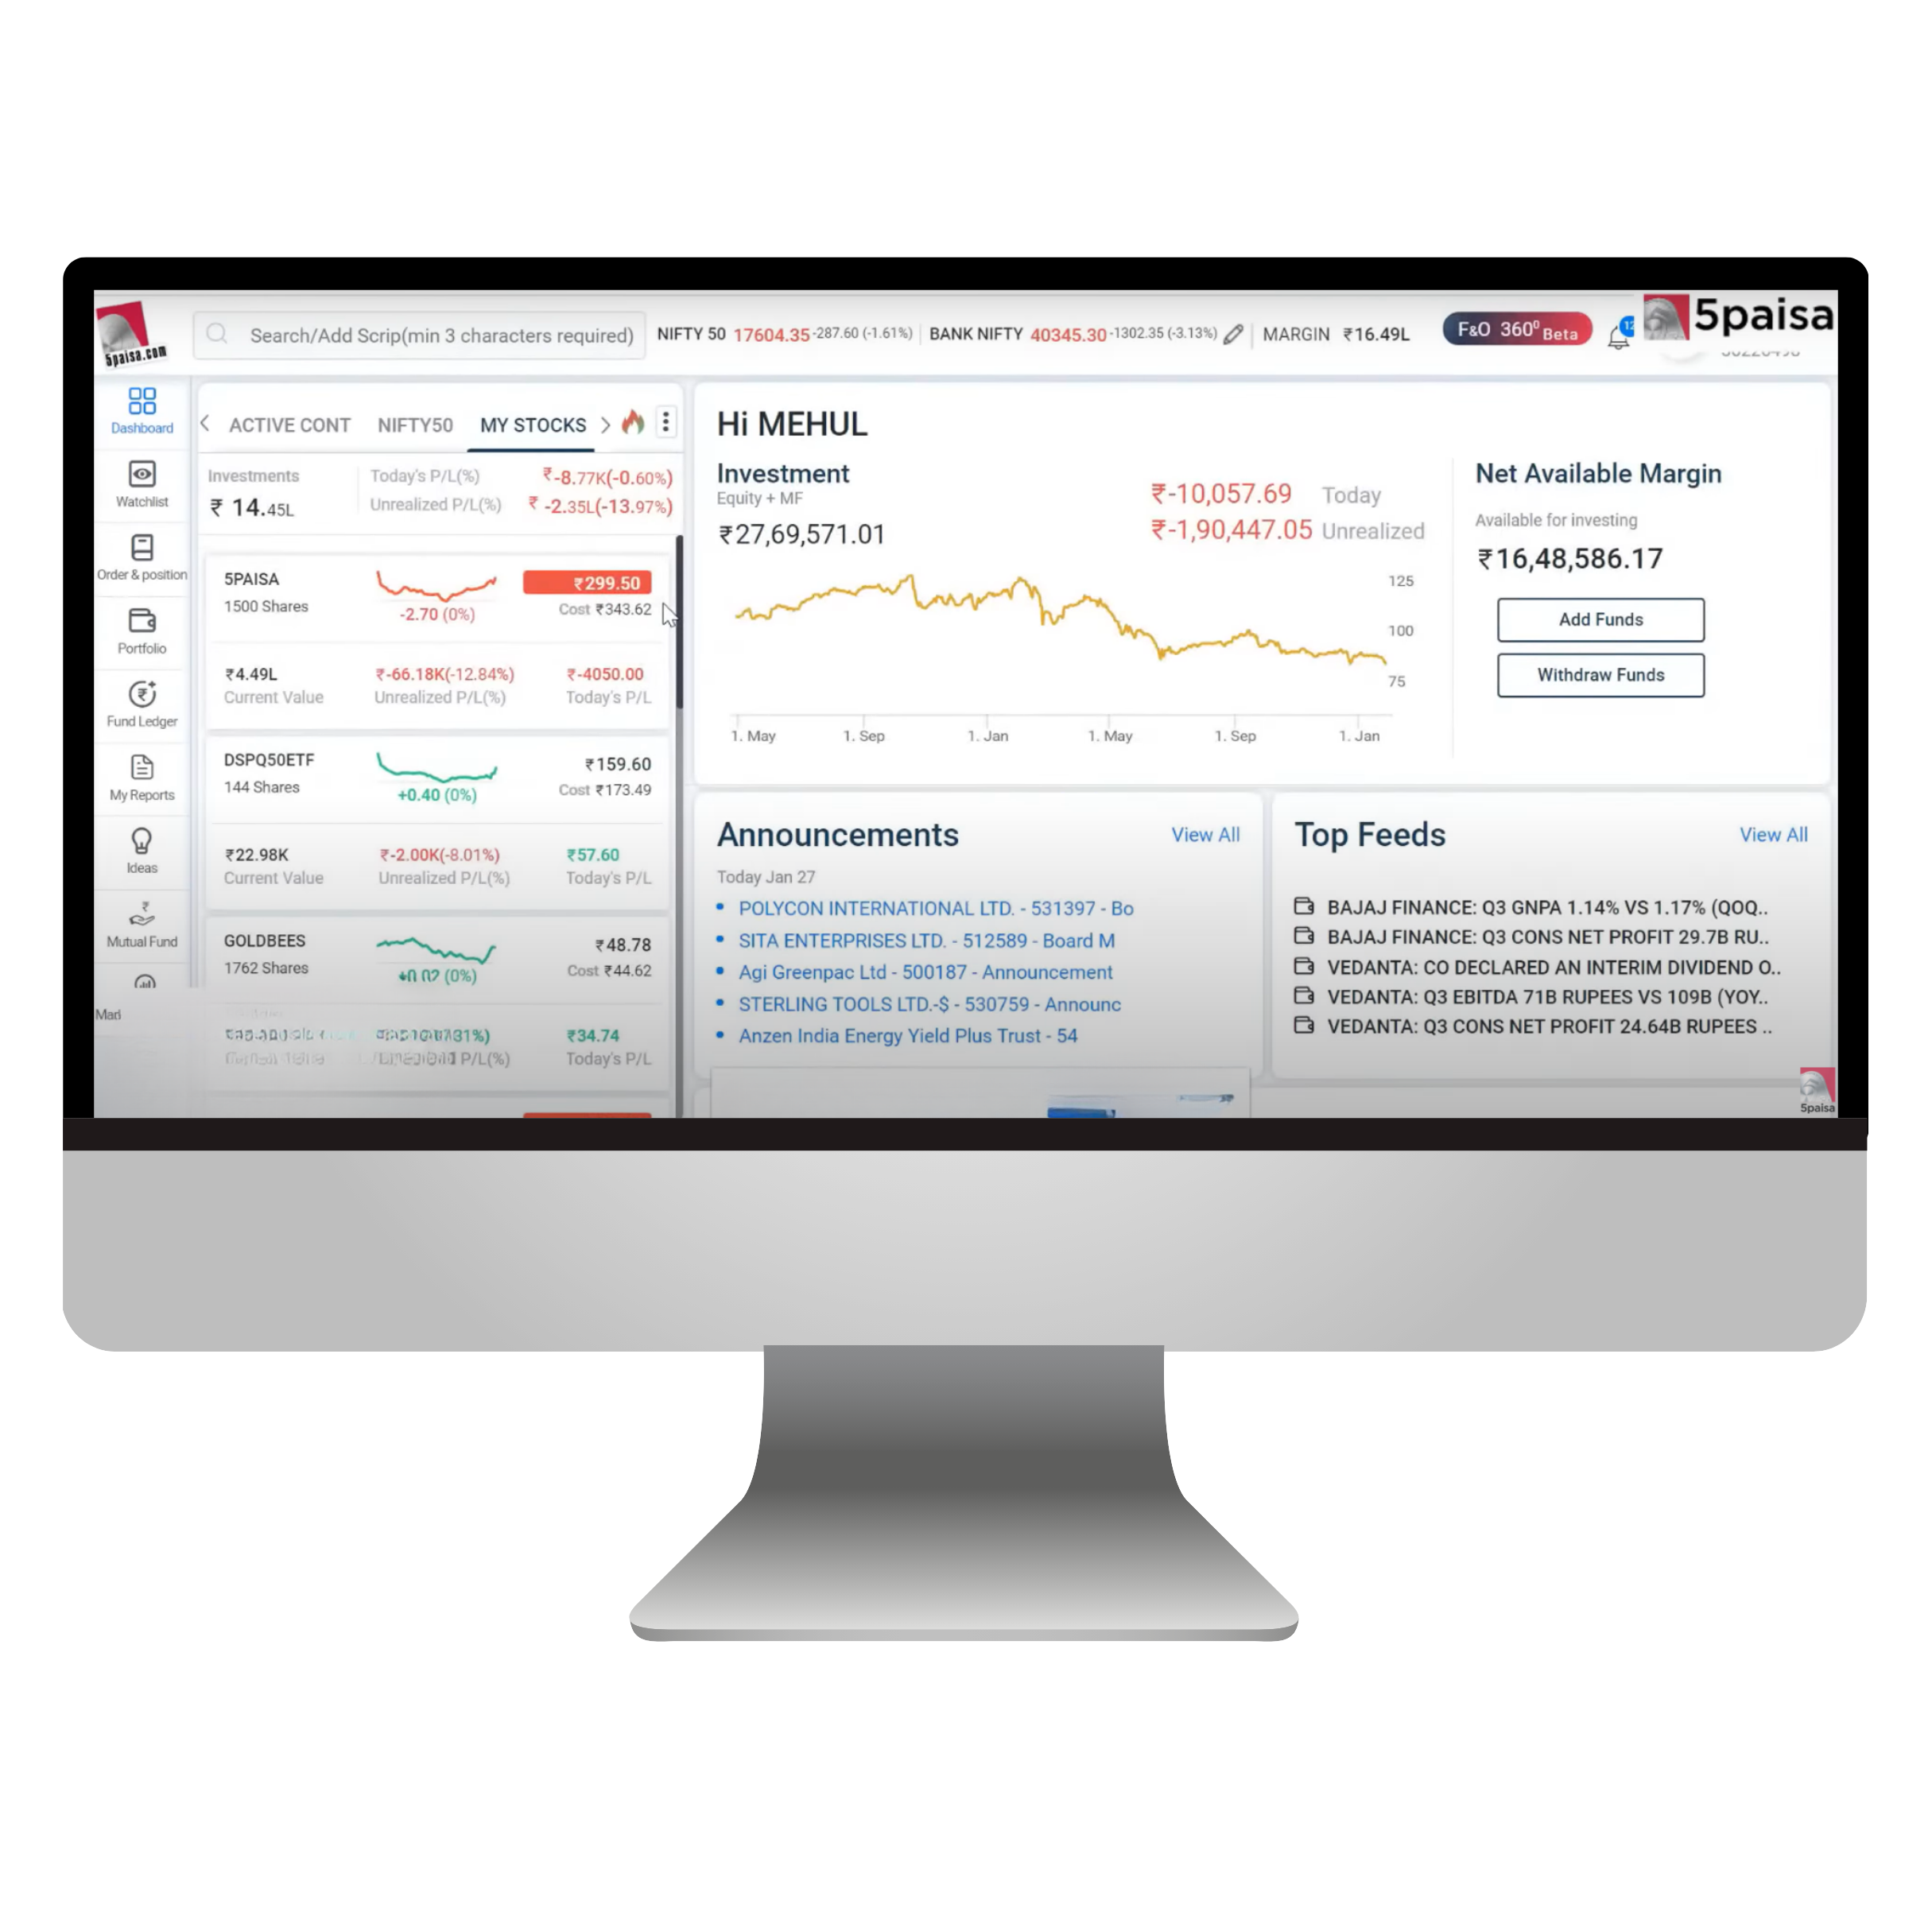
How to access FnO360?
It is very easy to access the FnO360, let me take you through it step by step-
- Login to the 5paisa web Trading platform
- You’ll see the “FnO360” button on the top right side of the screen
- Click on that button
- By clicking, you’ll be directed to a new window that allows you to navigate easily on the FnO360 domain, designed specifically for the derivative traders.

To analyze the market on FnO360 within the 5Paisa web portal, you can take advantage of various integrated tools that offer extensive coverage and up-to-date information on the derivatives market. Here’s a thorough overview:
Option Chain: Examine all existing options contracts for a particular security, covering strike prices, premiums, open interest, and additional details.
Option chain is also known as Mini Option chain. It has three sections
- Nifty
- Bank Nifty
- Finnifty

The Price section has three more options in the drop down
- Open Interest
- Straddle
- Greeks

- Open Interest Analysis:
- OI Evaluation: Analyze open interest information to gain insights into market trends.
- Multiple Strike OI: Examine open interest at various strike prices.
- Aggregate OI: Obtain a unified perspective of open interest data.
- Max Pain: Determine the level at which option writers face the greatest loss.
- FnO Stats:
- FnO Activity: Monitor price gainers/losers, open interest gainers/losers, long/short buildup, long unwinding, and short covering.
- FnO Screener: Apply filters to pinpoint specific trading opportunities based on different parameters.
- Heatmap: A graphical depiction of market movements and trends.
- MWPL BanList: Keep an eye on securities that have surpassed the market-wide position limit.
- Futures Intraday Buildup: Provide insights into intraday activities for futures.
- Index Contributors: Evaluate stock contributions to index performance.
- Volatility vs Indices: Assess volatility data in relation to index performance.
- F&O Momentum: Visual representation of live market momentum, showing the number of stocks trading positively or negatively and in what range.
- FII-DII Activity
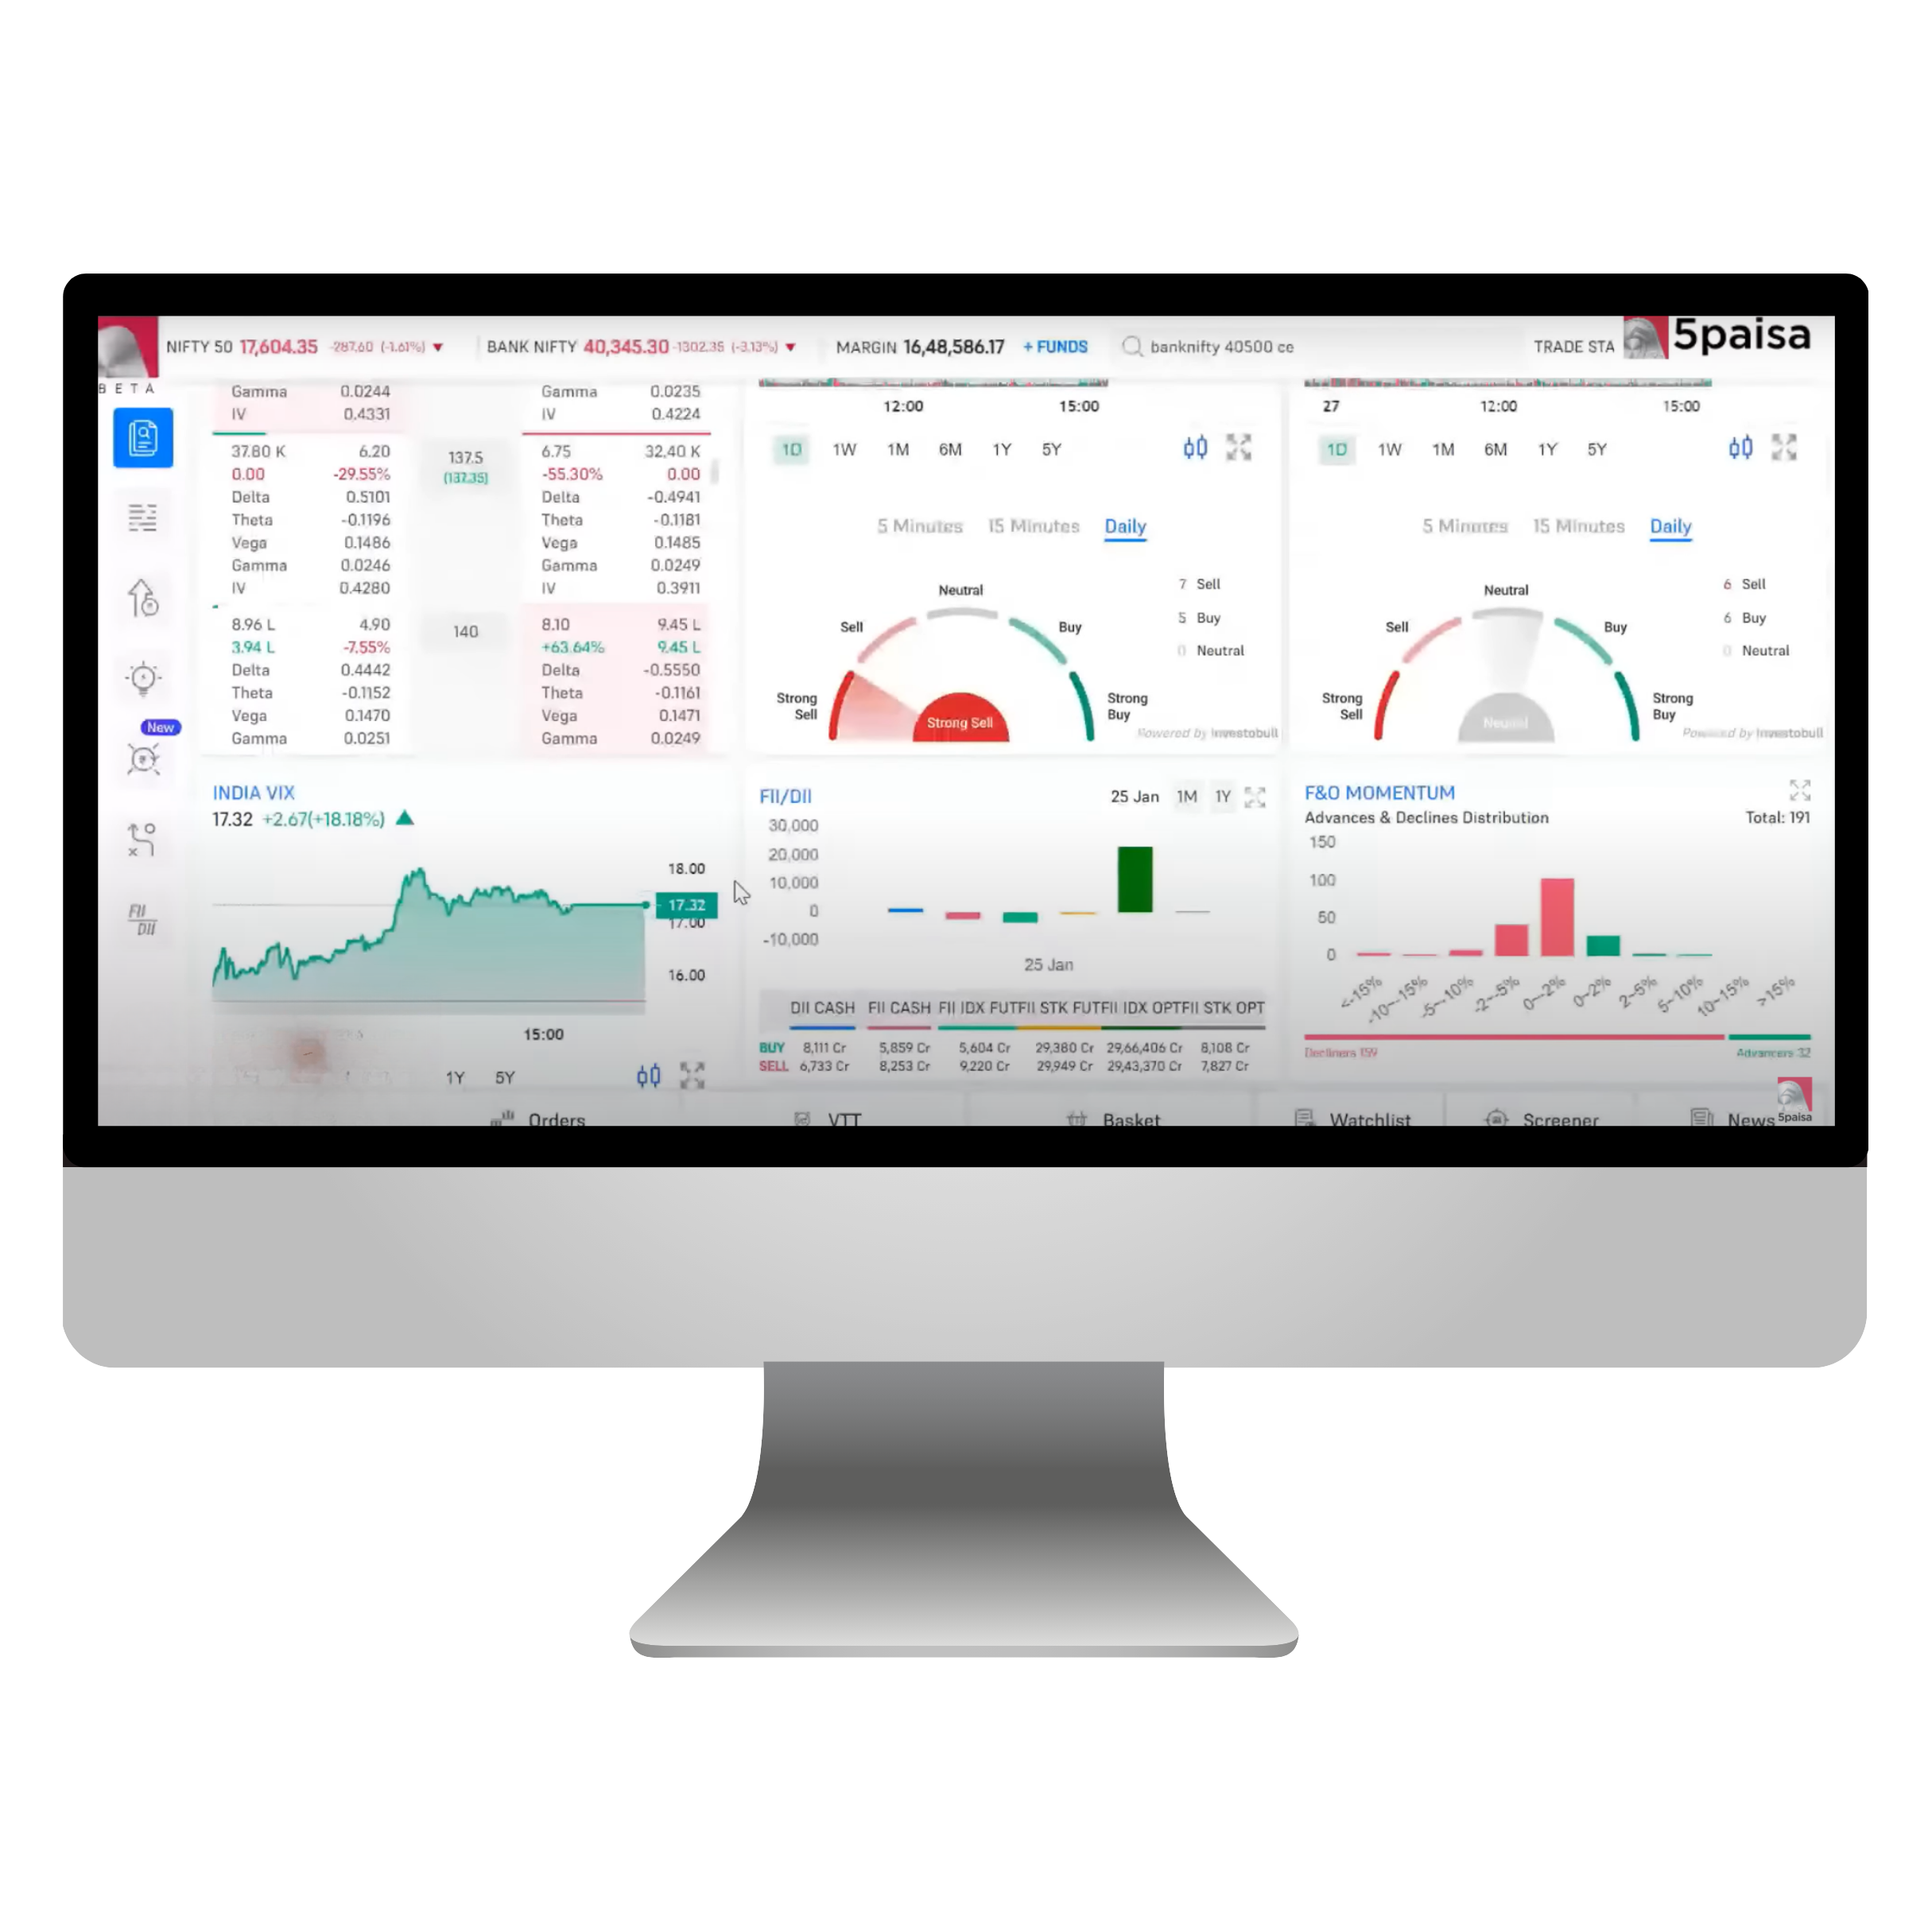
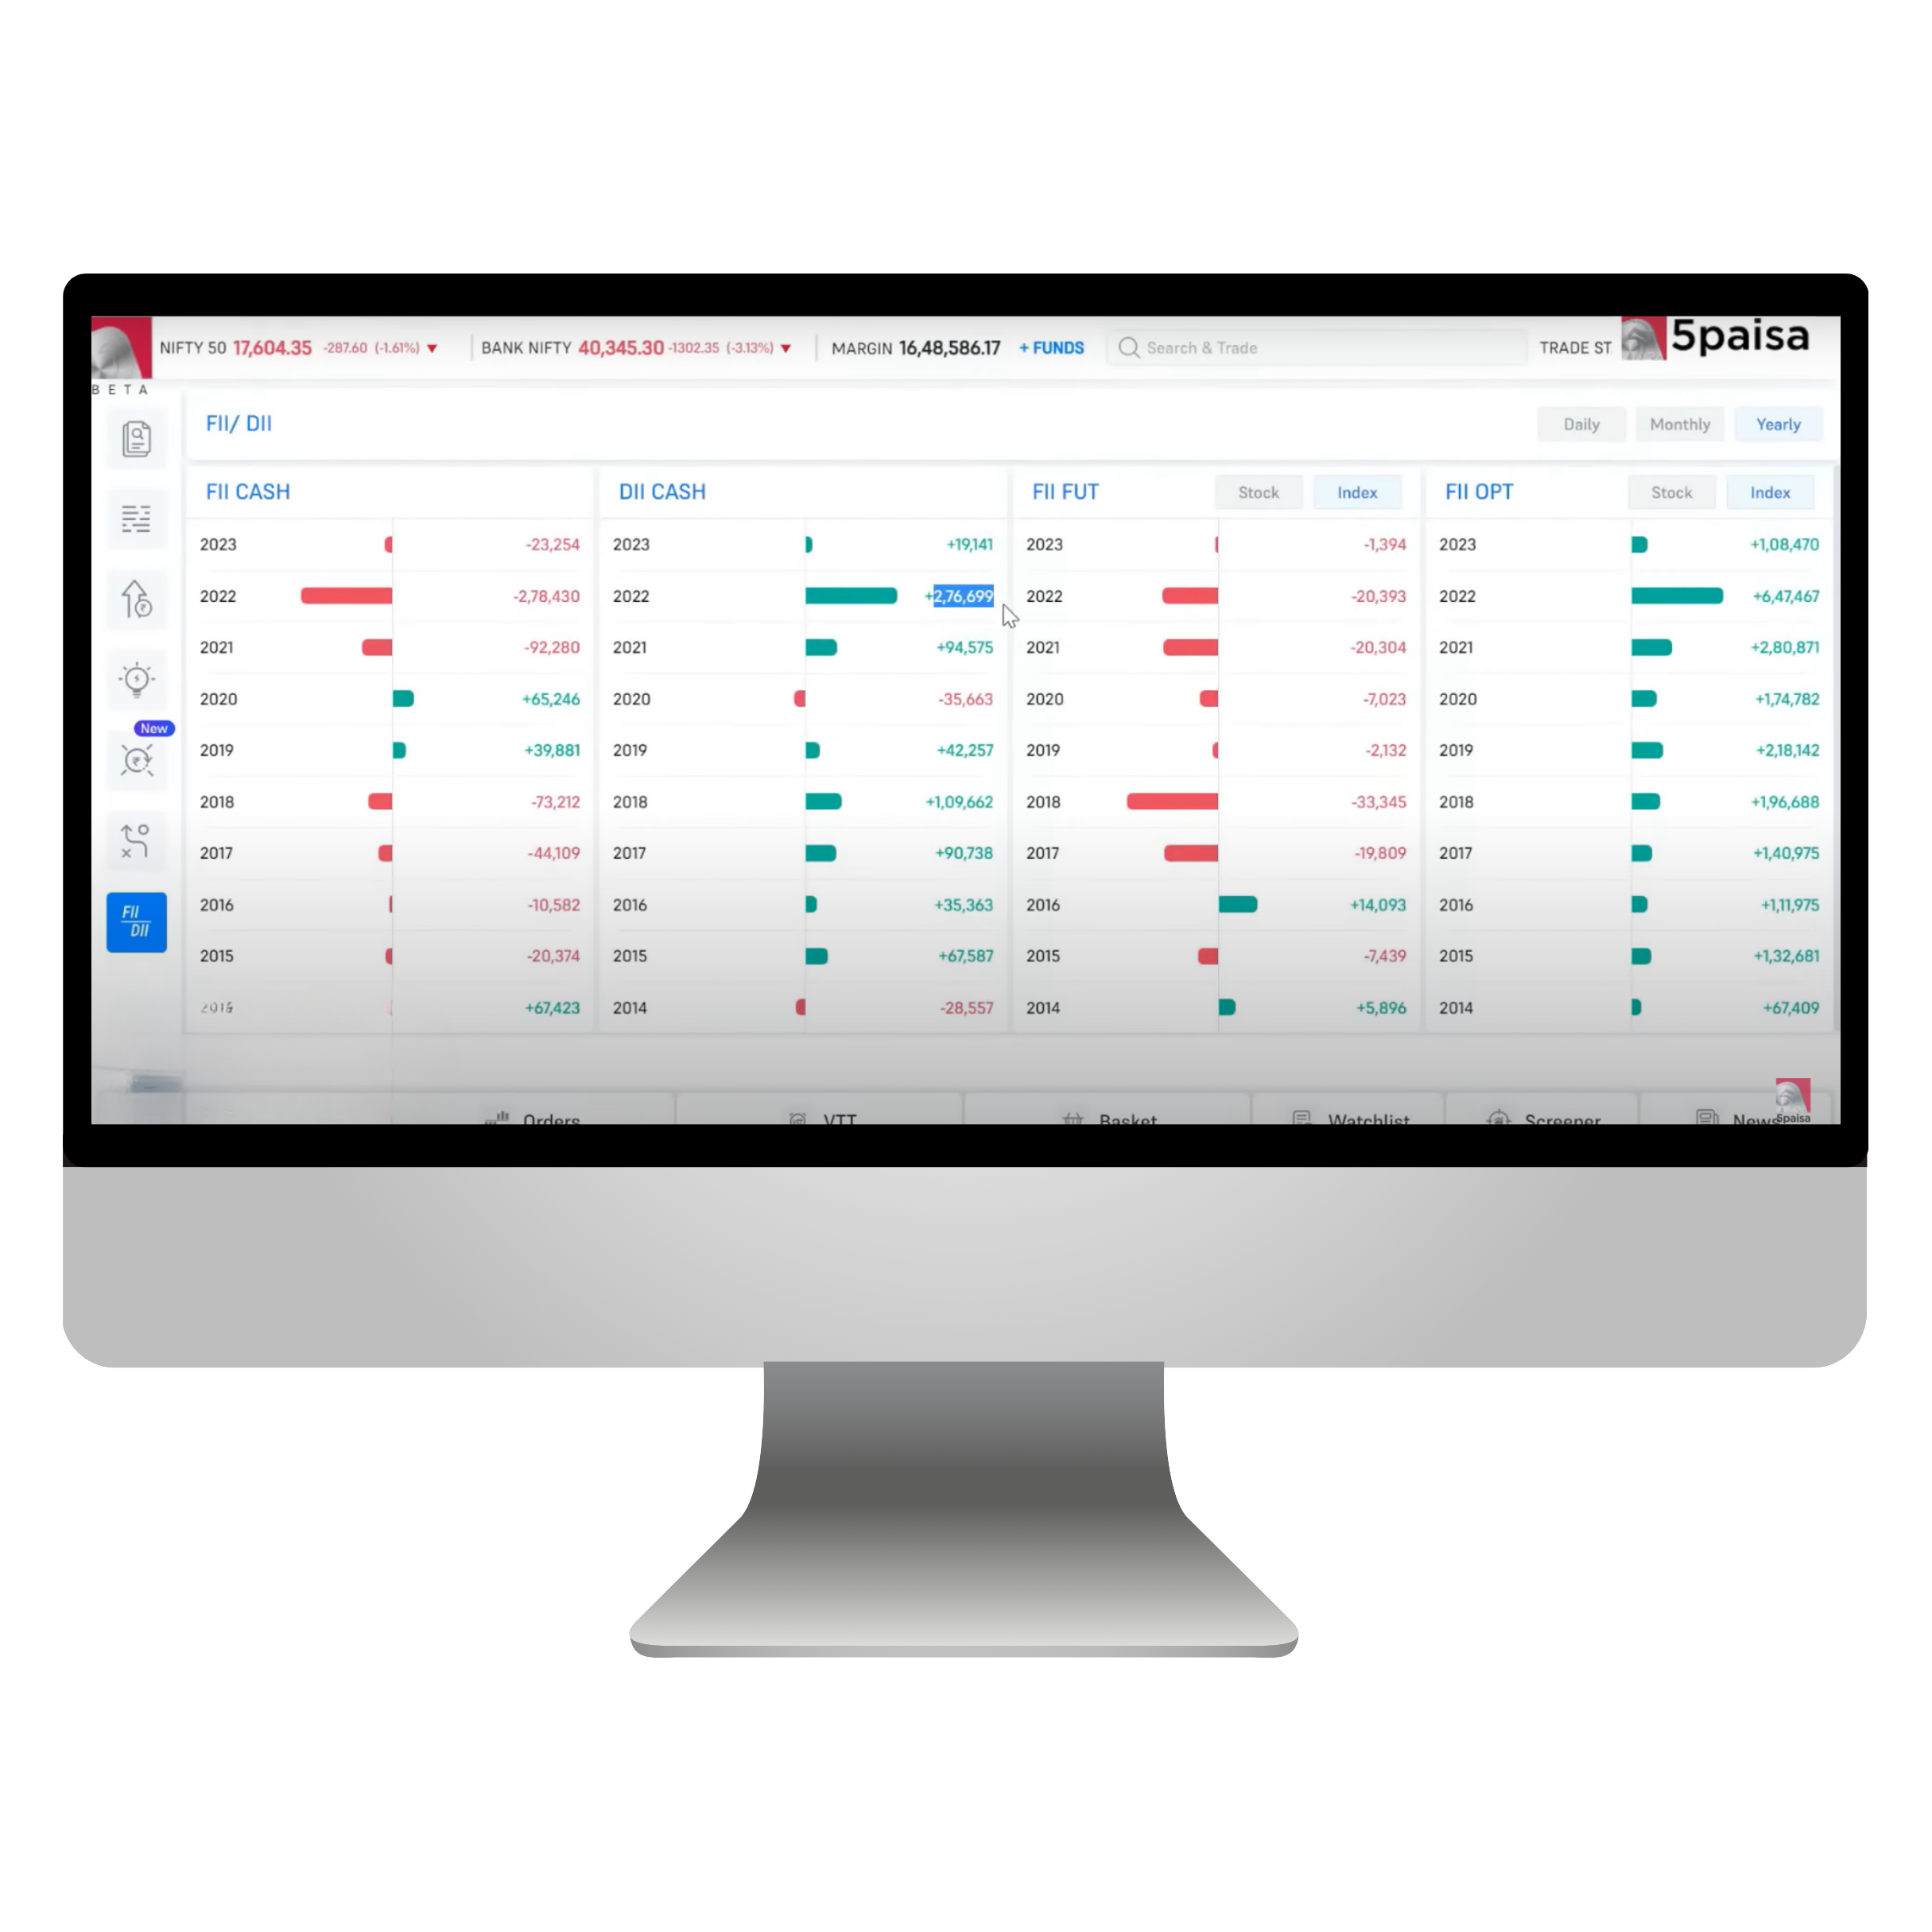
- If you click on expand section you will get detailed analysis of FIIs and DIIs
- Track the trading activity of Foreign Institutional Investors (FIIs) and Domestic Institutional Investors (DIIs), which are key market drivers.
- These tools provide precise, real-time information, helping traders analyse the market efficiently and make informed trading decisions.
How do you create a basket and add orders to a basket in FnO360?

Here’s how to craft your basket and add perfect orders in FnO360:
Navigate to the Basket Section and select the New Basket in the top left corner.
How do you access the basket orders in FnO360?
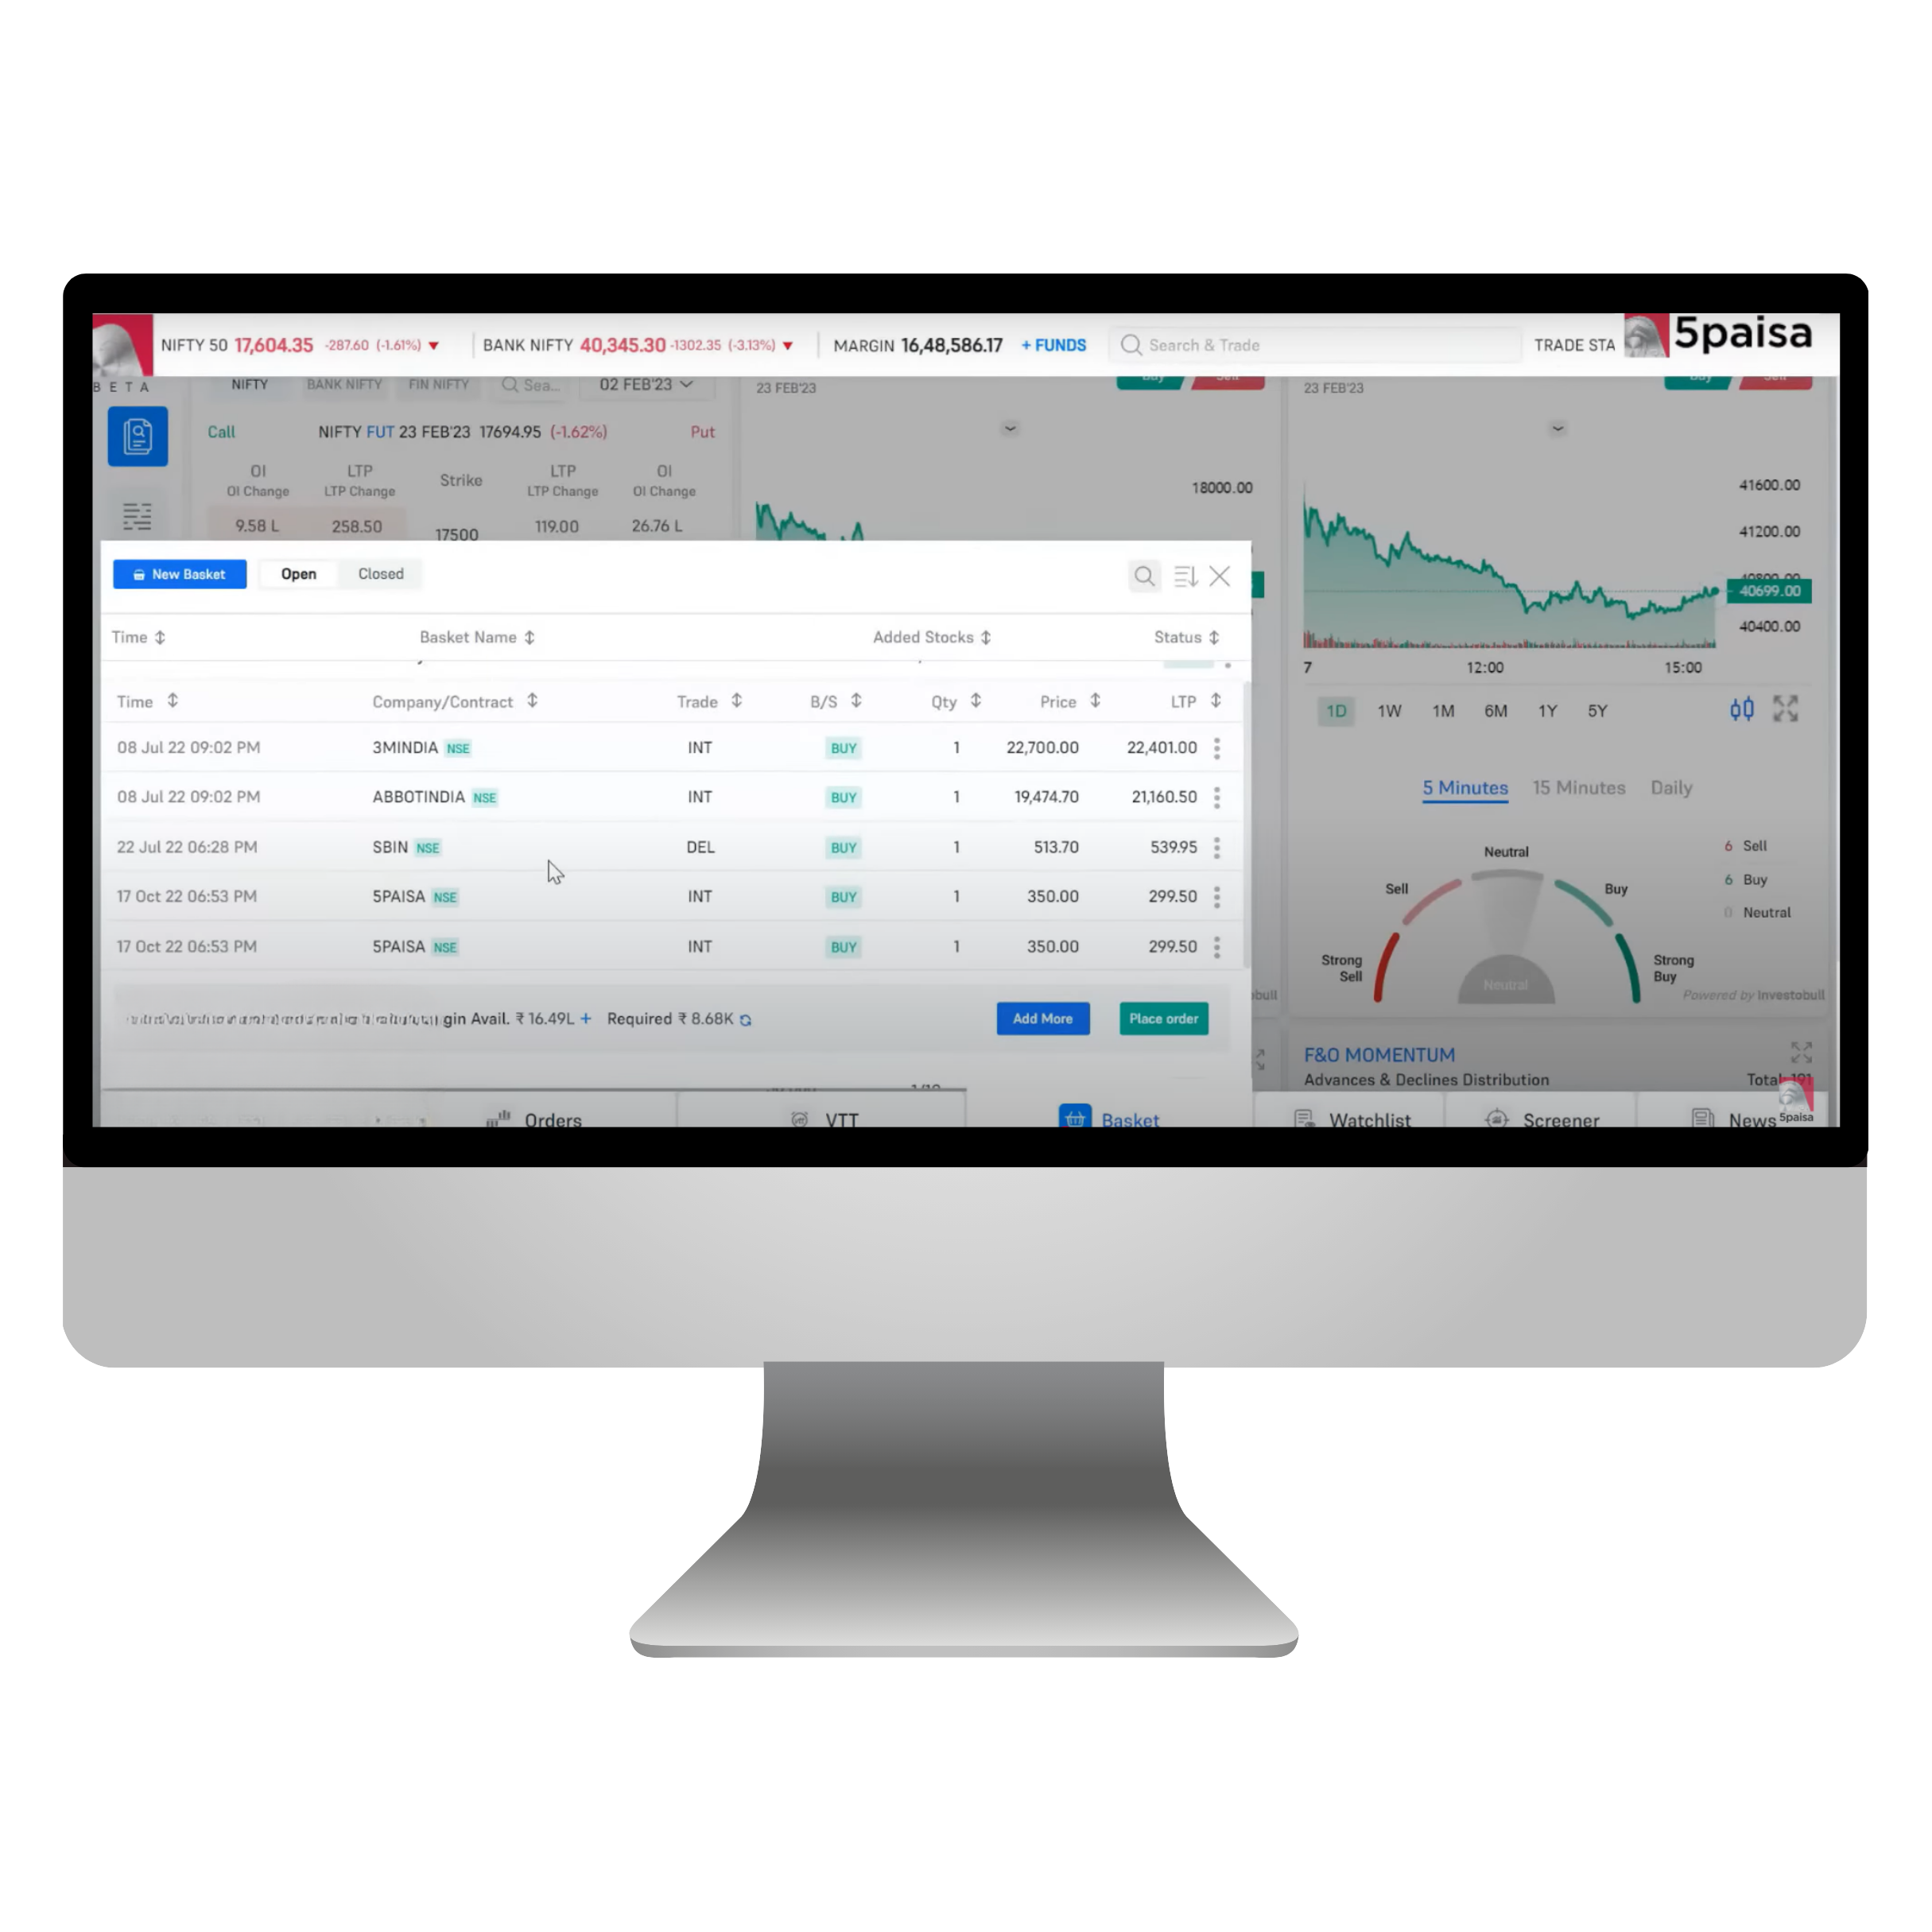
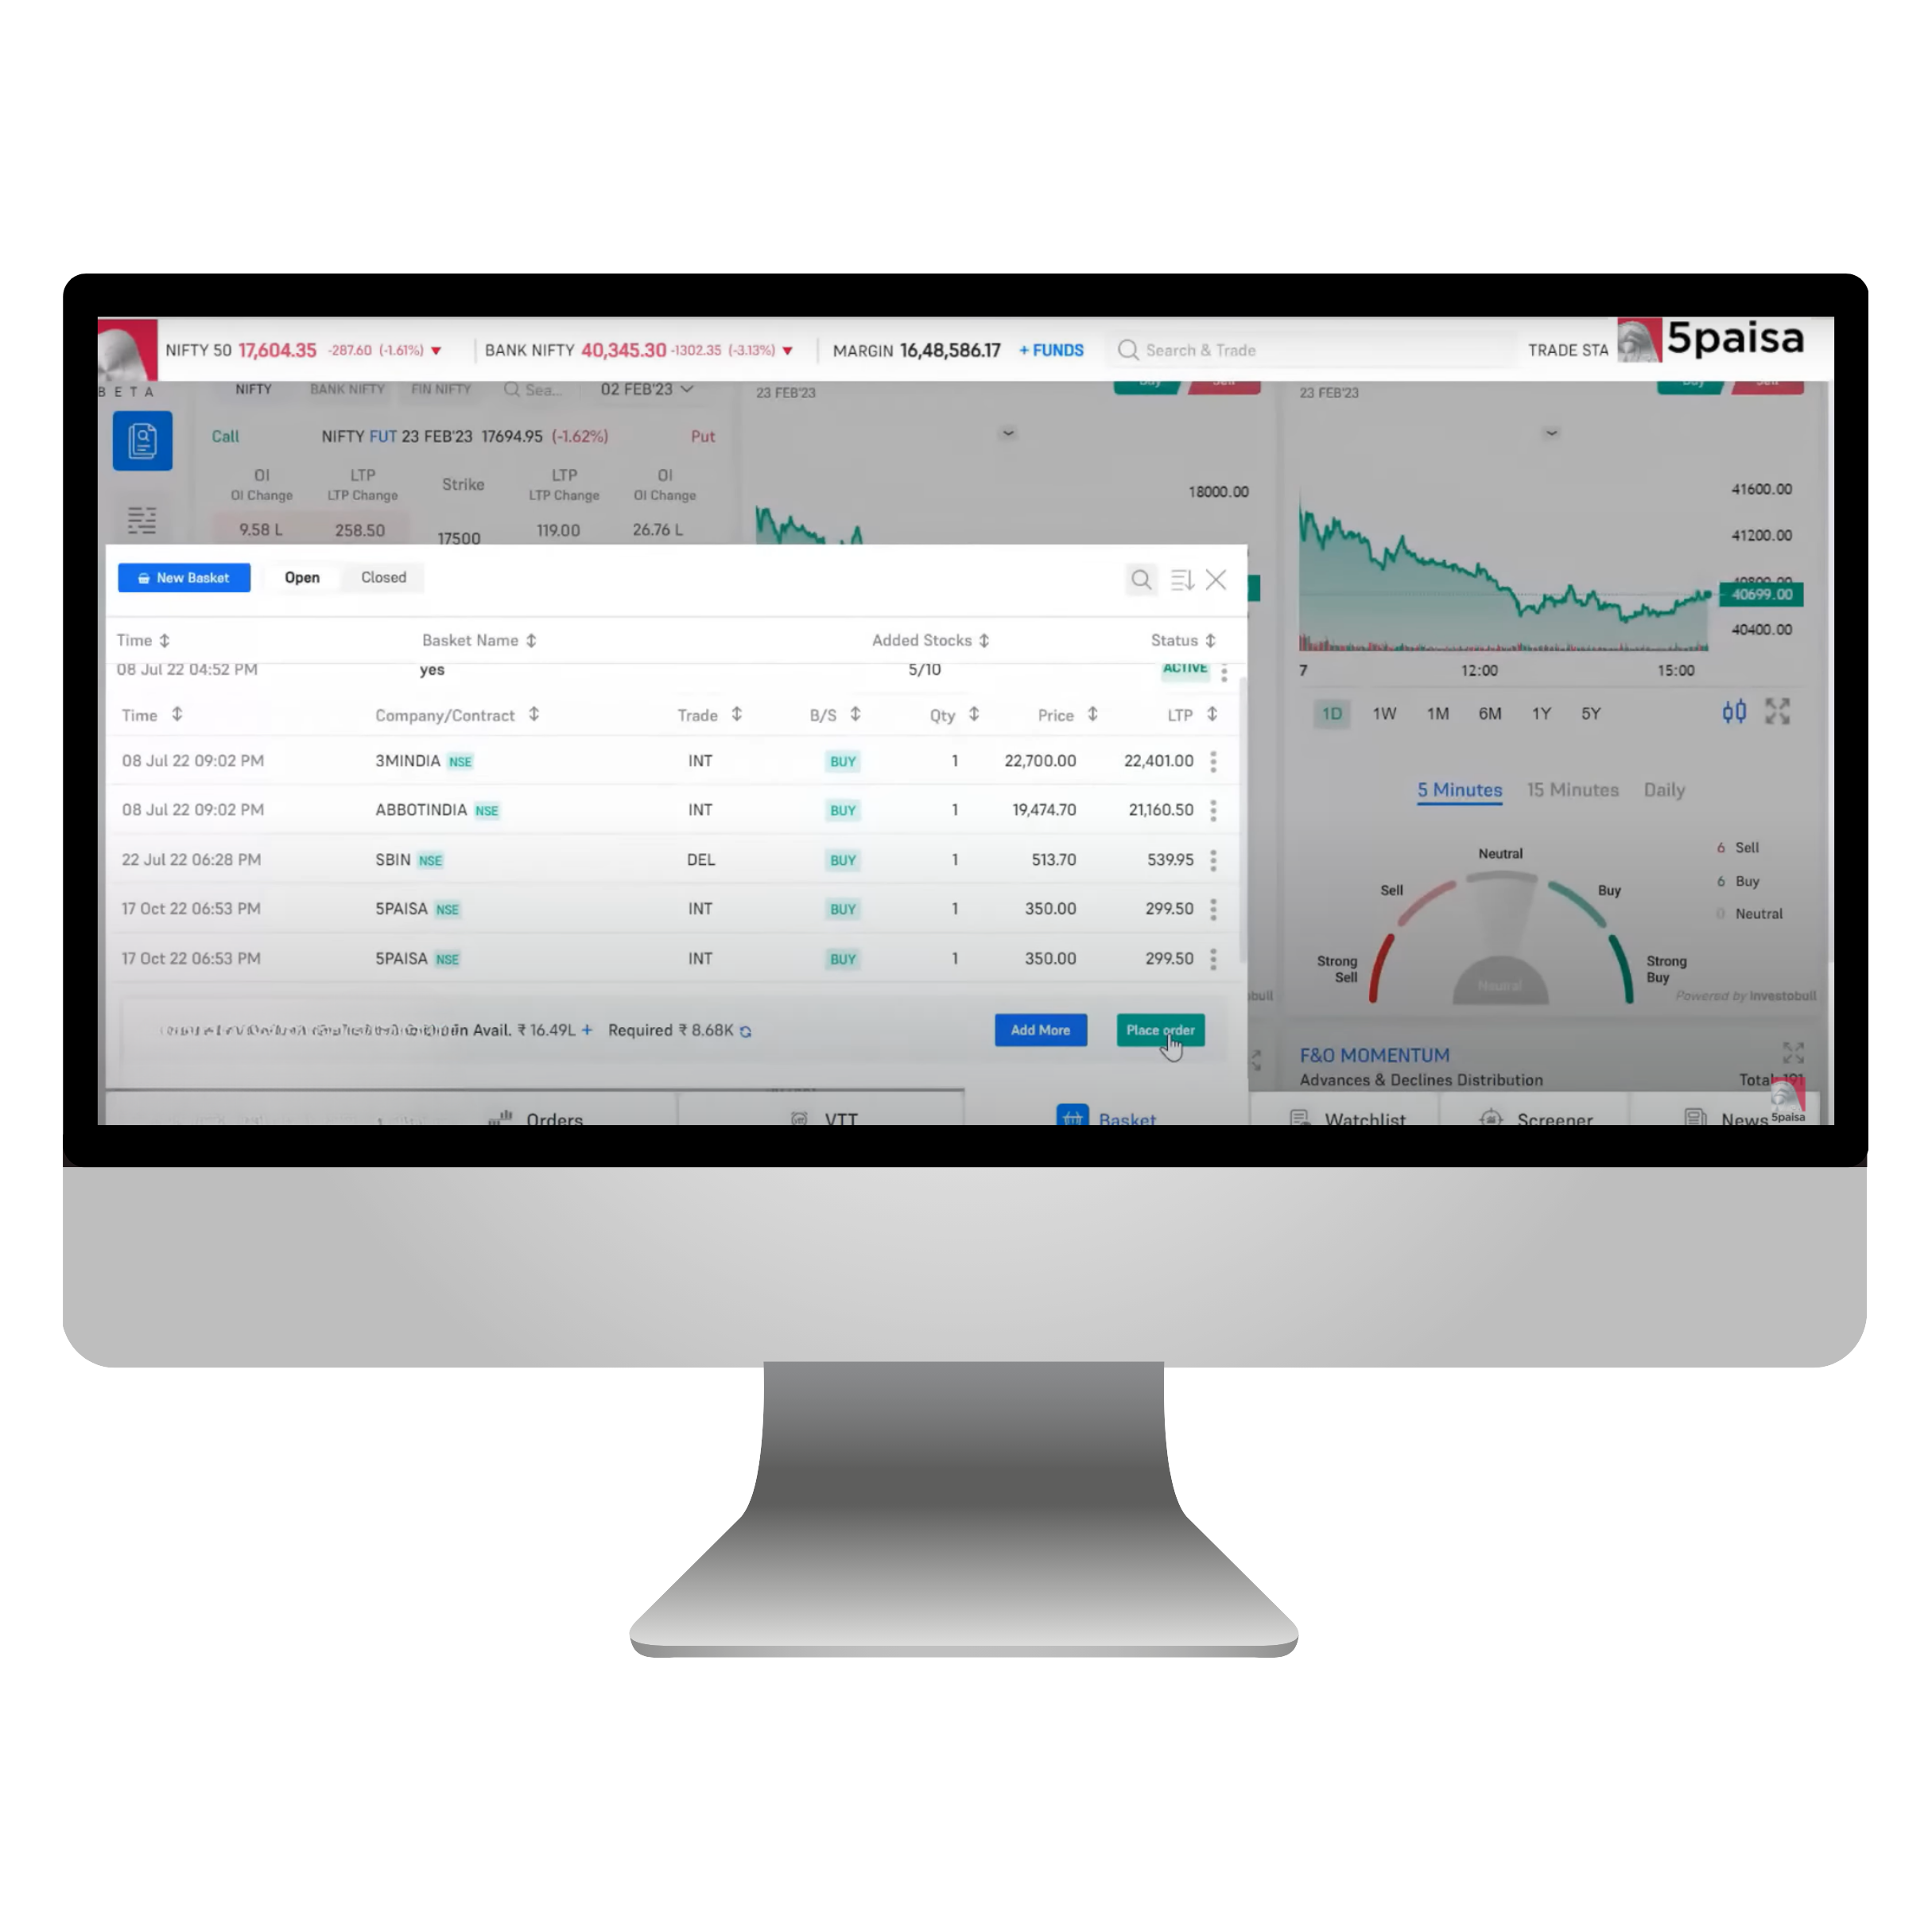
Using basket orders is a convenient way to execute multiple orders across segments. Every order is subjected to an RMS evaluation, and only those that pass the inspection will be submitted to the exchange. Any order that does not satisfy the placement requirements will be declined. You can find the basket orders by exploring the 5Paisa platform. Simply go to the bottom menu and select baskets. A new window will appear for the basket area, allowing you to view all the available baskets. You have the flexibility to create, modify, and remove baskets as you wish.
How many watchlists can I create on FnO360?
You can access a total of 5 watchlists and three customizable watchlists on FnO360.
The watchlists can be accessed on the FnO360 platform anytime. To access the watchlist on FnO360, navigate to the bottom menu and click on a watchlist.
The watchlist on 5Paisa is synced across all the platforms, making it accessible to all created watchlists.
In what segments can a user trade using FnO360?
FnO360 is not only limited to features and options (F&O). Here’s a list of available trading segments for 5paisa users:
- Equity (NSE and BSE)
- Mutual Funds
- Futures and Options (NSE and BSE)
- Currency Derivatives
- Commodity Derivatives
What is the List of documents required for activating FNO/derivative segment?
After your account is activated, if you’d like to enable the FNO or derivative segment, you’ll need to provide financial proof.
To activate the segment, follow these steps:
Via the App:
- Log in to the 5paisa App.
- Go to Menu > My Profile.
- Click on Modify in the top-right corner.
- Select Segment Details > Add Segment.
Via the Web:
- Log in to the 5paisa website.
- Navigate to Menu > My Profile > Segment Details.
- Click on Add Segment.
After clicking Add Segment, select your income range and submit the required financial proof.
Note: Some users may only need to select an income range. Based on internal criteria, we may auto-approve certain segment modification requests.
In other cases, financial proof will be required, which can be submitted through the following methods:
Submission Options:
- Online Upload (Auto Fetch Bank Statement):
The user will be redirected to a third-party page where they can select their bank. Bank statements for the last 6 months will be automatically fetched. - Offline Upload:
The user can choose one document from the list:
- Latest Income Tax Return (ITR)
- Bank Statement (last 6 months)
- Demat Holdings (last 6 months)
- Salary Slip
- Net Worth Certificate
- Copy of Form 16
- Copy of Annual Accounts
- Fixed Deposit (INR 50,000 or above).
1.2.What are Smart Strategies in FnO 360 Platform?

Smart Strategies is a tool that allows users to create their strategies and automate their execution. With this, you can execute your options strategy with pre-defined entry and exit parameters. The word pre-defined means that strategies can be tailored before their execution, where before entering into trades you get to put your desired premium and exit by placing Target/Stop Loss to make the most of your trade.
Following are the parameters that you require to fill in to create your strategies-
- Search for the name of your favourite script.
- Select from Pre-defined Strategies or create your own Strategy.
- Specify the desired premium that you want the strategy to execute for that particular strategy (if the said strategy does not meet the requirement, orders will not be placed).
- Specify exit parameters such as target price and trailing stop loss(the best feature to limit your loss)
- Then you can check your submitted strategy in the Strategy P&L section.
How is it beneficial for the users?
Not only do the Smart Strategies in options executes the strategy, but it also gives a brief about it, like you can check the Payoff Graphs, Futures Chart, Greeks, and P&L, including the position summary such as Margin requirements, breakeven ranges, premium to be received, etc.
Investing becomes a cup of tea when you know the exact trend. Similarly, predefined strategies will only work when you analyze the market and then use the strategies such as straddles, strangles, bull call spreads, etc. to increase the probability of profit.
Here are a few Smart Strategies and features to help you analyze the market before you trade-
- Predefined Strategies– Pre-defined strategies are designed in a way that makes it easy for you to get the readymade build strategy at your fingertip. Here, the customer has the choice of following the same strategy or customizing it.
- Payoff Graphs– Payoff Graphs are profit and loss charts that show the risk/reward profile of an option or combination of options, based on which you can decide on going ahead with the script or not.
- Futures Charts-For a consolidated view and to avoid stock risk, futures charts will give you an overview of the ongoing market trend for the selected index/stock.
- Greeks– The option Greeks are the variables that show how the premium and price movements are related and determine how to measure the future changes in the scrip/index.
- P&L Graphs-You can get an immediate response to the trade’s risks and rewards by looking at these graphs.
- Breakeven Ranges-The breakeven range helps you in analyzing whether you will make a profit with the breakeven point range.
- Margin Requirements-The dashboard will show you the margin requirement to execute the order strategy beforehand.
- Trade Premium-You can determine the probable premium that you will receive on options trades while placing the strategy.
- Strategy Desired Premium– This feature will help you define entry based on the combined premium of strategy.
- Strategy Exit Parameters-The strategy exit parameters help in auto square off of the complete strategy. You can define Fixed Target or Stoploss for the entire strategy. You can also trail your profit/loss by either value or percentage using the Trail By mechanism.
Path to find Smart Strategies on the 5paisa web portal-
- Log in to the 5paisa portal.
- Tap on the FnO 360 button appearing in the upper right corner
- Tap on the Strategies icon from the navigation bar located on the left side of your screen
- Now, you can customize or use the predefined strategy for your options trading
In options trading, smart strategies include defined entry and exit parameters and techniques such as covered calls, protective puts, and iron condors. These strategies optimise performance by continually refining approaches and managing risks. The benefits of smart strategies include increased efficiency, effectiveness, and adaptability to changing market conditions, leading to better-informed decision-making and improved overall outcomes.
Where can you find Smart Strategy on 5paisa?
The access path to Smart Strategies on 5paisa web portal is as follows:
- Log in to the 5paisa
- Tap on the FnO 360 button appearing in the upper right corner.
- Tap on the Strategies icon from the navigation bar located on the left side of your screen.
- Now, you can customise or use the predefined Smart Strategy for trading options.
Which strategy can be executed using Smart Strategies?
5paisa offers you the flexibility to choose from two options with Smart Strategies:
- Predefined Strategies :5paisa provides a selection of predefined strategies that you can readily deploy.
- Custom Strategies: You can also create your own custom strategy based on your preferences. Once you’ve built your strategy, you can execute the trades directly on the 5paisa FnO 360 portal.
What is Desired Premium section in Smart Strategies?
The “Desired Premium” section within Smart Strategies allows you to define the specific price point (premium) at which you want your strategy to enter a trade. Your strategy orders will only be placed when the market premium reaches your desired level.
What does the Exit Parameters section entail on the Smart Strategies platform?
The “Exit Parameters” section on the Smart Strategies platform enables you to establish exit criteria for your strategy.
Here are several tips you can configure using exit parameters:
- Target Prices Indicate the profit targets at which you wish to close your positions.
- Stop-Loss Orders Set your stop-loss thresholds to automatically exit your trades if the market moves unfavourably.
- Trailing Stop-Loss (Optional) Use a trailing stop-loss to adjust your stop-loss price in response to favourable market movements. This method helps secure profits while minimizing potential losses.
What happens if you submit the strategy after-market hours via Smart Strategies?
After you submit strategies after the market closes, the following will take place:
- Activation of Your strategy will become operational the next day at 9:15 am, assuming you are logged into Smart Strategies. If you are not logged in at that time, the strategy will activate the next time you log in.
- Order Placement once your strategy is operational, it will automatically execute orders based on the entry and exit criteria you have set.
- Market Orders If your strategy specifies “market orders” for entry, the trades will be executed right when the market opens at 9:15 am.
Note: Submitting after hours means your strategy may miss advantageous entry points that could arise before the market opens at 9:15 am.
What would happen if you missed logging in for positional strategy?
If you neglect to log in to Smart Strategies while a positional strategy is ongoing, you can anticipate the following outcomes:
- No Orders Executed Your strategy will not automatically initiate new orders for entering or exiting positions if you’re not logged in, even if your specified entry or exit criteria are satisfied.
- Active Existing Positions Any existing positions initiated by the strategy will remain active. However, you will have to manually close (square off) these positions if your exit criteria are met.
- New Strategies Needed If your initial strategy did not enter a position due to your absence, you will need to formulate a new strategy to commence the trade.
Keep in mind: Regular logins ensure that your Smart Strategies can carry out your trading plan efficiently.
Is it possible to manually oversee the deals made using Smart Strategies?
Order placement is automated by the Smart Strategies according to your specified specifications. Knowing how manual involvement may affect your trades is crucial:
Mismanagement of Trade
- Changing trades made by Smart Strategies by hand, like squaring off a long position, may have unforeseen repercussions.
- Depending on your initial settings, the strategy may still carry out its own exit logic, which could result in redundant or contradicting commands.
Suggested Method
- 5paisa advises managing open positions started by Smart Strategies through the platform’s specified “square-off” tool (if available) in order to prevent these issues.
- For optimum efficiency, it is therefore usually ideal to let Smart Strategies handle trades in accordance with your specified specifications without requiring human interaction.
Is it possible to change the approach using Smart Strategies once it has been placed?
Smart Strategies are adaptable. In actuality, even after submitting your approach, you are free to modify its exit settings. Additionally, it lets you adjust your trailing stop settings, stop-loss levels, and profit objectives as necessary.
Note: Once the strategy has been placed, it is not possible to change the entry parameters (such as the price points at which trades are initiated). You must remove the current strategy and develop a new one with the required changes if you need to alter the entry requirements.
Is it possible to halt the Strategy?
Yes, you can choose to put your 5paisa Smart Strategy on hold. Even if your specified requirements are satisfied, the strategy will become inactive once you pause it and won’t execute any more entry or exit orders. If market conditions change or you need to modify your trading plan, it will enable you to temporarily stop the strategy’s activity.
Are you able to continue the Strategy?
A previously halted Smart Strategy can indeed be reactivated. Following your return, your strategy will be active once again and you will start keeping an eye on market circumstances to find entry and exit chances within the parameters you have set.
What if you don’t have sufficient margin in the account?
If you attempt to execute a trade through a Smart Strategy but your account lacks sufficient margin, 5paisa will then reject the trade and notify you with an “insufficient margin” message.
Monitoring Strategy Logs
To view a history of your Smart Strategy activity, click on the “History” icon on the Strategy P&L page on the 5paisa platform. Any rejected trades due to margin issues will help you identify any margin shortfalls that might be preventing your strategies from executing as planned.
It is important to maintain an adequate margin in your account to avoid trade rejections and potential disruptions to your Smart Strategies. Please consider reviewing your margin requirements and available balance before deploying your strategies.
Where can you see the trades placed via Smart Strategies?
You can see the trades placed by your smart strategies in two ways:
- Order Book Look for the trades within the 5paisa platform’s order book. It will be identified with a special tag (like “ss”) indicating they were initiated by a Smart Strategy.
- Strategy P&L Page It is a dedicated page on 5paisa platform that provides a detailed breakdown of your Smart Strategy performances. You can find records of all trades executed by the strategy on this page.
Where can You see strategy P&L?
There are two convenient ways to monitor the profit or loss (P&L) of your Smart Strategies:
- Strategy P&L Page
The Strategy P&L Page is a dedicated page within the 5paisa platform that offers real-time P&L information specific to your strategy’s performance. It provides a clear view of your strategy’s activity and current profitability.
- 5paisa Net Position Tab
Web Platform
- Log in to the 5paisa website and navigate to the “Orders & Positions” section from the left-hand menu.
- Then, click on “Positions” to access your overall position overview.
Your Smart Strategy’s P&L will be displayed alongside your other holdings.
- Mobile App
- Access the “Ideas Section” within the 5paisa mobile app.
- Navigate to “Advanced Strategies” and select the “Manage or Live Strategy” link.
It will display your Smart Strategy’s dedicated P&L information.
What if You don’t have sufficient margin in the account?
If you attempt to execute a trade through a Smart Strategy but your account lacks sufficient margin, 5paisa will then reject the trade and notify you with an “insufficient margin” message.
Monitoring Strategy Logs
To view a history of your Smart Strategy activity, click on the “History” icon on the Strategy P&L page on the 5paisa platform. Any rejected trades due to margin issues will help you identify any margin shortfalls that might be preventing your strategies from executing as planned.
Recommendation
It is important to maintain an adequate margin in your account to avoid trade rejections and potential disruptions to your Smart Strategies. Please consider reviewing your margin requirements and available balance before deploying your strategies.
1.3.Understanding Open Interest
Open Interest (OI) is a critical concept in the derivatives market, representing the total number of outstanding contracts—futures or options—that remain active and unsettled. It serves as a key indicator of market activity and provides traders, investors, and analysts with valuable insights into market trends, liquidity, and sentiment. To understand OI in depth, it is essential to explore its definition, how it is calculated, its relationship with volume and price, its implications for market trends, and its practical applications.
Open Interest is important for both stock futures traders as well as options traders. This section gives you a fair idea of the statistically unique parameter in the derivatives segment. OI has been integrated with the form of graphs, using which a user can analyze the market movement based on the investor’s interest.
Definition and Nature of Open Interest
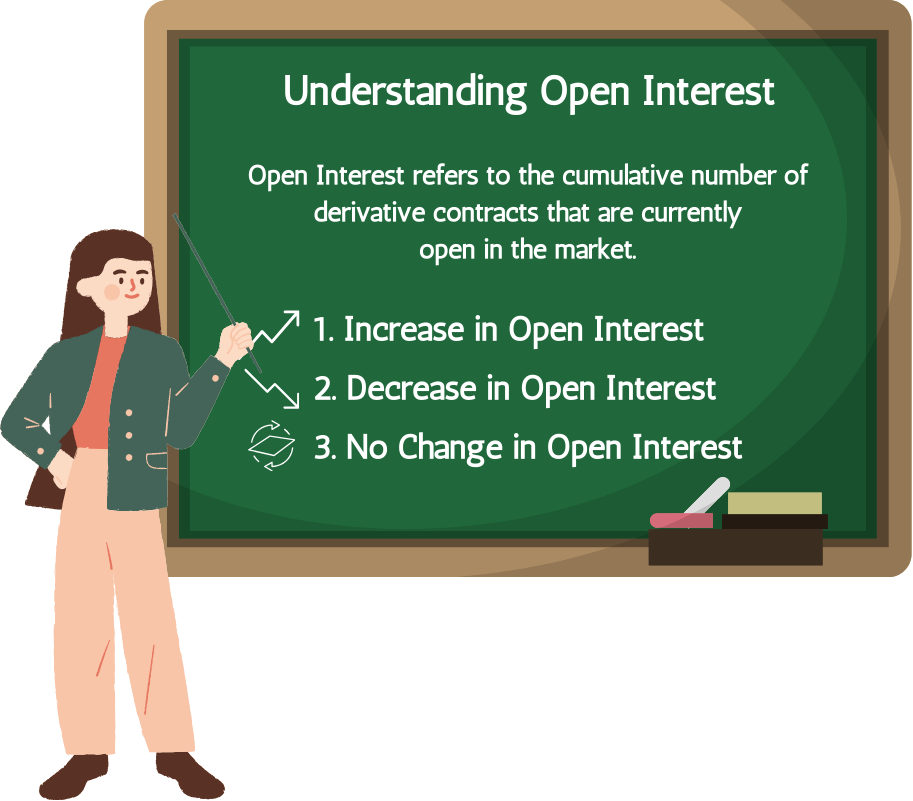
In simple terms, Open Interest refers to the cumulative number of derivative contracts that are currently open in the market. A derivative contract, whether a future or an options contract, is an agreement between two parties: a buyer and a seller. For OI, each contract is counted once, regardless of how many times it has been traded. OI measures the total number of active positions rather than the number of participants or trades.
Unlike trading volume, which resets to zero at the start of each trading session and measures the number of contracts traded during a given period, OI is a running tally. It increases when new contracts are created and decreases when existing contracts are closed. This ongoing nature makes OI a dynamic and evolving metric that reflects the cumulative interest of market participants in a particular derivative.
How Open Interest is Calculated
Understanding the calculation of Open Interest involves grasping the dynamics of contract creation and closure:
- Increase in Open Interest: When a new buyer and seller create a contract, OI increases by one. For instance, if a trader takes a long position, and another trader takes the corresponding short position, a new contract is added to OI.
- Decrease in Open Interest: When an existing buyer and seller close their positions, OI decreases. For example, if a trader holding a long position sells to a trader who closes their short position, the contract is removed from OI.
- No Change in Open Interest: If a contract is transferred between participants, OI remains unchanged. For instance, when a trader sells a long position to another trader entering a long position, the contract persists without affecting OI.
By summing these changes over time, OI provides a snapshot of the total number of active contracts at any given point.
Open Interest vs. Trading Volume
Although Open Interest and trading volume are related, they measure different aspects of market activity. Trading volume captures the number of contracts traded within a specific time frame, such as a day, and resets daily. In contrast, OI reflects the total outstanding contracts and accumulates over time. Volume can be high in a session, yet OI might not change significantly if most trades involve existing contracts being closed or transferred.
The interplay between OI and volume offers valuable insights:
- High Volume with Increasing OI: Indicates the formation of new contracts, signalling growing market participation.
- High Volume with Decreasing OI: Suggests liquidation of positions, indicating reduced interest in maintaining positions.
- Low Volume with Flat OI: Reflects a lack of new participation or hesitation among traders.
Open Interest and Price Trends
Analyzing OI in conjunction with price trends provides critical information about market behaviour and sentiment. The relationship between price movement and OI changes can indicate the strength and direction of a trend:
- Rising OI with Price Increase: Indicates bullish sentiment as new participants enter long positions, supporting the upward trend.
- Rising OI with Price Decrease: Reflects bearish sentiment as more traders enter short positions, reinforcing the downward trend.
- Falling OI with Price Increase: Suggests short covering rather than fresh buying, potentially indicating a weakening bullish trend.
- Falling OI with Price Decrease: Indicates position liquidation rather than new selling, possibly signalling an end to the bearish trend.
- Flat OI with Price Movement: Suggests indecision or low conviction among market participants, often preceding a consolidation phase.
By interpreting these patterns, traders can identify opportunities and anticipate potential reversals or continuations of trends.
Role of Open Interest in Market Analysis
Open Interest is a vital tool for market analysis, offering insights into market liquidity, participation, and sentiment. Here are some of its key roles:
- Liquidity Indicator:
High OI is associated with greater liquidity, making it easier for traders to enter or exit positions without significant price impact. Liquid markets are typically more efficient and attract more participants.
- Market Participation Gauge:
Rising OI indicates increased participation and interest in the market. Conversely, declining OI suggests waning interest or a lack of new participants.
- Trend Confirmation:
OI trends can confirm the strength or weakness of price movements. For instance, rising OI alongside an upward price trend signals strong bullish sentiment and trend sustainability.
- Sentiment Analysis:
OI provides insights into whether traders are predominantly bullish or bearish. A surge in OI during a price decline indicates growing bearish sentiment, while increasing OI during a price rise signals bullish confidence.
Example of Open Interest
|
Day |
Starting Open Interest |
Trading Volume |
New Contracts Opened |
Contracts Closed |
Ending Open Interest |
|
Day 1 |
500 |
100 |
60 |
40 |
520 |
|
Day 2 |
520 |
150 |
100 |
50 |
570 |
|
Day 3 |
570 |
200 |
80 |
120 |
530 |
|
Day 4 |
530 |
180 |
60 |
120 |
470 |
|
Day 5 |
470 |
220 |
160 |
60 |
570 |
Explanation:
- Day 1:
- Starting Open Interest: 500 contracts.
- Trading Volume: 100 contracts (60 new, 40 closed).
- Ending Open Interest: 500 + 60 – 40 = 520 contracts.
- Day 2:
- Starting Open Interest: 520 contracts.
- Trading Volume: 150 contracts (100 new, 50 closed).
- Ending Open Interest: 520 + 100 – 50 = 570 contracts.
- Day 3:
- Starting Open Interest: 570 contracts.
- Trading Volume: 200 contracts (80 new, 120 closed).
- Ending Open Interest: 570 + 80 – 120 = 530 contracts.
- Day 4:
- Starting Open Interest: 530 contracts.
- Trading Volume: 180 contracts (60 new, 120 closed).
- Ending Open Interest: 530 + 60 – 120 = 470 contracts.
- Day 5:
- Starting Open Interest: 470 contracts.
- Trading Volume: 220 contracts (160 new, 60 closed).
- Ending Open Interest: 470 + 160 – 60 = 570 contracts.
Practical Applications of Open Interest
Traders and analysts use Open Interest as part of their decision-making process to gain a deeper understanding of market dynamics. Some practical applications include:
- Identifying Breakouts: Rising OI with significant price movement can signal the start of a strong trend. For example, increasing OI during a price breakout from a consolidation phase confirms fresh participation.
- Detecting Reversals: Declining OI with sustained price movement may indicate trend exhaustion, warning traders of potential reversals.
- Assessing Market Sentiment: By analyzing OI trends, traders can gauge whether the market is predominantly bullish or bearish, aiding in sentiment-based strategies.
- Evaluating Risk: High OI in a particular contract or strike price may indicate concentrated positions, which could lead to volatility during sharp price movements.
Limitations of Open Interest
While OI is a valuable metric, it has its limitations and should be used in conjunction with other indicators:
- Lagging Indicator: OI changes are reported at the end of the trading session, making it a lagging indicator of real-time market activity.
- Context Dependency: OI’s significance varies across markets and instruments. For instance, high OI in equity options may not have the same implications as in commodity futures.
- Not a Standalone Metric: Relying solely on OI can lead to incomplete conclusions. Combining it with volume, price action, and other technical indicators provides a more comprehensive analysis.
1.4 Back testing Open Interest (OI) analysis for algorithmic strategies
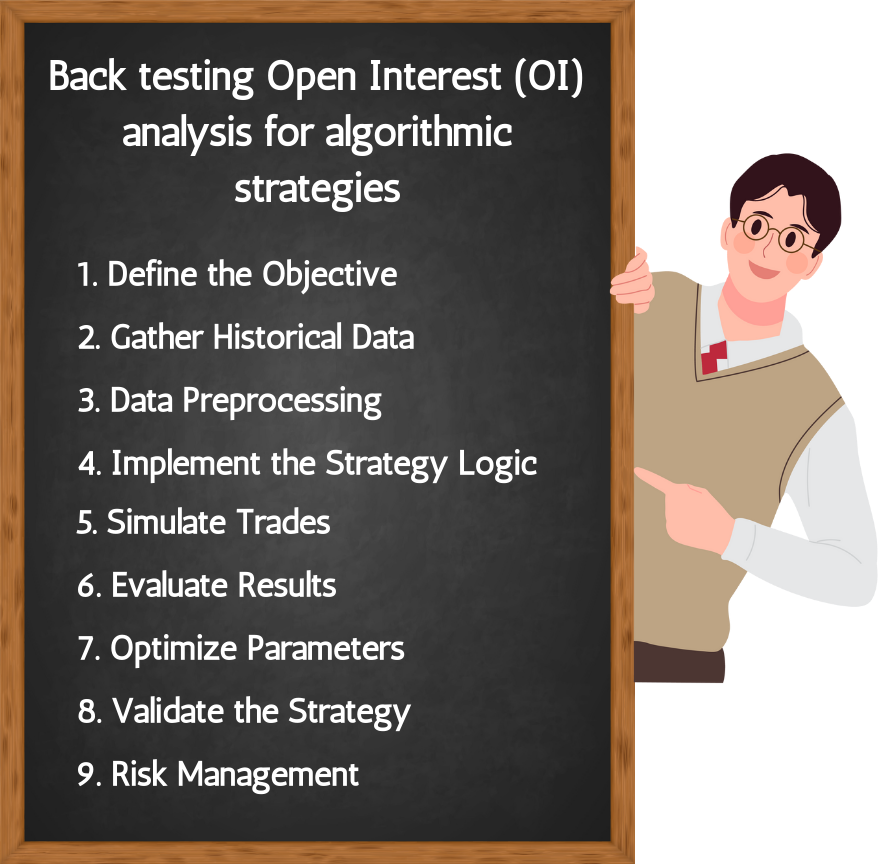
Back testing Open Interest (OI) analysis for algorithmic strategies involves simulating how the strategy would have performed in the past based on historical Open Interest data, along with other relevant market data like price and volume. Here’s a structured approach to conducting back testing for OI-based strategies:
-
Define the Objective
Strategy Description: Clearly outline the hypothesis or strategy you wish to test. For example:
- A rise in OI coupled with price increase signals bullish sentiment.
- A drop in OI with price rise suggests short covering.
Metrics to Measure: Decide on performance metrics such as profit/loss, Sharpe ratio, win rate, drawdown, etc.
-
Gather Historical Data
- Open Interest Data: Obtain historical OI data for your chosen instruments (e.g., futures or options).
- Market Data: Collect historical price data (open, high, low, close) and volume data.
Granularity: Choose the data frequency (e.g., daily, hourly, or minute-wise) based on your strategy.
-
Data Preprocessing
- Align Data: Ensure OI, price, and volume data are synchronized with the same timestamps.
- Filter Data: Remove anomalies like missing values or errors.
Create Indicators: Derive necessary indicators, such as:
- OI change percentage.
- Price change percentage.
- Implied Volatility (if options are involved).
-
Implement the Strategy Logic
Code your strategy’s entry and exit conditions based on OI signals. For example:
- Long Entry: If OI increases by more than 10% and price rises by 2% within a given period.
- Short Entry: If OI decreases by more than 10% while price falls by 2%.
- Exit: Define clear stop-loss, target, or trailing conditions.
-
Simulate Trades
Use historical data to simulate trades based on the strategy logic.Track:
- Entry and exit points.
- Profit and loss per trade.
- Cumulative returns.
-
Evaluate Results
Analyze the backtested performance:
- Metrics: Calculate total returns, average return per trade, win/loss ratio, maximum drawdown, etc.
- Visualization: Plot equity curves, OI trends with prices, and PnL over time for better insights.
-
Optimize Parameters
- Adjust thresholds like OI or price change percentages to optimize performance.
- Use techniques like grid search or genetic algorithms for optimization.
-
Validate the Strategy
- Test the strategy on out-of-sample data to ensure it performs well on unseen data.
- Perform a walk-forward analysis to test its adaptability over different market conditions.
-
Risk Management
- Incorporate position sizing and risk management rules to reduce the likelihood of large losses.
- Consider transaction costs, slippage, and liquidity constraints in your calculations.
1.5 What are Options Chain
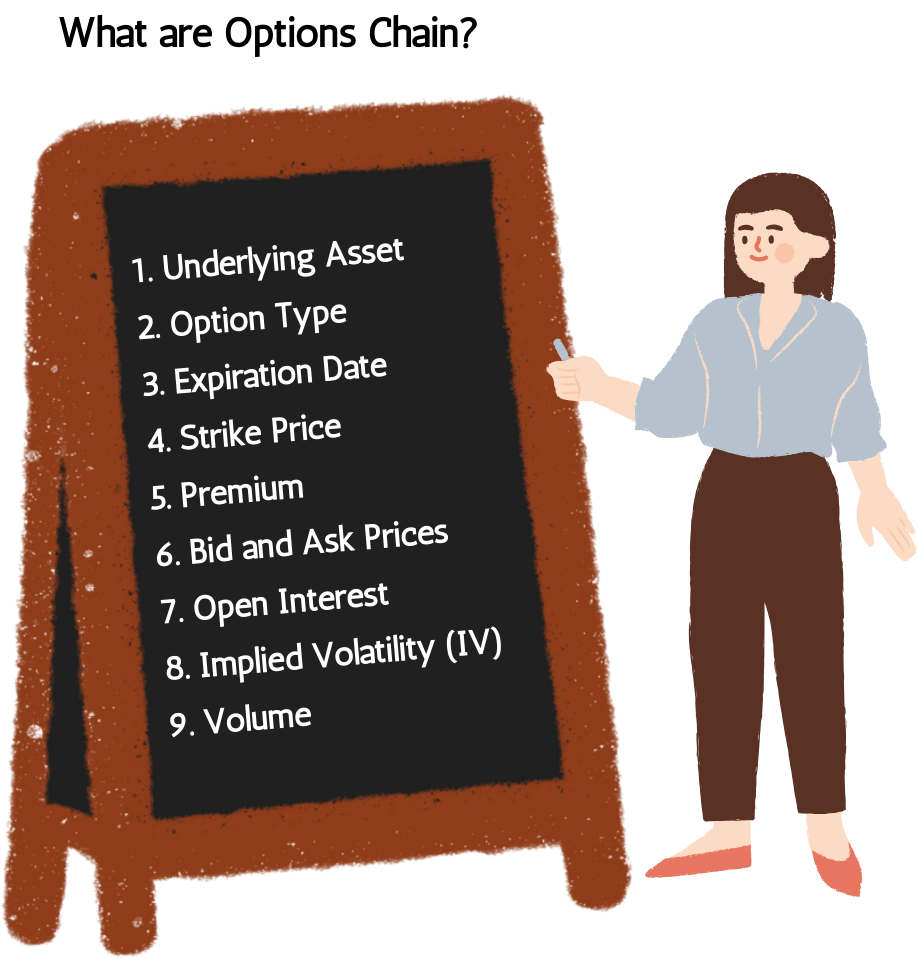
An options chain is a listing of all available option contracts for a particular underlying asset, such as a stock, index, or commodity. It provides crucial information that traders and investors use to make informed decisions about their option trading strategies. Let’s delve into the details of an options chain and its components:
Components of an Options Chain
- Underlying Asset: This is the asset for which the options are being traded. It could be a stock, index, ETF, commodity, or currency.
- Option Type:
- Call Options: These give the holder the right (but not the obligation) to buy the underlying asset at a specified price (strike price) before or on the expiration date.
- Put Options: These give the holder the right (but not the obligation) to sell the underlying asset at a specified price before or on the expiration date.
- Expiration Date: This is the date on which the option contract expires. Options can have various expiration dates, such as weekly, monthly, or quarterly.
- Strike Price: The strike price is the predetermined price at which the underlying asset can be bought (call option) or sold (put option) if the option is exercised.
- Premium: The premium is the price paid by the buyer of the option to the seller. It consists of two components: intrinsic value and time value.
- Bid and Ask Prices:
- Bid Price: The highest price a buyer is willing to pay for the option.
- Ask Price: The lowest price a seller is willing to accept for the option.
- Open Interest: This represents the total number of outstanding option contracts that have not been settled or closed. It indicates the level of market activity and interest in a particular option.
- Implied Volatility (IV): Implied volatility is a measure of the market’s expectations for the future volatility of the underlying asset. Higher IV generally indicates higher premiums and vice versa.
- Volume: This shows the number of option contracts traded during a specific period, usually the trading day.
How to Read an Options Chain
An options chain typically appears in a tabular format with calls and puts listed side by side. Here’s an example of how an options chain might look:
Using an Options Chain for Trading
- Identifying Opportunities: An options chain helps traders identify potential trading opportunities based on their market outlook, desired risk level, and investment strategy.
- Evaluating Premiums: Traders can compare premiums across different strike prices and expiration dates to find the best value for their options trades.
- Analyzing Open Interest and Volume: High open interest and volume indicate active interest in a particular option, which can be a sign of a liquid market and potentially more favourable trading conditions.
- Assessing Implied Volatility: By analyzing implied volatility, traders can gauge market expectations and adjust their strategies accordingly. For example, higher IV might indicate a good opportunity for selling options due to higher premiums.
- Strategy Selection: Based on the information in the options chain, traders can choose from various options strategies, such as buying calls or puts, selling covered calls, or constructing more complex strategies like spreads and straddles.
Example Scenario
Let’s say you are considering trading options for a stock currently priced at ₹100. You analyze the options chain and find the following:
- Call Option with a Strike Price of ₹100: Bid ₹3.50, Ask ₹3.60, OI 1200.
- Put Option with a Strike Price of ₹100: Bid ₹2.50, Ask ₹2.60, OI
With an expiration date of January 21, 2025, and an implied volatility of 20%, you can evaluate the following:
- Cost to Buy the Call Option: ₹3.60 per share (since each option contract represents 100 shares, the total cost would be ₹360).
- Cost to Buy the Put Option: ₹2.60 per share (total cost ₹260).
By comparing these options and their open interest, you can make a more informed decision on whether to buy or sell the options based on your market expectations and risk tolerance.
1.6 What are FII/DII?

FIIs refer to foreign entities or institutions that invest in Indian financial markets, including equity, debt, and derivatives.
Key Features of FIIs in India:
- Entities: Mutual funds, pension funds, hedge funds, sovereign wealth funds, insurance companies, and banks.
- Investment Focus:
- Primarily focus on equity and debt markets.
- Look for high-growth opportunities in India’s emerging market economy.
- Regulation:
- FIIs must register with the Securities and Exchange Board of India (SEBI) to invest in Indian markets.
- They follow specific rules under the Foreign Portfolio Investment (FPI) framework, introduced in 2014 to simplify foreign investments.
- Impact:
- Market Movement: FII inflows boost market sentiment, while outflows often lead to corrections.
- Liquidity Provider: FIIs bring significant liquidity, aiding the depth and efficiency of Indian markets.
- Economic Influence: Their participation reflects global confidence in India’s economy.
Recent Trends:
- India has been a preferred destination for FIIs due to:
- Strong GDP growth.
- Favourable demographics.
- Policy reforms like GST and Make in India.
Domestic Institutional Investors (DIIs) in India
DIIs are institutional investors located in India that invest in the Indian financial markets.
Key Features of DIIs in India:
Entities:
- Insurance Companies: Life Insurance Corporation of India (LIC).
- Mutual Funds: SBI Mutual Fund, HDFC Mutual Fund.
- Banks: Investments in equity and debt instruments.
- Pension Funds: Employees’ Provident Fund Organisation (EPFO).
Role:
- DIIs help balance the market by stepping in during volatile periods when FIIs withdraw.
- They provide stability and long-term investment perspectives.
Regulation:
- Regulated by SEBI and other Indian regulatory bodies.
- Subject to domestic investment guidelines.
Impact:
- DIIs often focus on value investing and are less influenced by global macroeconomic factors compared to FIIs.
- They provide consistent support to the market, especially during bearish phases.
Recent Trends:
DIIs have increased their investments significantly in recent years due to:
- Rising participation in mutual funds (via SIPs – Systematic Investment Plans).
- Robust domestic savings culture.
- Government reforms encouraging institutional investments.
Comparison: FII vs. DII in India
|
Aspect |
FIIs |
DIIs |
|
Origin |
Foreign entities investing in Indian markets |
Domestic institutions investing locally |
|
Influence |
Heavily influenced by global factors |
Driven by domestic economic conditions |
|
Regulator |
SEBI (under FPI framework) |
SEBI and Indian regulatory bodies |
|
Market Role |
Provide liquidity, can cause volatility |
Stabilize markets, counterbalance FIIs |
|
Examples |
BlackRock, Vanguard Group |
LIC, SBI Mutual Fund |
Why FII/DII Activity is Important in India
- Market Sentiment:
- FII inflows are often seen as a sign of global investor confidence in India.
- DII activity reflects domestic confidence in the economy and stock markets.
- Currency Impact:
- Large FII inflows strengthen the Indian Rupee (INR), while outflows can weaken it.
- DII investments have minimal direct currency impact but stabilize market sentiment.
- Policy Implications:
- FIIs react quickly to changes in global interest rates, inflation, or geopolitical tensions.
- DIIs remain relatively stable, reflecting domestic growth and reform potential.
Example in India’s Markets
- FII Activity: During the 2020 COVID-19 pandemic, FIIs withdrew heavily from Indian markets due to global uncertainty. However, by 2021, they returned with massive investments as India’s recovery gained traction.
- DII Activity: DIIs, especially mutual funds, absorbed the selling pressure during FII outflows by purchasing equities, stabilizing the market during the crisis.
How to Track FII/DII in India
- Daily Activity Reports: Stock exchanges like NSE and BSE release daily FII/DII net purchase/sale data.
- SEBI Data: Regular updates on FII registrations and inflows/outflows.
- Market Trends: Analysts often track FII/DII movements to predict market trends and sentiment.
Understanding FII and DII activity helps investors make informed decisions, particularly in volatile or uncertain market conditions.
1.7 The India VIX (Volatility Index)
The India VIX (Volatility Index) is a measure of the expected volatility in the Indian stock market over the near term. It is often referred to as the “fear gauge” of the Indian markets because it reflects the market’s expectations of future volatility. A higher VIX value indicates higher market uncertainty and potential price swings, while a lower value suggests stability and lower price fluctuations.
Key Features of India VIX
- Introduced by NSE:
- India VIX was introduced by the National Stock Exchange (NSE) in 2008.
- It is based on the implied volatility (IV) of NIFTY 50 options.
- Implied Volatility:
- IV represents the market’s expectation of the magnitude of price movements in the NIFTY 50 index, not the direction.
- A higher IV implies larger expected price swings, while a lower IV suggests smaller movements.
- Calculation:
- The index uses the Black-Scholes model to compute volatility based on the bid and ask prices of out-of-the-money (OTM) NIFTY 50 options.
- India VIX is expressed as an annualized percentage.
How India VIX Works
High VIX:
- Indicates market participants expect significant price fluctuations in the NIFTY 50 index.
- Common during periods of uncertainty, such as economic crises, geopolitical tensions, or major policy announcements.
Low VIX:
- Suggests market participants expect stability with limited price movement.
- Seen during periods of economic growth or market confidence.
Key Components of India VIX Calculation
- NIFTY 50 Options Data: Based on options contracts with a maturity of near one month and far one month.
- Option Premium: Uses bid-ask prices of options contracts.
- Out-of-the-Money (OTM) Options: Focuses on options where the strike price is either above (for calls) or below (for puts) the current NIFTY 50 level.
The formula for India VIX involves:
- Weighting the implied volatilities of these options contracts.
- Aggregating them to derive a single volatility figure.
India VIX and Market Sentiment
High India VIX:
- Indicates market fear or uncertainty.
- Associated with bearish market phases, corrections, or crises.
Low India VIX:
- Reflects confidence and optimism among investors.
- Associated with bullish trends or stable market conditions.
Significance of India VIX
- Market Forecasting: Helps traders and investors gauge market sentiment and prepare for potential price swings.
- Risk Management: Aids in hedging portfolios during volatile periods by identifying heightened risk.
- Trading Decisions: A key tool for options traders, as options pricing is directly influenced by volatility.
Interpreting India VIX Values
|
India VIX Value |
Market Interpretation |
|
<15 |
Low volatility; stable market. |
|
15-25 |
Moderate volatility; potential swings. |
|
>25 |
High volatility; uncertain or risky market. |
Calculation of India VIX
India VIX is calculated using the Black-Scholes model, which takes into account several factors:
- Implied Volatility: The market’s forecast of future volatility based on current option prices.
- Bid-Ask Quotes: The best bid and ask prices for near and next-month NIFTY options.
- Forward Index Level: The expected future value of the NIFTY index.
- Interest Rates: The risk-free interest rate, typically the yield on short-term government bonds.
- Time to Expiry: The time remaining until the expiration of the options, calculated in minutes for accuracy.
The formula for India VIX is:
Applications of India VIX
- Risk Management: Investors can use India VIX to assess market risk and adjust their portfolios accordingly.
- Options Trading: Traders can use India VIX to price options more accurately and identify potential trading opportunities.
- Market Sentiment: India VIX provides insights into market sentiment, helping investors understand whether the market is in a bullish or bearish phase.
1.8 What are multi leg strategies detailed explanation
Multi-leg strategies are options trading strategies that involve the simultaneous purchase and sale of multiple options contracts. These strategies can be used to take advantage of market conditions, manage risk, and potentially increase profitability. Here’s a detailed explanation:
What Are Multi-Leg Strategies?
Multi-leg strategies involve executing at least two options transactions in a single order. These transactions can involve different expiration dates, strike prices, or underlying assets. By combining multiple options, traders can create complex strategies that offer various benefits, such as reduced commissions, lower margin requirements, and the ability to hedge against market volatility.
Types of Multi-Leg Strategies
There are several common multi-leg strategies that traders use:
- Straddle: This strategy involves buying a call and a put option with the same strike price and expiration date. It is used when a trader expects significant price movement but is unsure of the direction.
- Strangle: Similar to a straddle, but the call and put options have different strike prices. This strategy is also used when significant price movement is expected, but the direction is uncertain.
- Butterfly Spread: This strategy involves buying and selling options at three different strike prices, all with the same expiration date. It is used when a trader expects little price movement.
- Iron Condor: This strategy involves four options contracts: buying a put and a call at a lower strike price and selling a put and a call at a higher strike price. It is used when a trader expects low volatility.
- Box Spread: This strategy involves buying and selling options at two different strike prices and two different expiration dates. It is used to take advantage of mispriced options.
Benefits of Multi-Leg Strategies
- Cost Efficiency: By combining multiple options into a single order, traders can save on commissions and margin requirements.
- Risk Management: Multi-leg strategies can help hedge against market volatility and reduce potential losses.
- Flexibility: These strategies allow traders to tailor their trades to specific market conditions and expectations.
Example Scenario
Suppose a trader expects significant price movement in a stock but is unsure of the direction. They could use a straddle strategy by buying a call option and a put option with the same strike price and expiration date. If the stock price moves significantly in either direction, the trader can profit from the increased value of one of the options.
Multi-leg strategies are powerful tools for options traders, offering flexibility, risk management, and cost efficiency. By understanding and implementing these strategies, traders can better navigate the complexities of the options market and potentially increase their profitability.
1.1.What is FnO 360 all about??
FnO 360 is a specialized trading platform designed by 5paisa for derivatives trading, including futures and options (F&O)
Key Features
- Advanced Analysis Tools: FnO 360 provides real-time market data and multiple tools to help traders analyze the market effectively. This includes open interest analysis, powerful screeners, and strategy charts.
- Elegant Orderbook and Position book: The platform offers quick access to orderbooks and position books, ensuring fast order confirmations and trade execution.
- Comprehensive Market Data: Users can view charts powered by Trading View and ChartIQ, providing real-time price plots and detailed market data.
- Advanced Option Chain Functionality: FnO 360 offers different viewing modes for the option chain, including Price, Open Interest (OI), Straddle, and Greeks.
- Convenient Order Placement: The platform includes features like quick rollovers, reverse conversions, and bulk order placement for high-volume trades.
- One-Click Strategies: Users can place advanced complex strategies with just one click, gaining visibility into maximum profit, loss, and other critical data points.
- Automated Strategies: FnO 360 allows users to turn their derivative strategies into automated strategies with defined entry and exit parameters.
Benefits
- Informed Trading Decisions: With real-time data and advanced tools, traders can make more informed decisions.
- Efficient Trade Execution: The platform ensures lightning-fast trading and easy trade execution.
- Customization: Users can customize their watchlists and access a range of features tailored to derivatives trading
Who can access FnO360 ?
FnO360 can be accessed by existing customers of 5Paisa who have a Demat account by following two easy steps:
- Log in to your 5paisa account with the help of relevant credentials
- Click on the FnO360 option located in the top right corner
How to access FnO360?
It is very easy to access the FnO360, let me take you through it step by step-
- Login to the 5paisa web Trading platform
- You’ll see the “FnO360” button on the top right side of the screen
- Click on that button
- By clicking, you’ll be directed to a new window that allows you to navigate easily on the FnO360 domain, designed specifically for the derivative traders.
To analyze the market on FnO360 within the 5Paisa web portal, you can take advantage of various integrated tools that offer extensive coverage and up-to-date information on the derivatives market. Here’s a thorough overview:
Option Chain: Examine all existing options contracts for a particular security, covering strike prices, premiums, open interest, and additional details.
Option chain is also known as Mini Option chain. It has three sections
- Nifty
- Bank Nifty
- Finnifty
The Price section has three more options in the drop down
- Open Interest
- Straddle
- Greeks
- Open Interest Analysis:
- OI Evaluation: Analyze open interest information to gain insights into market trends.
- Multiple Strike OI: Examine open interest at various strike prices.
- Aggregate OI: Obtain a unified perspective of open interest data.
- Max Pain: Determine the level at which option writers face the greatest loss.
- FnO Stats:
- FnO Activity: Monitor price gainers/losers, open interest gainers/losers, long/short buildup, long unwinding, and short covering.
- FnO Screener: Apply filters to pinpoint specific trading opportunities based on different parameters.
- Heatmap: A graphical depiction of market movements and trends.
- MWPL BanList: Keep an eye on securities that have surpassed the market-wide position limit.
- Futures Intraday Buildup: Provide insights into intraday activities for futures.
- Index Contributors: Evaluate stock contributions to index performance.
- Volatility vs Indices: Assess volatility data in relation to index performance.
- F&O Momentum: Visual representation of live market momentum, showing the number of stocks trading positively or negatively and in what range.
- FII-DII Activity
- If you click on expand section you will get detailed analysis of FIIs and DIIs
- Track the trading activity of Foreign Institutional Investors (FIIs) and Domestic Institutional Investors (DIIs), which are key market drivers.
- These tools provide precise, real-time information, helping traders analyse the market efficiently and make informed trading decisions.
How do you create a basket and add orders to a basket in FnO360?
Here’s how to craft your basket and add perfect orders in FnO360:
Navigate to the Basket Section and select the New Basket in the top left corner.
How do you access the basket orders in FnO360?
Using basket orders is a convenient way to execute multiple orders across segments. Every order is subjected to an RMS evaluation, and only those that pass the inspection will be submitted to the exchange. Any order that does not satisfy the placement requirements will be declined. You can find the basket orders by exploring the 5Paisa platform. Simply go to the bottom menu and select baskets. A new window will appear for the basket area, allowing you to view all the available baskets. You have the flexibility to create, modify, and remove baskets as you wish.
How many watchlists can I create on FnO360?
You can access a total of 5 watchlists and three customizable watchlists on FnO360.
The watchlists can be accessed on the FnO360 platform anytime. To access the watchlist on FnO360, navigate to the bottom menu and click on a watchlist.
The watchlist on 5Paisa is synced across all the platforms, making it accessible to all created watchlists.
In what segments can a user trade using FnO360?
FnO360 is not only limited to features and options (F&O). Here’s a list of available trading segments for 5paisa users:
- Equity (NSE and BSE)
- Mutual Funds
- Futures and Options (NSE and BSE)
- Currency Derivatives
- Commodity Derivatives
What is the List of documents required for activating FNO/derivative segment?
After your account is activated, if you’d like to enable the FNO or derivative segment, you’ll need to provide financial proof.
To activate the segment, follow these steps:
Via the App:
- Log in to the 5paisa App.
- Go to Menu > My Profile.
- Click on Modify in the top-right corner.
- Select Segment Details > Add Segment.
Via the Web:
- Log in to the 5paisa website.
- Navigate to Menu > My Profile > Segment Details.
- Click on Add Segment.
After clicking Add Segment, select your income range and submit the required financial proof.
Note: Some users may only need to select an income range. Based on internal criteria, we may auto-approve certain segment modification requests.
In other cases, financial proof will be required, which can be submitted through the following methods:
Submission Options:
- Online Upload (Auto Fetch Bank Statement):
The user will be redirected to a third-party page where they can select their bank. Bank statements for the last 6 months will be automatically fetched. - Offline Upload:
The user can choose one document from the list:
- Latest Income Tax Return (ITR)
- Bank Statement (last 6 months)
- Demat Holdings (last 6 months)
- Salary Slip
- Net Worth Certificate
- Copy of Form 16
- Copy of Annual Accounts
- Fixed Deposit (INR 50,000 or above).
1.2.What are Smart Strategies in FnO 360 Platform?
Smart Strategies is a tool that allows users to create their strategies and automate their execution. With this, you can execute your options strategy with pre-defined entry and exit parameters. The word pre-defined means that strategies can be tailored before their execution, where before entering into trades you get to put your desired premium and exit by placing Target/Stop Loss to make the most of your trade.
Following are the parameters that you require to fill in to create your strategies-
- Search for the name of your favourite script.
- Select from Pre-defined Strategies or create your own Strategy.
- Specify the desired premium that you want the strategy to execute for that particular strategy (if the said strategy does not meet the requirement, orders will not be placed).
- Specify exit parameters such as target price and trailing stop loss(the best feature to limit your loss)
- Then you can check your submitted strategy in the Strategy P&L section.
How is it beneficial for the users?
Not only do the Smart Strategies in options executes the strategy, but it also gives a brief about it, like you can check the Payoff Graphs, Futures Chart, Greeks, and P&L, including the position summary such as Margin requirements, breakeven ranges, premium to be received, etc.
Investing becomes a cup of tea when you know the exact trend. Similarly, predefined strategies will only work when you analyze the market and then use the strategies such as straddles, strangles, bull call spreads, etc. to increase the probability of profit.
Here are a few Smart Strategies and features to help you analyze the market before you trade-
- Predefined Strategies– Pre-defined strategies are designed in a way that makes it easy for you to get the readymade build strategy at your fingertip. Here, the customer has the choice of following the same strategy or customizing it.
- Payoff Graphs– Payoff Graphs are profit and loss charts that show the risk/reward profile of an option or combination of options, based on which you can decide on going ahead with the script or not.
- Futures Charts-For a consolidated view and to avoid stock risk, futures charts will give you an overview of the ongoing market trend for the selected index/stock.
- Greeks– The option Greeks are the variables that show how the premium and price movements are related and determine how to measure the future changes in the scrip/index.
- P&L Graphs-You can get an immediate response to the trade’s risks and rewards by looking at these graphs.
- Breakeven Ranges-The breakeven range helps you in analyzing whether you will make a profit with the breakeven point range.
- Margin Requirements-The dashboard will show you the margin requirement to execute the order strategy beforehand.
- Trade Premium-You can determine the probable premium that you will receive on options trades while placing the strategy.
- Strategy Desired Premium– This feature will help you define entry based on the combined premium of strategy.
- Strategy Exit Parameters-The strategy exit parameters help in auto square off of the complete strategy. You can define Fixed Target or Stoploss for the entire strategy. You can also trail your profit/loss by either value or percentage using the Trail By mechanism.
Path to find Smart Strategies on the 5paisa web portal-
- Log in to the 5paisa portal.
- Tap on the FnO 360 button appearing in the upper right corner
- Tap on the Strategies icon from the navigation bar located on the left side of your screen
- Now, you can customize or use the predefined strategy for your options trading
In options trading, smart strategies include defined entry and exit parameters and techniques such as covered calls, protective puts, and iron condors. These strategies optimise performance by continually refining approaches and managing risks. The benefits of smart strategies include increased efficiency, effectiveness, and adaptability to changing market conditions, leading to better-informed decision-making and improved overall outcomes.
Where can you find Smart Strategy on 5paisa?
The access path to Smart Strategies on 5paisa web portal is as follows:
- Log in to the 5paisa
- Tap on the FnO 360 button appearing in the upper right corner.
- Tap on the Strategies icon from the navigation bar located on the left side of your screen.
- Now, you can customise or use the predefined Smart Strategy for trading options.
Which strategy can be executed using Smart Strategies?
5paisa offers you the flexibility to choose from two options with Smart Strategies:
- Predefined Strategies :5paisa provides a selection of predefined strategies that you can readily deploy.
- Custom Strategies: You can also create your own custom strategy based on your preferences. Once you’ve built your strategy, you can execute the trades directly on the 5paisa FnO 360 portal.
What is Desired Premium section in Smart Strategies?
The “Desired Premium” section within Smart Strategies allows you to define the specific price point (premium) at which you want your strategy to enter a trade. Your strategy orders will only be placed when the market premium reaches your desired level.
What does the Exit Parameters section entail on the Smart Strategies platform?
The “Exit Parameters” section on the Smart Strategies platform enables you to establish exit criteria for your strategy.
Here are several tips you can configure using exit parameters:
- Target Prices Indicate the profit targets at which you wish to close your positions.
- Stop-Loss Orders Set your stop-loss thresholds to automatically exit your trades if the market moves unfavourably.
- Trailing Stop-Loss (Optional) Use a trailing stop-loss to adjust your stop-loss price in response to favourable market movements. This method helps secure profits while minimizing potential losses.
What happens if you submit the strategy after-market hours via Smart Strategies?
After you submit strategies after the market closes, the following will take place:
- Activation of Your strategy will become operational the next day at 9:15 am, assuming you are logged into Smart Strategies. If you are not logged in at that time, the strategy will activate the next time you log in.
- Order Placement once your strategy is operational, it will automatically execute orders based on the entry and exit criteria you have set.
- Market Orders If your strategy specifies “market orders” for entry, the trades will be executed right when the market opens at 9:15 am.
Note: Submitting after hours means your strategy may miss advantageous entry points that could arise before the market opens at 9:15 am.
What would happen if you missed logging in for positional strategy?
If you neglect to log in to Smart Strategies while a positional strategy is ongoing, you can anticipate the following outcomes:
- No Orders Executed Your strategy will not automatically initiate new orders for entering or exiting positions if you’re not logged in, even if your specified entry or exit criteria are satisfied.
- Active Existing Positions Any existing positions initiated by the strategy will remain active. However, you will have to manually close (square off) these positions if your exit criteria are met.
- New Strategies Needed If your initial strategy did not enter a position due to your absence, you will need to formulate a new strategy to commence the trade.
Keep in mind: Regular logins ensure that your Smart Strategies can carry out your trading plan efficiently.
Is it possible to manually oversee the deals made using Smart Strategies?
Order placement is automated by the Smart Strategies according to your specified specifications. Knowing how manual involvement may affect your trades is crucial:
Mismanagement of Trade
- Changing trades made by Smart Strategies by hand, like squaring off a long position, may have unforeseen repercussions.
- Depending on your initial settings, the strategy may still carry out its own exit logic, which could result in redundant or contradicting commands.
Suggested Method
- 5paisa advises managing open positions started by Smart Strategies through the platform’s specified “square-off” tool (if available) in order to prevent these issues.
- For optimum efficiency, it is therefore usually ideal to let Smart Strategies handle trades in accordance with your specified specifications without requiring human interaction.
Is it possible to change the approach using Smart Strategies once it has been placed?
Smart Strategies are adaptable. In actuality, even after submitting your approach, you are free to modify its exit settings. Additionally, it lets you adjust your trailing stop settings, stop-loss levels, and profit objectives as necessary.
Note: Once the strategy has been placed, it is not possible to change the entry parameters (such as the price points at which trades are initiated). You must remove the current strategy and develop a new one with the required changes if you need to alter the entry requirements.
Is it possible to halt the Strategy?
Yes, you can choose to put your 5paisa Smart Strategy on hold. Even if your specified requirements are satisfied, the strategy will become inactive once you pause it and won’t execute any more entry or exit orders. If market conditions change or you need to modify your trading plan, it will enable you to temporarily stop the strategy’s activity.
Are you able to continue the Strategy?
A previously halted Smart Strategy can indeed be reactivated. Following your return, your strategy will be active once again and you will start keeping an eye on market circumstances to find entry and exit chances within the parameters you have set.
What if you don’t have sufficient margin in the account?
If you attempt to execute a trade through a Smart Strategy but your account lacks sufficient margin, 5paisa will then reject the trade and notify you with an “insufficient margin” message.
Monitoring Strategy Logs
To view a history of your Smart Strategy activity, click on the “History” icon on the Strategy P&L page on the 5paisa platform. Any rejected trades due to margin issues will help you identify any margin shortfalls that might be preventing your strategies from executing as planned.
It is important to maintain an adequate margin in your account to avoid trade rejections and potential disruptions to your Smart Strategies. Please consider reviewing your margin requirements and available balance before deploying your strategies.
Where can you see the trades placed via Smart Strategies?
You can see the trades placed by your smart strategies in two ways:
- Order Book Look for the trades within the 5paisa platform’s order book. It will be identified with a special tag (like “ss”) indicating they were initiated by a Smart Strategy.
- Strategy P&L Page It is a dedicated page on 5paisa platform that provides a detailed breakdown of your Smart Strategy performances. You can find records of all trades executed by the strategy on this page.
Where can You see strategy P&L?
There are two convenient ways to monitor the profit or loss (P&L) of your Smart Strategies:
- Strategy P&L Page
The Strategy P&L Page is a dedicated page within the 5paisa platform that offers real-time P&L information specific to your strategy’s performance. It provides a clear view of your strategy’s activity and current profitability.
- 5paisa Net Position Tab
Web Platform
- Log in to the 5paisa website and navigate to the “Orders & Positions” section from the left-hand menu.
- Then, click on “Positions” to access your overall position overview.
Your Smart Strategy’s P&L will be displayed alongside your other holdings.
- Mobile App
- Access the “Ideas Section” within the 5paisa mobile app.
- Navigate to “Advanced Strategies” and select the “Manage or Live Strategy” link.
It will display your Smart Strategy’s dedicated P&L information.
What if You don’t have sufficient margin in the account?
If you attempt to execute a trade through a Smart Strategy but your account lacks sufficient margin, 5paisa will then reject the trade and notify you with an “insufficient margin” message.
Monitoring Strategy Logs
To view a history of your Smart Strategy activity, click on the “History” icon on the Strategy P&L page on the 5paisa platform. Any rejected trades due to margin issues will help you identify any margin shortfalls that might be preventing your strategies from executing as planned.
Recommendation
It is important to maintain an adequate margin in your account to avoid trade rejections and potential disruptions to your Smart Strategies. Please consider reviewing your margin requirements and available balance before deploying your strategies.
1.3.Understanding Open Interest
Open Interest (OI) is a critical concept in the derivatives market, representing the total number of outstanding contracts—futures or options—that remain active and unsettled. It serves as a key indicator of market activity and provides traders, investors, and analysts with valuable insights into market trends, liquidity, and sentiment. To understand OI in depth, it is essential to explore its definition, how it is calculated, its relationship with volume and price, its implications for market trends, and its practical applications.
Open Interest is important for both stock futures traders as well as options traders. This section gives you a fair idea of the statistically unique parameter in the derivatives segment. OI has been integrated with the form of graphs, using which a user can analyze the market movement based on the investor’s interest.
Definition and Nature of Open Interest
In simple terms, Open Interest refers to the cumulative number of derivative contracts that are currently open in the market. A derivative contract, whether a future or an options contract, is an agreement between two parties: a buyer and a seller. For OI, each contract is counted once, regardless of how many times it has been traded. OI measures the total number of active positions rather than the number of participants or trades.
Unlike trading volume, which resets to zero at the start of each trading session and measures the number of contracts traded during a given period, OI is a running tally. It increases when new contracts are created and decreases when existing contracts are closed. This ongoing nature makes OI a dynamic and evolving metric that reflects the cumulative interest of market participants in a particular derivative.
How Open Interest is Calculated
Understanding the calculation of Open Interest involves grasping the dynamics of contract creation and closure:
- Increase in Open Interest: When a new buyer and seller create a contract, OI increases by one. For instance, if a trader takes a long position, and another trader takes the corresponding short position, a new contract is added to OI.
- Decrease in Open Interest: When an existing buyer and seller close their positions, OI decreases. For example, if a trader holding a long position sells to a trader who closes their short position, the contract is removed from OI.
- No Change in Open Interest: If a contract is transferred between participants, OI remains unchanged. For instance, when a trader sells a long position to another trader entering a long position, the contract persists without affecting OI.
By summing these changes over time, OI provides a snapshot of the total number of active contracts at any given point.
Open Interest vs. Trading Volume
Although Open Interest and trading volume are related, they measure different aspects of market activity. Trading volume captures the number of contracts traded within a specific time frame, such as a day, and resets daily. In contrast, OI reflects the total outstanding contracts and accumulates over time. Volume can be high in a session, yet OI might not change significantly if most trades involve existing contracts being closed or transferred.
The interplay between OI and volume offers valuable insights:
- High Volume with Increasing OI: Indicates the formation of new contracts, signalling growing market participation.
- High Volume with Decreasing OI: Suggests liquidation of positions, indicating reduced interest in maintaining positions.
- Low Volume with Flat OI: Reflects a lack of new participation or hesitation among traders.
Open Interest and Price Trends
Analyzing OI in conjunction with price trends provides critical information about market behaviour and sentiment. The relationship between price movement and OI changes can indicate the strength and direction of a trend:
- Rising OI with Price Increase: Indicates bullish sentiment as new participants enter long positions, supporting the upward trend.
- Rising OI with Price Decrease: Reflects bearish sentiment as more traders enter short positions, reinforcing the downward trend.
- Falling OI with Price Increase: Suggests short covering rather than fresh buying, potentially indicating a weakening bullish trend.
- Falling OI with Price Decrease: Indicates position liquidation rather than new selling, possibly signalling an end to the bearish trend.
- Flat OI with Price Movement: Suggests indecision or low conviction among market participants, often preceding a consolidation phase.
By interpreting these patterns, traders can identify opportunities and anticipate potential reversals or continuations of trends.
Role of Open Interest in Market Analysis
Open Interest is a vital tool for market analysis, offering insights into market liquidity, participation, and sentiment. Here are some of its key roles:
- Liquidity Indicator:
High OI is associated with greater liquidity, making it easier for traders to enter or exit positions without significant price impact. Liquid markets are typically more efficient and attract more participants.
- Market Participation Gauge:
Rising OI indicates increased participation and interest in the market. Conversely, declining OI suggests waning interest or a lack of new participants.
- Trend Confirmation:
OI trends can confirm the strength or weakness of price movements. For instance, rising OI alongside an upward price trend signals strong bullish sentiment and trend sustainability.
- Sentiment Analysis:
OI provides insights into whether traders are predominantly bullish or bearish. A surge in OI during a price decline indicates growing bearish sentiment, while increasing OI during a price rise signals bullish confidence.
Example of Open Interest
|
Day |
Starting Open Interest |
Trading Volume |
New Contracts Opened |
Contracts Closed |
Ending Open Interest |
|
Day 1 |
500 |
100 |
60 |
40 |
520 |
|
Day 2 |
520 |
150 |
100 |
50 |
570 |
|
Day 3 |
570 |
200 |
80 |
120 |
530 |
|
Day 4 |
530 |
180 |
60 |
120 |
470 |
|
Day 5 |
470 |
220 |
160 |
60 |
570 |
Explanation:
- Day 1:
- Starting Open Interest: 500 contracts.
- Trading Volume: 100 contracts (60 new, 40 closed).
- Ending Open Interest: 500 + 60 – 40 = 520 contracts.
- Day 2:
- Starting Open Interest: 520 contracts.
- Trading Volume: 150 contracts (100 new, 50 closed).
- Ending Open Interest: 520 + 100 – 50 = 570 contracts.
- Day 3:
- Starting Open Interest: 570 contracts.
- Trading Volume: 200 contracts (80 new, 120 closed).
- Ending Open Interest: 570 + 80 – 120 = 530 contracts.
- Day 4:
- Starting Open Interest: 530 contracts.
- Trading Volume: 180 contracts (60 new, 120 closed).
- Ending Open Interest: 530 + 60 – 120 = 470 contracts.
- Day 5:
- Starting Open Interest: 470 contracts.
- Trading Volume: 220 contracts (160 new, 60 closed).
- Ending Open Interest: 470 + 160 – 60 = 570 contracts.
Practical Applications of Open Interest
Traders and analysts use Open Interest as part of their decision-making process to gain a deeper understanding of market dynamics. Some practical applications include:
- Identifying Breakouts: Rising OI with significant price movement can signal the start of a strong trend. For example, increasing OI during a price breakout from a consolidation phase confirms fresh participation.
- Detecting Reversals: Declining OI with sustained price movement may indicate trend exhaustion, warning traders of potential reversals.
- Assessing Market Sentiment: By analyzing OI trends, traders can gauge whether the market is predominantly bullish or bearish, aiding in sentiment-based strategies.
- Evaluating Risk: High OI in a particular contract or strike price may indicate concentrated positions, which could lead to volatility during sharp price movements.
Limitations of Open Interest
While OI is a valuable metric, it has its limitations and should be used in conjunction with other indicators:
- Lagging Indicator: OI changes are reported at the end of the trading session, making it a lagging indicator of real-time market activity.
- Context Dependency: OI’s significance varies across markets and instruments. For instance, high OI in equity options may not have the same implications as in commodity futures.
- Not a Standalone Metric: Relying solely on OI can lead to incomplete conclusions. Combining it with volume, price action, and other technical indicators provides a more comprehensive analysis.
1.4 Back testing Open Interest (OI) analysis for algorithmic strategies
Back testing Open Interest (OI) analysis for algorithmic strategies involves simulating how the strategy would have performed in the past based on historical Open Interest data, along with other relevant market data like price and volume. Here’s a structured approach to conducting back testing for OI-based strategies:
-
Define the Objective
Strategy Description: Clearly outline the hypothesis or strategy you wish to test. For example:
- A rise in OI coupled with price increase signals bullish sentiment.
- A drop in OI with price rise suggests short covering.
Metrics to Measure: Decide on performance metrics such as profit/loss, Sharpe ratio, win rate, drawdown, etc.
-
Gather Historical Data
- Open Interest Data: Obtain historical OI data for your chosen instruments (e.g., futures or options).
- Market Data: Collect historical price data (open, high, low, close) and volume data.
Granularity: Choose the data frequency (e.g., daily, hourly, or minute-wise) based on your strategy.
-
Data Preprocessing
- Align Data: Ensure OI, price, and volume data are synchronized with the same timestamps.
- Filter Data: Remove anomalies like missing values or errors.
Create Indicators: Derive necessary indicators, such as:
- OI change percentage.
- Price change percentage.
- Implied Volatility (if options are involved).
-
Implement the Strategy Logic
Code your strategy’s entry and exit conditions based on OI signals. For example:
- Long Entry: If OI increases by more than 10% and price rises by 2% within a given period.
- Short Entry: If OI decreases by more than 10% while price falls by 2%.
- Exit: Define clear stop-loss, target, or trailing conditions.
-
Simulate Trades
Use historical data to simulate trades based on the strategy logic.Track:
- Entry and exit points.
- Profit and loss per trade.
- Cumulative returns.
-
Evaluate Results
Analyze the backtested performance:
- Metrics: Calculate total returns, average return per trade, win/loss ratio, maximum drawdown, etc.
- Visualization: Plot equity curves, OI trends with prices, and PnL over time for better insights.
-
Optimize Parameters
- Adjust thresholds like OI or price change percentages to optimize performance.
- Use techniques like grid search or genetic algorithms for optimization.
-
Validate the Strategy
- Test the strategy on out-of-sample data to ensure it performs well on unseen data.
- Perform a walk-forward analysis to test its adaptability over different market conditions.
-
Risk Management
- Incorporate position sizing and risk management rules to reduce the likelihood of large losses.
- Consider transaction costs, slippage, and liquidity constraints in your calculations.
1.5 What are Options Chain
An options chain is a listing of all available option contracts for a particular underlying asset, such as a stock, index, or commodity. It provides crucial information that traders and investors use to make informed decisions about their option trading strategies. Let’s delve into the details of an options chain and its components:
Components of an Options Chain
- Underlying Asset: This is the asset for which the options are being traded. It could be a stock, index, ETF, commodity, or currency.
- Option Type:
- Call Options: These give the holder the right (but not the obligation) to buy the underlying asset at a specified price (strike price) before or on the expiration date.
- Put Options: These give the holder the right (but not the obligation) to sell the underlying asset at a specified price before or on the expiration date.
- Expiration Date: This is the date on which the option contract expires. Options can have various expiration dates, such as weekly, monthly, or quarterly.
- Strike Price: The strike price is the predetermined price at which the underlying asset can be bought (call option) or sold (put option) if the option is exercised.
- Premium: The premium is the price paid by the buyer of the option to the seller. It consists of two components: intrinsic value and time value.
- Bid and Ask Prices:
- Bid Price: The highest price a buyer is willing to pay for the option.
- Ask Price: The lowest price a seller is willing to accept for the option.
- Open Interest: This represents the total number of outstanding option contracts that have not been settled or closed. It indicates the level of market activity and interest in a particular option.
- Implied Volatility (IV): Implied volatility is a measure of the market’s expectations for the future volatility of the underlying asset. Higher IV generally indicates higher premiums and vice versa.
- Volume: This shows the number of option contracts traded during a specific period, usually the trading day.
How to Read an Options Chain
An options chain typically appears in a tabular format with calls and puts listed side by side. Here’s an example of how an options chain might look:
Using an Options Chain for Trading
- Identifying Opportunities: An options chain helps traders identify potential trading opportunities based on their market outlook, desired risk level, and investment strategy.
- Evaluating Premiums: Traders can compare premiums across different strike prices and expiration dates to find the best value for their options trades.
- Analyzing Open Interest and Volume: High open interest and volume indicate active interest in a particular option, which can be a sign of a liquid market and potentially more favourable trading conditions.
- Assessing Implied Volatility: By analyzing implied volatility, traders can gauge market expectations and adjust their strategies accordingly. For example, higher IV might indicate a good opportunity for selling options due to higher premiums.
- Strategy Selection: Based on the information in the options chain, traders can choose from various options strategies, such as buying calls or puts, selling covered calls, or constructing more complex strategies like spreads and straddles.
Example Scenario
Let’s say you are considering trading options for a stock currently priced at ₹100. You analyze the options chain and find the following:
- Call Option with a Strike Price of ₹100: Bid ₹3.50, Ask ₹3.60, OI 1200.
- Put Option with a Strike Price of ₹100: Bid ₹2.50, Ask ₹2.60, OI
With an expiration date of January 21, 2025, and an implied volatility of 20%, you can evaluate the following:
- Cost to Buy the Call Option: ₹3.60 per share (since each option contract represents 100 shares, the total cost would be ₹360).
- Cost to Buy the Put Option: ₹2.60 per share (total cost ₹260).
By comparing these options and their open interest, you can make a more informed decision on whether to buy or sell the options based on your market expectations and risk tolerance.
1.6 What are FII/DII?
FIIs refer to foreign entities or institutions that invest in Indian financial markets, including equity, debt, and derivatives.
Key Features of FIIs in India:
- Entities: Mutual funds, pension funds, hedge funds, sovereign wealth funds, insurance companies, and banks.
- Investment Focus:
- Primarily focus on equity and debt markets.
- Look for high-growth opportunities in India’s emerging market economy.
- Regulation:
- FIIs must register with the Securities and Exchange Board of India (SEBI) to invest in Indian markets.
- They follow specific rules under the Foreign Portfolio Investment (FPI) framework, introduced in 2014 to simplify foreign investments.
- Impact:
- Market Movement: FII inflows boost market sentiment, while outflows often lead to corrections.
- Liquidity Provider: FIIs bring significant liquidity, aiding the depth and efficiency of Indian markets.
- Economic Influence: Their participation reflects global confidence in India’s economy.
Recent Trends:
- India has been a preferred destination for FIIs due to:
- Strong GDP growth.
- Favourable demographics.
- Policy reforms like GST and Make in India.
Domestic Institutional Investors (DIIs) in India
DIIs are institutional investors located in India that invest in the Indian financial markets.
Key Features of DIIs in India:
Entities:
- Insurance Companies: Life Insurance Corporation of India (LIC).
- Mutual Funds: SBI Mutual Fund, HDFC Mutual Fund.
- Banks: Investments in equity and debt instruments.
- Pension Funds: Employees’ Provident Fund Organisation (EPFO).
Role:
- DIIs help balance the market by stepping in during volatile periods when FIIs withdraw.
- They provide stability and long-term investment perspectives.
Regulation:
- Regulated by SEBI and other Indian regulatory bodies.
- Subject to domestic investment guidelines.
Impact:
- DIIs often focus on value investing and are less influenced by global macroeconomic factors compared to FIIs.
- They provide consistent support to the market, especially during bearish phases.
Recent Trends:
DIIs have increased their investments significantly in recent years due to:
- Rising participation in mutual funds (via SIPs – Systematic Investment Plans).
- Robust domestic savings culture.
- Government reforms encouraging institutional investments.
Comparison: FII vs. DII in India
|
Aspect |
FIIs |
DIIs |
|
Origin |
Foreign entities investing in Indian markets |
Domestic institutions investing locally |
|
Influence |
Heavily influenced by global factors |
Driven by domestic economic conditions |
|
Regulator |
SEBI (under FPI framework) |
SEBI and Indian regulatory bodies |
|
Market Role |
Provide liquidity, can cause volatility |
Stabilize markets, counterbalance FIIs |
|
Examples |
BlackRock, Vanguard Group |
LIC, SBI Mutual Fund |
Why FII/DII Activity is Important in India
- Market Sentiment:
- FII inflows are often seen as a sign of global investor confidence in India.
- DII activity reflects domestic confidence in the economy and stock markets.
- Currency Impact:
- Large FII inflows strengthen the Indian Rupee (INR), while outflows can weaken it.
- DII investments have minimal direct currency impact but stabilize market sentiment.
- Policy Implications:
- FIIs react quickly to changes in global interest rates, inflation, or geopolitical tensions.
- DIIs remain relatively stable, reflecting domestic growth and reform potential.
Example in India’s Markets
- FII Activity: During the 2020 COVID-19 pandemic, FIIs withdrew heavily from Indian markets due to global uncertainty. However, by 2021, they returned with massive investments as India’s recovery gained traction.
- DII Activity: DIIs, especially mutual funds, absorbed the selling pressure during FII outflows by purchasing equities, stabilizing the market during the crisis.
How to Track FII/DII in India
- Daily Activity Reports: Stock exchanges like NSE and BSE release daily FII/DII net purchase/sale data.
- SEBI Data: Regular updates on FII registrations and inflows/outflows.
- Market Trends: Analysts often track FII/DII movements to predict market trends and sentiment.
Understanding FII and DII activity helps investors make informed decisions, particularly in volatile or uncertain market conditions.
1.7 The India VIX (Volatility Index)
The India VIX (Volatility Index) is a measure of the expected volatility in the Indian stock market over the near term. It is often referred to as the “fear gauge” of the Indian markets because it reflects the market’s expectations of future volatility. A higher VIX value indicates higher market uncertainty and potential price swings, while a lower value suggests stability and lower price fluctuations.
Key Features of India VIX
- Introduced by NSE:
- India VIX was introduced by the National Stock Exchange (NSE) in 2008.
- It is based on the implied volatility (IV) of NIFTY 50 options.
- Implied Volatility:
- IV represents the market’s expectation of the magnitude of price movements in the NIFTY 50 index, not the direction.
- A higher IV implies larger expected price swings, while a lower IV suggests smaller movements.
- Calculation:
- The index uses the Black-Scholes model to compute volatility based on the bid and ask prices of out-of-the-money (OTM) NIFTY 50 options.
- India VIX is expressed as an annualized percentage.
How India VIX Works
High VIX:
- Indicates market participants expect significant price fluctuations in the NIFTY 50 index.
- Common during periods of uncertainty, such as economic crises, geopolitical tensions, or major policy announcements.
Low VIX:
- Suggests market participants expect stability with limited price movement.
- Seen during periods of economic growth or market confidence.
Key Components of India VIX Calculation
- NIFTY 50 Options Data: Based on options contracts with a maturity of near one month and far one month.
- Option Premium: Uses bid-ask prices of options contracts.
- Out-of-the-Money (OTM) Options: Focuses on options where the strike price is either above (for calls) or below (for puts) the current NIFTY 50 level.
The formula for India VIX involves:
- Weighting the implied volatilities of these options contracts.
- Aggregating them to derive a single volatility figure.
India VIX and Market Sentiment
High India VIX:
- Indicates market fear or uncertainty.
- Associated with bearish market phases, corrections, or crises.
Low India VIX:
- Reflects confidence and optimism among investors.
- Associated with bullish trends or stable market conditions.
Significance of India VIX
- Market Forecasting: Helps traders and investors gauge market sentiment and prepare for potential price swings.
- Risk Management: Aids in hedging portfolios during volatile periods by identifying heightened risk.
- Trading Decisions: A key tool for options traders, as options pricing is directly influenced by volatility.
Interpreting India VIX Values
|
India VIX Value |
Market Interpretation |
|
<15 |
Low volatility; stable market. |
|
15-25 |
Moderate volatility; potential swings. |
|
>25 |
High volatility; uncertain or risky market. |
Calculation of India VIX
India VIX is calculated using the Black-Scholes model, which takes into account several factors:
- Implied Volatility: The market’s forecast of future volatility based on current option prices.
- Bid-Ask Quotes: The best bid and ask prices for near and next-month NIFTY options.
- Forward Index Level: The expected future value of the NIFTY index.
- Interest Rates: The risk-free interest rate, typically the yield on short-term government bonds.
- Time to Expiry: The time remaining until the expiration of the options, calculated in minutes for accuracy.
The formula for India VIX is:
Applications of India VIX
- Risk Management: Investors can use India VIX to assess market risk and adjust their portfolios accordingly.
- Options Trading: Traders can use India VIX to price options more accurately and identify potential trading opportunities.
- Market Sentiment: India VIX provides insights into market sentiment, helping investors understand whether the market is in a bullish or bearish phase.
1.8 What are multi leg strategies detailed explanation
Multi-leg strategies are options trading strategies that involve the simultaneous purchase and sale of multiple options contracts. These strategies can be used to take advantage of market conditions, manage risk, and potentially increase profitability. Here’s a detailed explanation:
What Are Multi-Leg Strategies?
Multi-leg strategies involve executing at least two options transactions in a single order. These transactions can involve different expiration dates, strike prices, or underlying assets. By combining multiple options, traders can create complex strategies that offer various benefits, such as reduced commissions, lower margin requirements, and the ability to hedge against market volatility.
Types of Multi-Leg Strategies
There are several common multi-leg strategies that traders use:
- Straddle: This strategy involves buying a call and a put option with the same strike price and expiration date. It is used when a trader expects significant price movement but is unsure of the direction.
- Strangle: Similar to a straddle, but the call and put options have different strike prices. This strategy is also used when significant price movement is expected, but the direction is uncertain.
- Butterfly Spread: This strategy involves buying and selling options at three different strike prices, all with the same expiration date. It is used when a trader expects little price movement.
- Iron Condor: This strategy involves four options contracts: buying a put and a call at a lower strike price and selling a put and a call at a higher strike price. It is used when a trader expects low volatility.
- Box Spread: This strategy involves buying and selling options at two different strike prices and two different expiration dates. It is used to take advantage of mispriced options.
Benefits of Multi-Leg Strategies
- Cost Efficiency: By combining multiple options into a single order, traders can save on commissions and margin requirements.
- Risk Management: Multi-leg strategies can help hedge against market volatility and reduce potential losses.
- Flexibility: These strategies allow traders to tailor their trades to specific market conditions and expectations.
Example Scenario
Suppose a trader expects significant price movement in a stock but is unsure of the direction. They could use a straddle strategy by buying a call option and a put option with the same strike price and expiration date. If the stock price moves significantly in either direction, the trader can profit from the increased value of one of the options.
Multi-leg strategies are powerful tools for options traders, offering flexibility, risk management, and cost efficiency. By understanding and implementing these strategies, traders can better navigate the complexities of the options market and potentially increase their profitability.