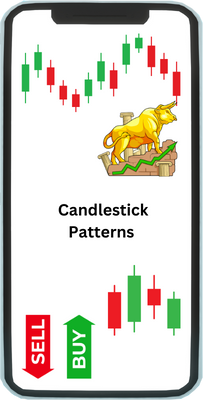
4.1 Introduction To Candlestick Patterns
Candlestick patterns and chart reading form the foundation of technical analysis, offering traders a visual language to interpret market behavior. Each candlestick captures the battle between buyers and sellers within a specific time frame, revealing shifts in momentum, sentiment, and potential turning points. Unlike plain numbers, candlesticks bring price action to life, showing not just where the market moved, but how it moved. When read in sequence, these patterns become powerful signals that help traders anticipate future price movements with greater confidence.
Chart reading, on the other hand, is the art of understanding the bigger picture. It involves analyzing trends, support and resistance levels, volume, and time frames to make informed decisions. By combining candlestick patterns with broader chart structures, traders can spot opportunities, manage risks, and refine their strategies.
4.2 History Tends to Repeat Itself
Understanding the Power of Repeating Patterns
One of the cornerstone beliefs in technical analysis is this: history tends to repeat itself. This isn’t just a catchy phrase, it’s a guiding principle that helps traders interpret price movements and candlestick patterns with confidence.
Let’s explore this idea through a new example.
Scenario: 12th November 2025
Imagine a stock named Kaveri Electronics listed on the Indian stock exchange. Over the last few trading sessions, here’s what’s been happening:
- Factor 1: The stock has been declining consistently for four straight sessions.
- Factor 2: On the fifth day (12th Nov 2025), the stock continues to fall, but the trading volume is noticeably lower than the previous days.
- Factor 3:The price range, the difference between the high and low is narrower than usual, indicating reduced volatility.
These three factors together suggest that the selling pressure might be losing steam.
Now, on the sixth day (13th Nov 2025), the stock opens flat but closes higher, forming a bullish candlestick. This signals a potential reversal, as buyers seem to be regaining control.
Fast Forward: February 2026
A few months later, Kaveri Electronics shows the same setup again:
- Four days of decline
- Low volume on the fifth day
- Tight price range
Based on the earlier outcome, a trader might reasonably expect a bullish move on the sixth day, because the market has responded this way before under similar conditions.
4.3 Market Psychology Behind Candlesticks

Bullish vs. bearish sentiment
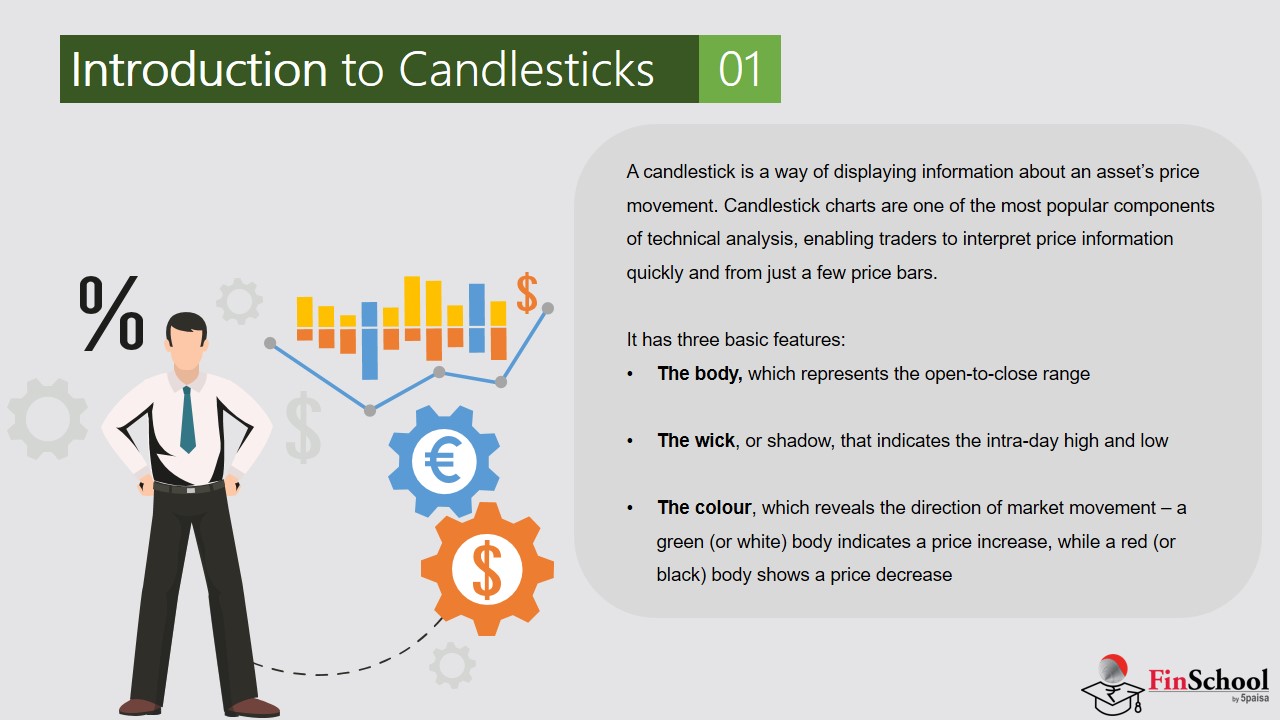
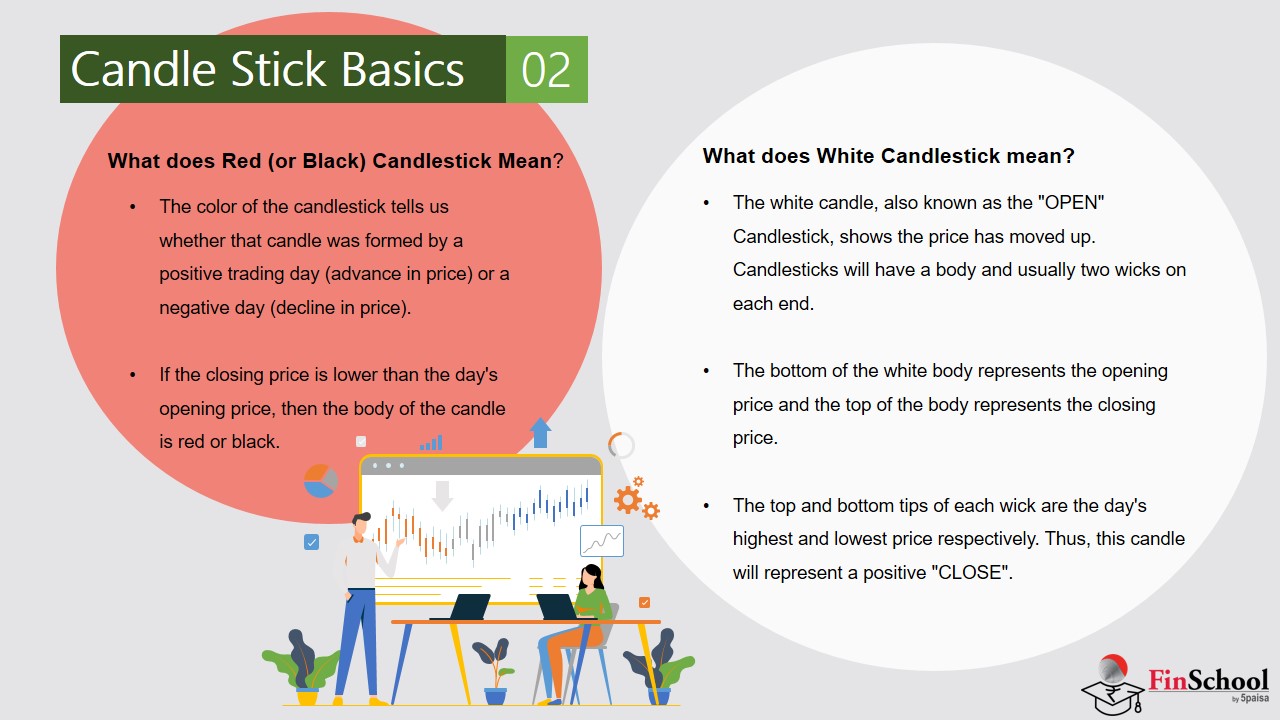
Candlestick charts don’t just show price changes, they tell a story about how buyers and sellers are feeling. Each candle shows who had more control during that time: buyers or sellers. A bullish candle means buyers were stronger, they pushed the price up from where it started to where it ended. This shows people were confident and willing to pay more. A bearish candle means sellers were in charge, they pushed the price down, showing fear or caution.
The size and shape of the candle also matter. A big candle body means there was strong movement and clear direction. Small bodies suggest indecision. The thin lines above and below the candle (called wicks) show how high or low the price went during that time. Long wicks mean prices moved a lot but didn’t stay there, while short wicks mean prices stayed close to the open and close.
Interpreting price rejection and volatility
One of the clearest signs of market emotion in candlestick charts is price rejection, which shows up as long wicks (also called shadows). A candle with a long lower wick means sellers tried to push the price down, but buyers came in strongly and pulled it back up before the session ended. This often suggests that there’s support at that lower level and the price might bounce back.
On the other hand, a long upper wick means buyers tried to push the price up, but sellers stepped in and dragged it back down. This usually points to resistance a level where the price struggles to go higher.
These patterns become even more meaningful when they happen near important price zones and are backed by high trading volume, which shows strong emotions and conviction behind the move.
Role of candlesticks in price action analysis
Candlesticks play a pivotal role in price action analysis, serving as the foundation for interpreting market behavior without relying on indicators. By studying the sequence, formation, and context of candlestick patterns, traders can identify potential reversals, continuations, and consolidation phases. For example, a series of strong bullish candles breaking through resistance may signal trend continuation, while a Doji or spinning top after a rally could suggest indecision and a possible reversal. Unlike lagging indicators, candlesticks provide real-time feedback on market sentiment, allowing traders to respond to evolving conditions with greater precision. When integrated with broader price structures such as support/resistance levels, trendlines, and volume candlestick analysis becomes a powerful tool for decoding the psychology that drives financial markets.
4.4 Assumptions in Candlestick Patterns
Before we begin exploring candlestick patterns, it’s important to understand a few key assumptions that form the foundation of candlestick analysis. These principles may not feel entirely intuitive at this stage, but they’ll become clearer as we move forward. Think of them as guiding rules that will help you interpret patterns more accurately. We’ll revisit and reinforce these ideas throughout the learning journey.
The first assumption is simple but powerful:
- Buy strength and sell weakness.
In candlestick terms, strength is represented by a bullish candle—typically shown in green, while weakness is shown by a bearish candle, often red. So, when you’re planning to buy, make sure the market is showing strength (a green candle day). Conversely, when you’re selling, look for signs of weakness (a red candle day). This approach helps align your trades with market momentum rather than going against it.
- Candlestick patterns require a bit of flexibility.
While textbooks may define patterns with strict criteria, real-world markets often present slight variations due to volatility and changing conditions. It’s okay to be flexible, but that flexibility must be quantified and verified. In other words, don’t blindly accept every variation as valid—use logic and supporting evidence to confirm whether the pattern still holds meaning. This mindset helps you adapt without losing analytical discipline.
- Lastly, always check the prior trendbefore interpreting a candlestick pattern.
Candlestick formations are typically reversal signals, which means they gain significance only when they appear after a clear trend. For example, a bullish reversal pattern should follow a downtrend, and a bearish reversal pattern should come after an uptrend. Without a preceding trend, the pattern may not carry much weight. Think of it like spotting a U-turn, you need to be moving in one direction before a reversal makes sense.
With these assumptions in mind, we’re ready to begin our journey into single candlestick patterns—the building blocks of price action analysis. Keep these principles close, as they’ll help you make sense of what the charts are really trying to tell you.
4.5 Types of Candlestick Chart Patterns
Candlestick patterns are visual representations of market psychology, formed by the interaction of price movements over specific time intervals. These patterns help traders interpret the balance of power between buyers and sellers, offering clues about potential reversals, continuations, or periods of indecision. By categorizing candlestick formations into single and multiple candle structures, analysts can systematically assess sentiment shifts and anticipate future price behavior. Understanding these types is essential for decoding price action and integrating candlestick analysis into broader trading strategies.
The study of candlestick patterns bridges technical structure with behavioral insight. Each pattern whether formed by a single candle or a sequence of multiple candles captures a narrative of market sentiment, momentum, and volatility. Traders rely on these formations to identify turning points, validate trends, and refine entry or exit decisions. Classifying candlestick patterns into reversal, continuation, and neutral categories allows for a structured approach to chart reading, making it easier to recognize high-probability setups across different market conditions.
Here’s a consolidated table that categorizes major candlestick chart patterns by their market implications. This format is designed for clarity and quick reference, especially useful in financial education or technical analysis modules:
|
Pattern Type |
Pattern Name |
Bullish / Bearish |
|
Single candlestick |
Marubozu |
Bullish or Bearish |
|
|
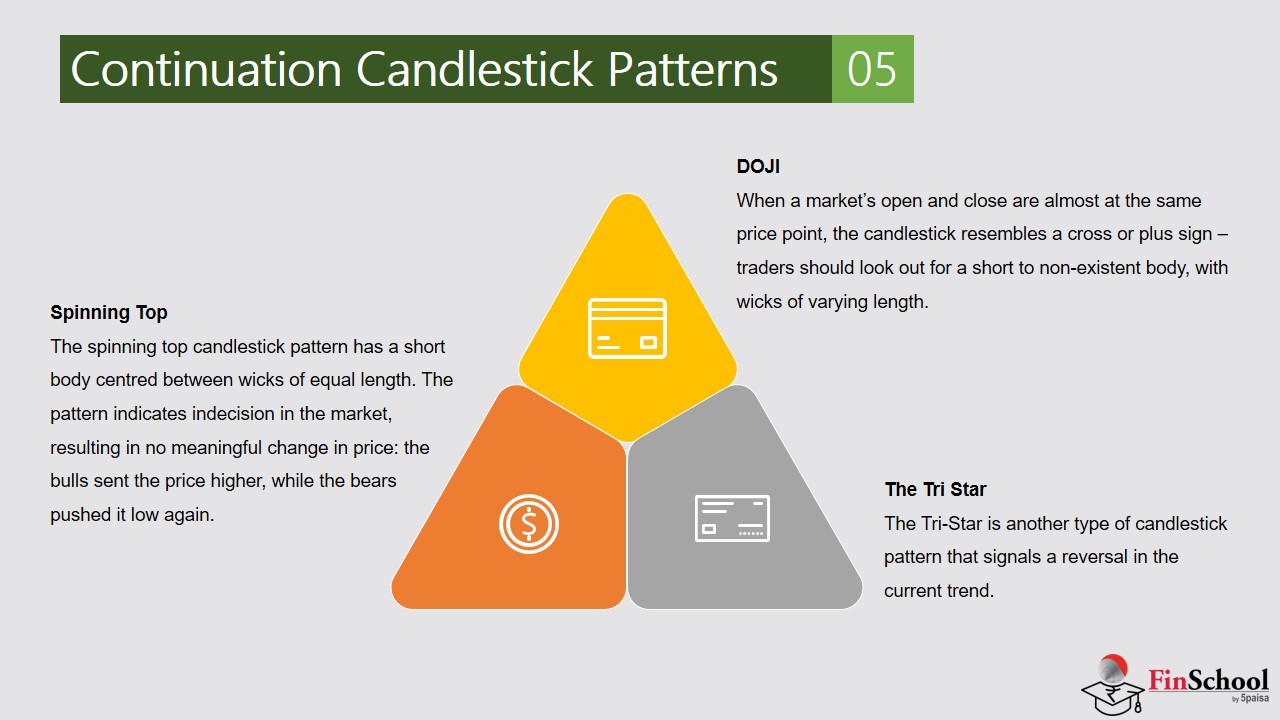
Doji |
Contextual |
|
|
Spinning Top |
Neutral / Contextual |
|
Paper Umbrella |
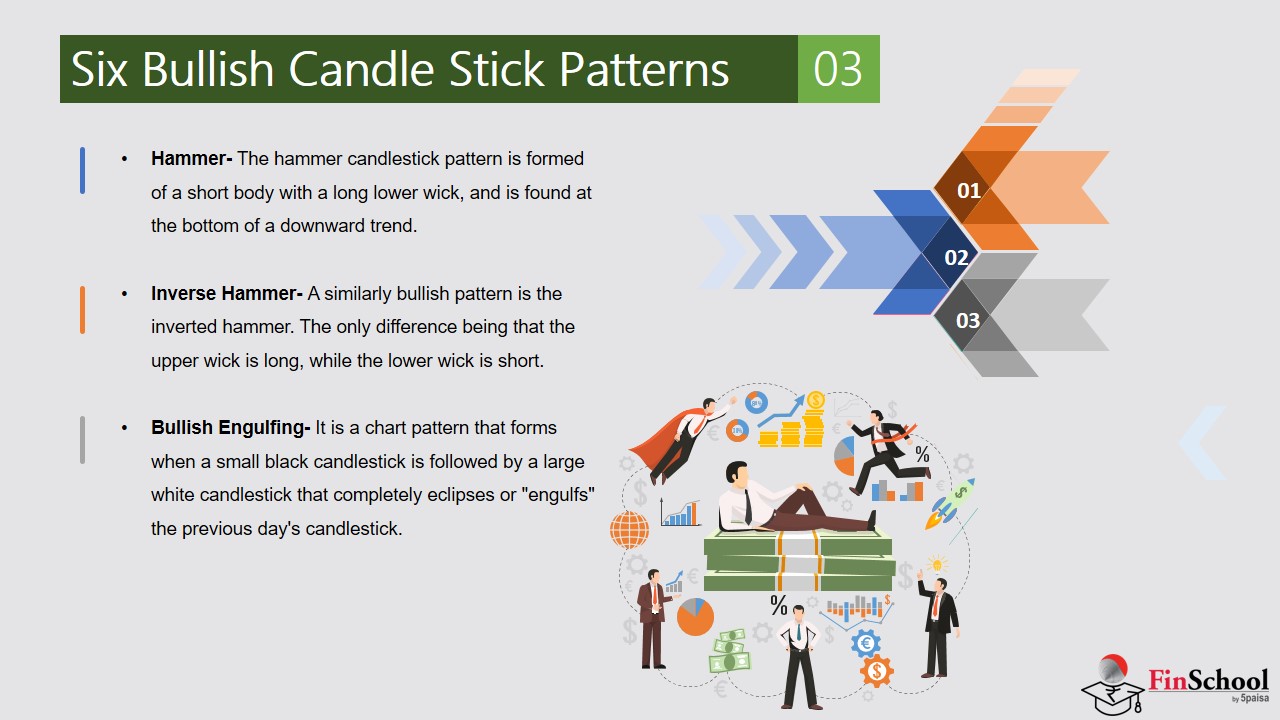
Hammer |
Bullish |
|
|
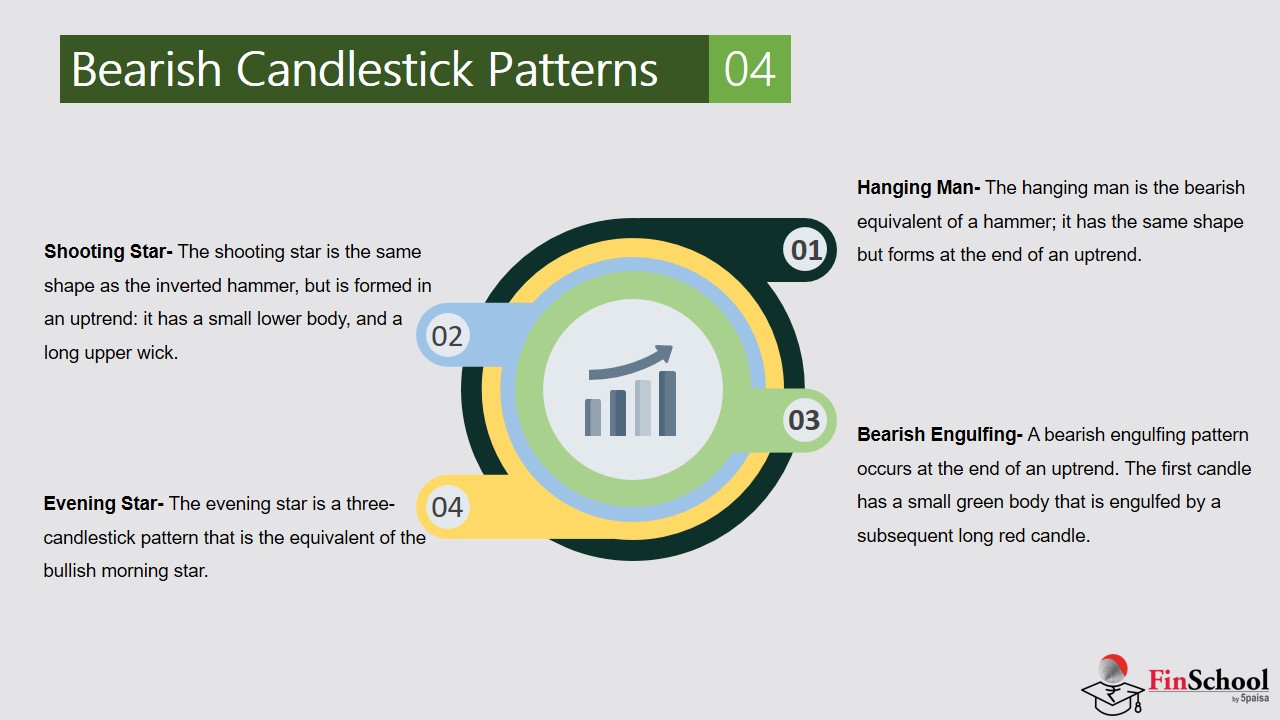
Hanging Man |
Bearish |
|
|
Shooting Star |
Bearish |
|
|
|
|
|
Multiple Candlestick |
Bullish Engulfing |
Bullish |
|
|
Bearish Engulfing |
Bearish |
|
|
Harami (Bullish/Bearish) |
Contextual |
|
|
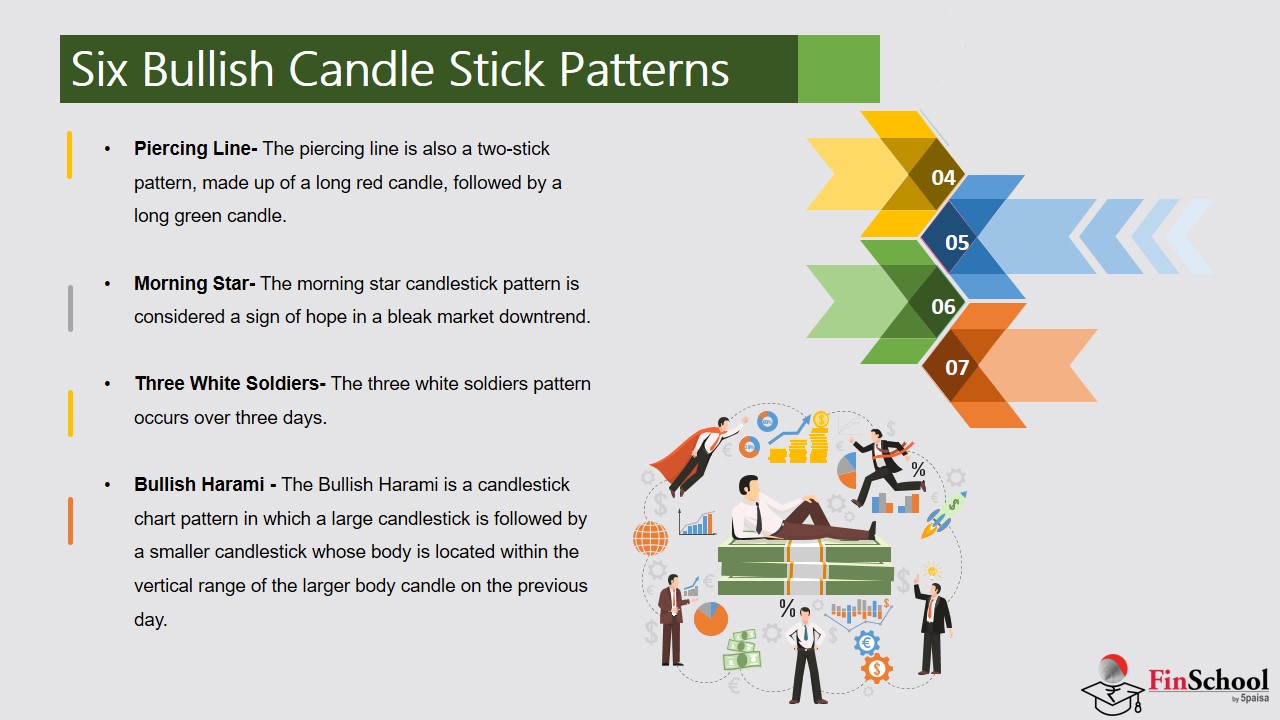
Piercing Pattern |
|
|
|
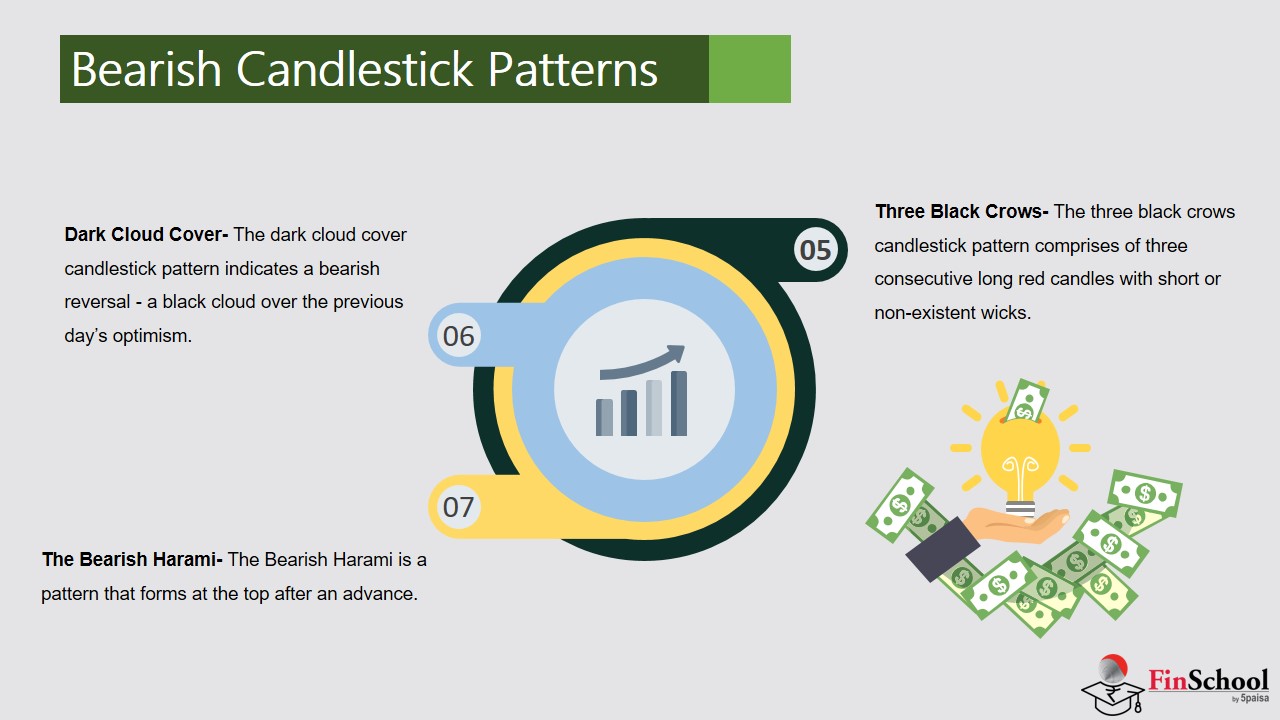
Dark Cloud Cover |
|
|
|
Morning Star |
|
|
|
Evening Star |
|
|
|
|
|
- Single candlestick patternsoften indicate quick sentiment shifts; their impact increases with supporting volume and trend context.
- Multiple candlestick patternsoffer stronger reversal or continuation signals due to cumulative price behavior.
- Contextualmeans that the meaning of the candlestick pattern depends on where it appears within the overall market trend or chart setup.
4.6 Key Takeaways

- Each candlestick captures the struggle between buyers and sellers within a specific timeframe, revealing shifts in momentum and sentiment.
- A bullish candle indicates that buyers were in control, pushing the price up, while a bearish candle shows sellers were dominant, pushing the price down.
- The size of the candle body and the length of its wicks are important. A large body signifies strong movement and a clear direction, whereas a small body suggests indecision. Long wicks indicate that prices moved significantly but were rejected, suggesting potential support or resistance.
- Candlestick formations, such as a Doji or spinning top, can signal indecision and a potential reversal after a rally.
- One key assumption is to “buy strength and sell weakness,” which means aligning trades with a bullish (green) candle for buying and a bearish (red) candle for selling.
- Always check the prior trend before interpreting a candlestick pattern, as reversal patterns are most significant when they follow a clear trend.
- Candlestick patterns are categorized into single and multiple candle structures. Single candle patterns, like the
- Hammer or Shooting Star, indicate quick sentiment shifts, while multiple candle patterns, such as the Bullish Engulfing or Morning Star, offer stronger signals due to cumulative price behavior.
- Chart reading involves understanding the bigger picture by analyzing trends, support and resistance levels, and volume to make informed decisions.
- Combining candlestick analysis with other elements like support and resistance zones, trendlines, and volume creates a powerful tool for decoding the psychology that drives financial markets