5.1 Single Candlestick Pattern

Single candlestick as the name suggests includes just one candlestick on a price chart, representing one trading session like one day, one hour, or even one minute. The term “candle” comes from its visual shape: it looks like a candle with a body (the open-close range) and lines called wicks or shadows (showing the highest and lowest prices). This one candle tells a short story about how buyers and sellers behaved during that session. Even though it’s only one, it can give important signals about market strength, weakness.
Lets understand Types of Single candlestick Patterns in detail
|
Single candlestick |
Pattern Name |
Bullish/Bearish |
|
|
Marubozu |
Bullish or Bearish |
|
|
Hammer |
Bullish |
|
|
Inverted Hammer |
Bullish |
|
|
Shooting Star |
Bearish |
|
|
Hanging Man |
Bearish |
|
|
Doji |
Neutral / Contextual |
|
|
Spinning Top |
Neutral / Contextual |
|
|
Paper Umbrella |
|
A Marubozu is a candlestick without an upper or lower shadow. A Marubozu candlestick has a large, lengthy body and hardly any shadows, making it difficult to miss. This sturdy body denotes a powerful movement in either an upward or downward direction. When a bullish (green/white) Marubozu forms, it means that the price rose steadily from the time it opened until it closed, trying to rise even higher.

A Marubozu candlestick is a strong visual signal on a price chart that reflects decisive market sentiment. It is characterized by a long body with no upper or lower shadows (wicks), meaning the price opened and closed at the extreme ends of the session.
There are two types:
- Bullish Marubozu: The candle opens at the low and closes at the high. This indicates that buyers were in control throughout the session, pushing prices steadily upward without any significant selling pressure.
- Bearish Marubozu: The candle opens at the high and closes at the low. This shows that sellers dominated the session, driving prices down consistently without much resistance from buyers.
What It Tells Traders
- A Marubozu reflects strong conviction either from buyers or sellers.
- It often appears at the start of a new trend or confirms the continuation of an existing one.
- The absence of wicks suggests that the market moved in one direction without hesitation.
5.2 Bullish Marubozu

A Bullish Marubozu occurs when the candle opens at its lowest point and closes at its highest. This indicates strong buying pressure, suggesting that bulls dominated the market throughout the session. Such a pattern is often seen as a sign of potential upward movement, especially when it appears after a downtrend or near a support level. Traders interpret this as a possible reversal or continuation of an uptrend. To manage risk, a common strategy is to place a stoploss just below the low of the Marubozu candle. If the price falls below this level, it suggests that bullish momentum has weakened, and the trade setup may no longer be valid.
For example

During the week of August 30, 2021, the Nifty 50 Index opened at 16,775.85 and closed strongly higher at 17,323.60, with the lowest point of the week being 16,764.85 and the highest reaching 17,340.10, forming a bullish Marubozu candle that reflected strong buying momentum and minimal selling pressure throughout the week. If you observe the candlestick pattern formed has tall green candle showing upward movement The candle is opened very close to the week’s lowest price and closed near the week’s highest price. And most importantly there are almost no wicks and the price moved upward without much fluctuation.
Now we will understand how a risk taker and risk averse trader take decision when bullish marubozu candlestick pattern is formed. Here we have explained the example with two character names Arjun and Aakash. Arjun is a bold, risk-taking trader, while Aakash prefers a cautious, risk-averse approach to the market.
In the above example the trade setup will be as follows
Buy price : 17323 and Stop-Loss will be 16764.85
On days when a bullish marubozu seems to be forming, he’s already preparing to act before the market closes. Around 3:20 PM, just ten minutes before the Indian markets close at 3:30 PM, Arjun checks two key conditions:
- whether the current market price is approximately equal to the day’s high
- and whether the opening price is roughly equal to the day’s low.
If both hold true, it’s a strong indication that buyers have dominated the session from start to finish, forming a classic bullish marubozu.
Unlike Arjun the risk taker, Aakash the risk-averse trader prefers confirmation over speed. He waits until the day after the bullish marubozu has formed before considering a buy. But even then, he doesn’t jump in impulsively. To stay aligned with the golden rule of trading buy on strength, sell on weakness, Aakash ensures that the following day is also bullish. Only if the candle is green and the price action supports continued upward momentum does he prepare to enter the trade, and even then, he waits until near the market close to finalize his decision.
This cautious approach comes with a trade-off. Since he’s buying a day later, the entry price is often significantly higher than the original marubozu close. But for Aakash, the peace of mind that comes from double confirmation outweighs the cost. He’s not chasing the move, he’s validating the trend. His strategy is built on patience, discipline, and the belief that strong trends deserve strong evidence.
Both traders follow the same principle, buy on strength but their personalities shape how they interpret and act on it. Arjun seeks early entry and maximum momentum, while Aakash values confirmation and reduced uncertainty, even if it means entering later. In this example, both have benefited, each in alignment with their unique trading psychology.
5.3 Stop-Loss in Bullish Marubozu

In the case of a bullish Marubozu pattern, the stop-loss plays a crucial role in protecting capital while allowing the trade room to develop. Since a Marubozu candle opens near the low and closes near the high with minimal shadows, it reflects strong buying momentum. However, momentum can reverse unexpectedly, so placing a strategic stop-loss is essential. In essence, the stop-loss acts as a safety net. It’s not a sign of doubt, it’s a sign of strategic clarity. Even in strong setups like a Bullish Marubozu, the market can surprise you. By anchoring the stop-loss below the candle’s low, the trader ensures that they exit only if the original bullish thesis is invalidated. This keeps emotions in check and capital intact, allowing for consistent decision-making across trades.
The most common and practical stop-loss level is just below the low of the Marubozu candle. This is because the low represents the point where buyers first stepped in. If the price falls below this level, it suggests that the bullish strength has failed.
For example
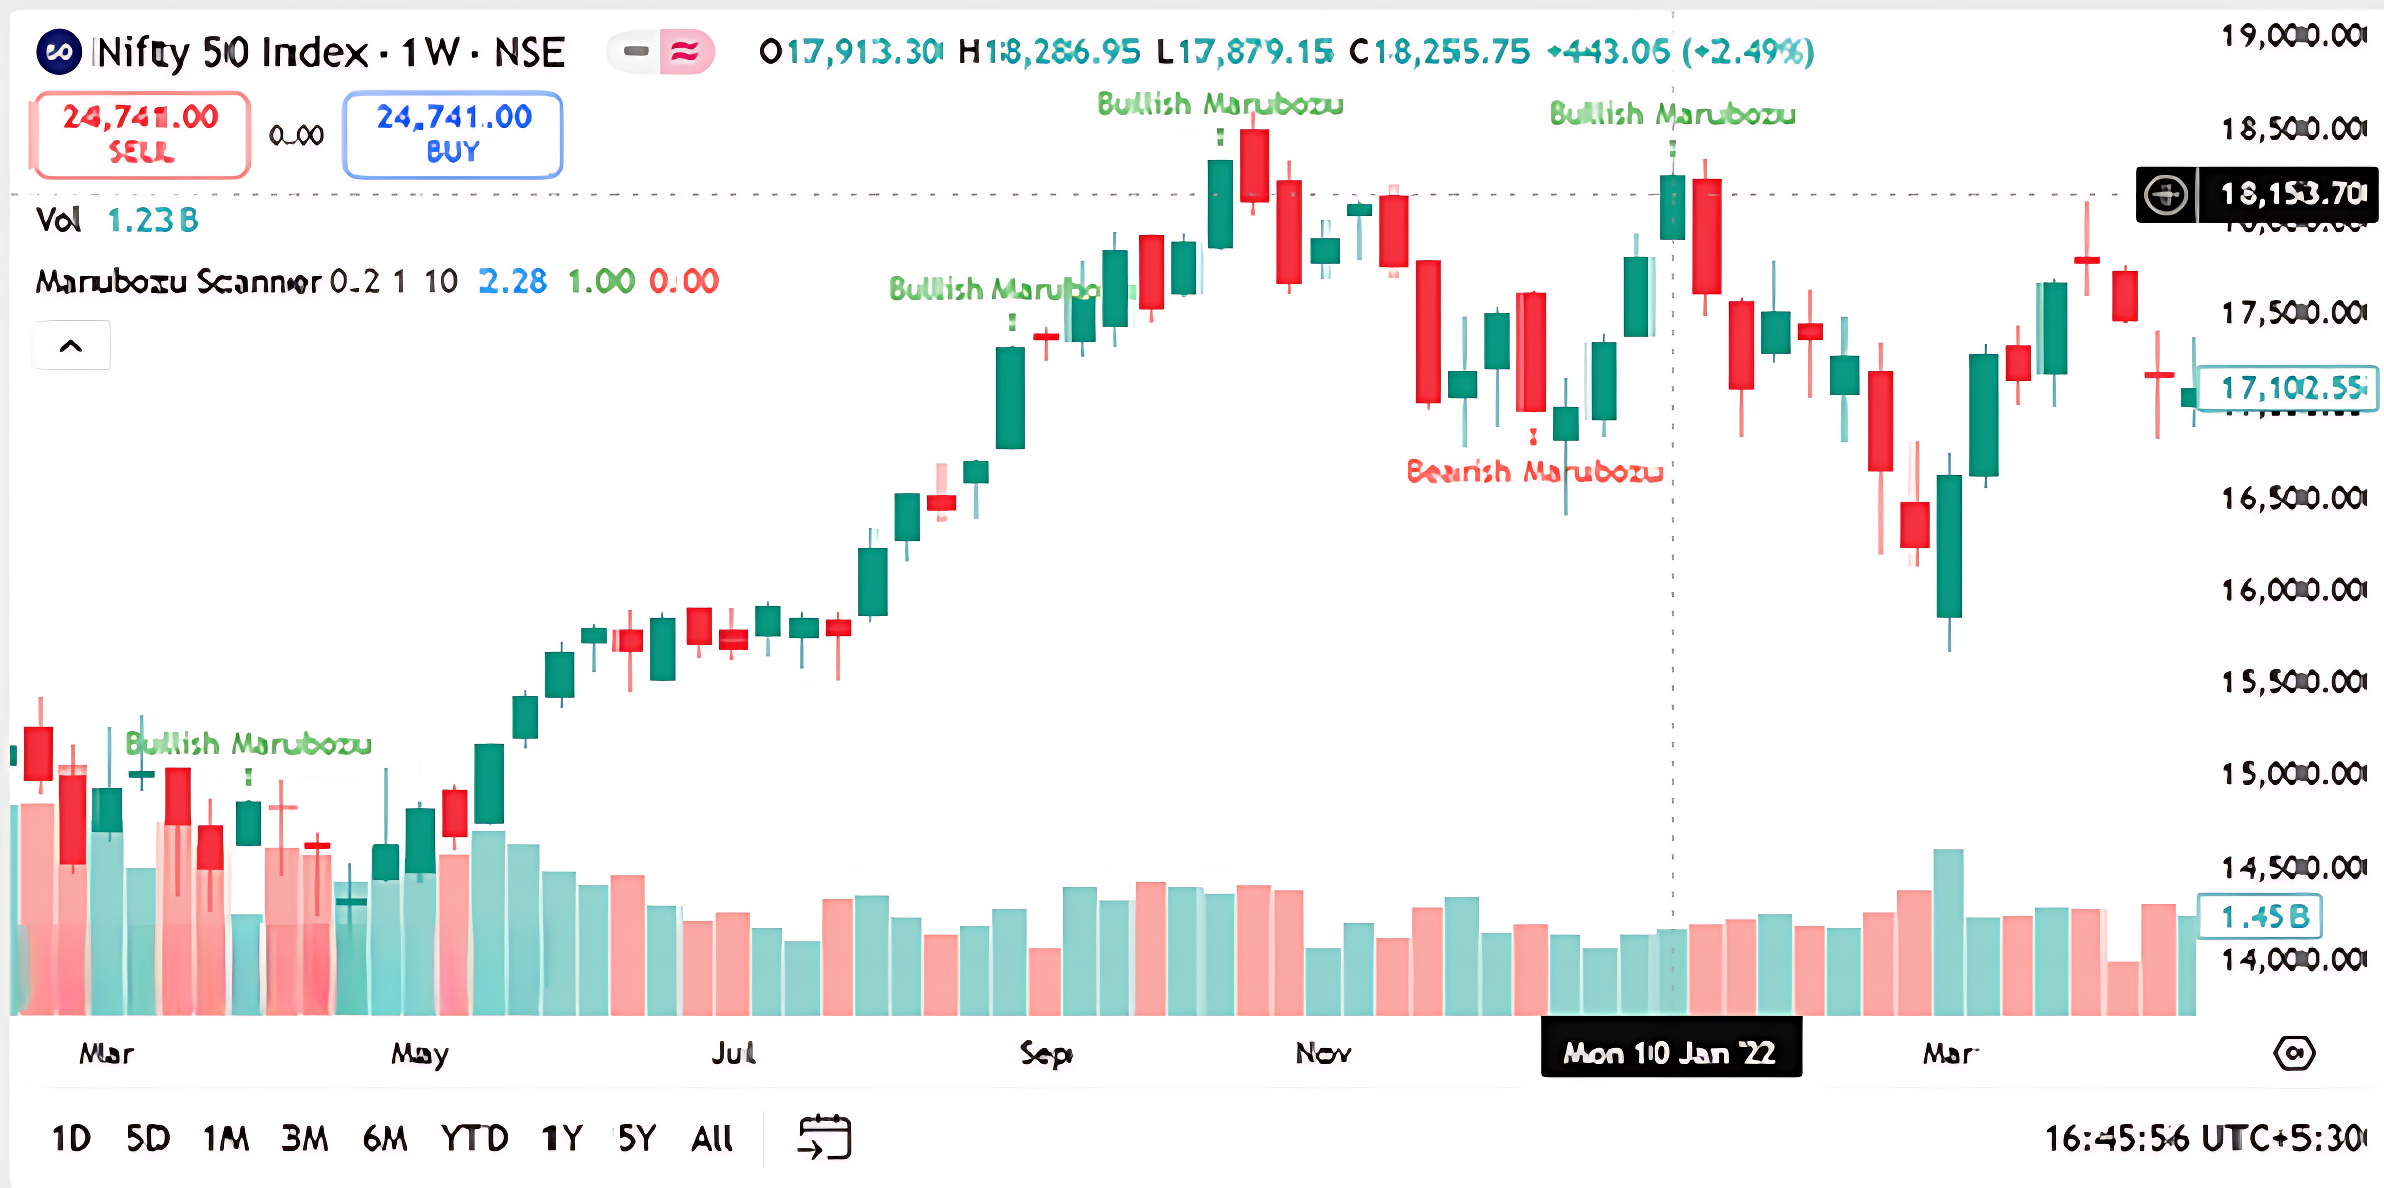
In the above example if you observe Even though a Bullish Marubozu formed on the weekly candle dated 10 January 2022, indicating strong buying momentum, the subsequent decline in prices can be attributed to broader market dynamics that overpowered the bullish signal. A Marubozu reflects conviction for that specific week, but it doesn’t guarantee sustained upward movement unless supported by follow-through candles, volume confirmation, and favorable macro conditions. In this case, while the candle showed strength, the market faced headwinds shortly after.
In the case of the Bullish Marubozu formed on the weekly candle dated 10 January 2022 on the Nifty 50 chart, the stop-loss should be placed just below the low of that candle, which is ₹17,879.15. This level represents the point where buyers showed the strongest defense during that week. If price falls below this low in the following sessions, it signals that the bullish momentum has likely failed and sellers are beginning to dominate.
In essence, the Bullish Marubozu was a strong signal, but it was not immune to external pressures. Traders who entered based on that candle would have needed to monitor subsequent price action closely. If the next few candles failed to make higher highs or showed weakening volume, it would have been a cue to tighten stop-losses or exit early. This scenario is a powerful teaching moment: candlestick patterns are context-sensitive, and their reliability increases when aligned with broader trend, volume, and sentiment.
Small Exercise for Your better Understanding
Here we have taken a chart of pattern of HDFC Bank Limited which shows past week data . Plot the Bullish marubozu chart pattern. Think yourself as risk taker and risk averse trader, and share what decision would you have taken if this pattern is formed?

Here is your answer to the question.

- The candle opens near the weekly low and closes near the weekly high.
- There are almost no wicks, meaning price didn’t stray far from the bullish path.
- This occurred after a sideways phase, suggesting a breakout or trend continuation.
What Traders Might Do
- Risk-taker : Here you Might enter near the close of the Marubozu week, placing a stop-loss just below the low.
- Risk-averse : Here you Wait for the next week to confirm bullish momentum before entering
5.4 Bearish Marubozu

A Bearish Marubozu is a strong single-candle pattern that reflects intense selling pressure and market pessimism. It forms when the price opens at the highest point of the session and closes at the lowest, with no upper or lower shadows, meaning sellers were in control from start to finish. This lack of hesitation suggests that buyers offered little to no resistance, allowing the price to decline steadily throughout the session. Traders often interpret a Bearish Marubozu as a signal of potential downward continuation or reversal, especially when it appears after a sustained uptrend or near a resistance level. The psychological message is clear: market participants are eager to exit long positions, and bears are gaining dominance. To manage risk, a stop loss is typically placed just above the high of the Marubozu candle, as a break above this level would invalidate the bearish sentiment. Like all candlestick patterns, its reliability increases when supported by volume and broader technical context, such as trendlines or key price zones.

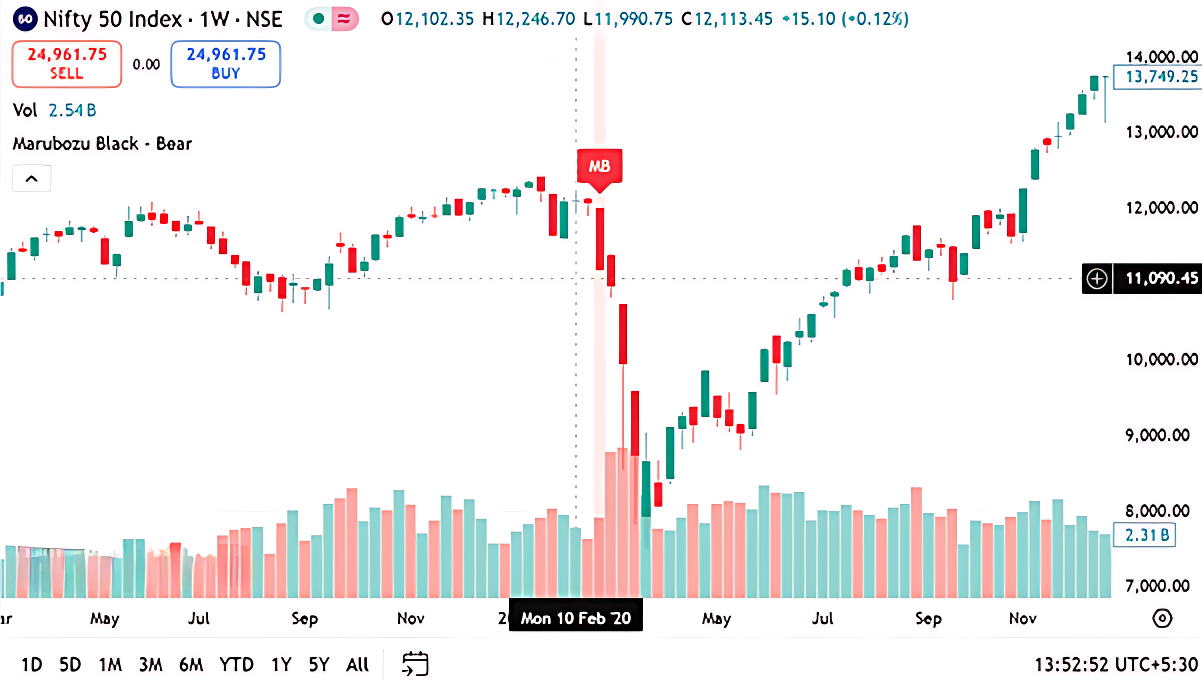
Now in this case if you observe 24th February 2020, the Nifty 50 Index formed a bearish Marubozu candlestick, a strong signal of downward momentum and selling pressure. This pattern is characterized by a long red body with little to no shadows, indicating that sellers were in control from the opening bell to the closing tick.
During this week, the index opened at 12012.55 and the highest point reached was 11201.75 which is almost the opening price. The lowest point reached was 11,175.05, and the index closed at 11,201.75, just above the low. This structure, where the open equals the high and the close is near the low, confirms the classic traits of a bearish Marubozu.
Such a candle reflects intense selling pressure, where buyers failed to push prices up at any point during the week. For traders, this signals a potential trend reversal or continuation of a bearish phase.
Now what will the risk taker and risk averse trader do in this situation? Lets understand from Arjun and Aakash
On the day the bearish Marubozu is forming, Arjun, the risk-taker, is already preparing to act. Around 3:20 PM, he checks whether the Current Market Price is approximately equal to the low of the day, and whether the opening price is close to the high of the day.
OHLC Data
Open: 12,102.35
High: 12,246.70
Low: 11,990.75
Close: 12,113.45
The trade on the bearish marubuzo would be to short approximately at 12,113.45 with a stoploss at the high point of the candle. In this case the stop-loss price is 12,246.70.
Arjun, the risk taker, prefers to act on the same day the bearish marubozu is forming. Around 3:20 PM, he checks two key conditions:
- Is the opening price approximately equal to day’s high
- Is the current market price approximately equal to day’s low
If both are true, the candle is shaping up as a bearish marubozu, and Arjun initiates a short position near the close, capitalizing on the momentum.
Aakash, the risk-averse trader, waits for confirmation. He holds off until the next day’s close, and only proceeds if the candle is red, indicating continued bearish sentiment. Around 3:20 PM, he validates the setup and enters the short trade, accepting a potentially less favorable price in exchange for greater certainty.
5.5 Stop Loss in Bearish Marubozu Candlestick pattern
In a bearish Marubozu candlestick pattern, the stop-loss acts as a protective barrier against unexpected reversals. This pattern is characterized by a candle that opens at the high and closes at the low, with little to no wicks—signaling strong selling pressure throughout the session. Traders who initiate short positions based on this setup typically place their stop-loss just above the high of the Marubozu candle, as a move beyond this level would invalidate the bearish momentum. For example in the above chart the stop loss should be placed at 12246.70.
Lets consider another example where bearish marubuzo pattern is formed which would have not worked out for the risk taker but a risk averse trader would have entirely avoided initiating the trade.

OHLC Data
Open : 16824.25
High : 17155.60
Low : 16410.20
Close : 17003.75
Now if you observe this candle is not a perfect bearish marubozu. A true bearish marubozu opens at the high and closes at the low, showing uninterrupted selling pressure. But here, the close is well above the low, and the high is significantly higher than the open, indicating the presence of both upper and lower wicks. This suggests that while sellers were active, they didn’t dominate the entire session.
Now, if a risk taker like Arjun shorted this candle near the close, expecting a strong bearish continuation, he’d likely be disappointed. The next candle could easily show a bounce or consolidation, and his stoploss, probably placed near the high of 17155.60, might get triggered. In contrast, a risk-averse trader like Aakash would wait for the next week’s candle to confirm bearish momentum. If the following candle turns out to be green or indecisive, Aakash avoids entering the trade altogether, preserving his capital. So in this case, Aakash benefits by staying out, while Arjun risks a premature entry and potential loss due to misreading the strength of the bearish signal.
5.6 Small Exercise for you

Plot the Bearish Marubozu Candlestick pattern in the below chart . And also mention think like risk taker and risk averse trader. What will be your decision when you observe the pattern?

Here is your answer

- The candle opened at ₹946.05 and closed at ₹950.30, which is very close to the weekly low of ₹930.10.
- The high of ₹950.80 is nearly equal to the open, and the close is near the low—classic Marubozu structure.
- The strategy label “Marubozu Black – Bear” confirms the bearish interpretation.
Trader Interpretation
- Risk-taker:Here you Might short near the close of the Marubozu week, placing a stop-loss just above the high.
- Risk-averse:Here you Wait for the next week to confirm bearish momentum before entering.
5.7 Key Takeaways

- Marubozu is a single candlestick pattern with no wicks, meaning the open and close are also the high and low of the session.
- A Bullish Marubozu opens at the low and closes at the high, signaling strong buying pressure and potential uptrend continuation.
- A Bearish Marubozu opens at the high and closes at the low, indicating dominant selling pressure and possible downtrend continuation.
- The absence of shadows reflects decisive market sentiment, with one side (buyers or sellers) clearly in control.
- Marubozu candles are most meaningful when they appear at key support or resistance levels.
- A Bullish Marubozu in an uptrend can signal a breakout, while a Bearish Marubozu in a downtrend may suggest further downside.
- Volume confirmation strengthens the reliability of Marubozu—higher volume adds conviction to the move.
- The timeframe matters: Marubozu on daily or weekly charts carry more weight than those on shorter intervals.
- Traders use Marubozu to spot momentum shifts, validate breakout setups, and time entries with confidence.