6.1 The Spinning Top

The Spinning Top candlestick is a subtle but insightful pattern that reflects market indecision. You’ll notice it has a small real body, meaning the opening and closing prices are quite close and long upper and lower wicks, which show that the price moved in both directions during the session. What this tells us is that neither buyers nor sellers were able to take control. Interestingly, the colour of the candle, whether it’s green or red isn’t the key factor here. It’s the structure that matters: a narrow body with extended shadows signals uncertainty in the market.
From a trader’s perspective, a Spinning Top is a hint to pause and reassess. It often shows up after a strong trend and can suggest that momentum is losing steam. For instance, if it appears after a sharp rally, it might be hinting that bullish strength is fading and a reversal could be on the horizon. On the flip side, if it forms during a downtrend, it could indicate that selling pressure is weakening. Either way, it’s not a signal to act immediately; it’s a prompt to watch what comes next. Confirmation from the following candle is essential before making any trading decisions.

Let’s walk through what really happens behind the scenes when a Spinning Top forms. First, take a look at the small real body , this tells us that the market opened and closed at nearly the same level. Say, for example, a stock opened at ₹520 and closed at ₹523. Or maybe it opened at ₹520 and closed at ₹517. In both cases, the price barely moved, and that narrow difference creates the small body. Whether the candle is green or red doesn’t matter much here the key takeaway is that the market didn’t commit to a clear direction.
Now, focus on the upper shadow. This connects the real body to the high of the day. If it’s a red candle, the high links to the open; if it’s green, the high links to the close. Either way, the presence of a long upper shadow tells us that buyers did try to push the price higher, maybe up to ₹540 but couldn’t hold it. If they had succeeded, we’d see a strong bullish candle with a large body. So, this shadow is evidence of a failed attempt by the bulls.
Next, look at the lower shadow, which connects the real body to the day’s low. For a red candle, it links the low to the close; for a green candle, it links the low to the open. Suppose the price dipped to ₹505 during the session. That means sellers tried to drag the market down, but just like the bulls, they couldn’t sustain the move. If they had, we’d see a long bearish candle instead.
Put all these pieces together the small body, the long upper and lower shadows, and you get a clear picture: neither side could dominate. The bulls tried and failed. The bears tried and failed. The result is a market caught in a tug-of-war, with no clear winner. That’s what the Spinning Top represents: indecision and uncertainty.
Now, if you spot a Spinning Top in isolation, it’s just a neutral signal. But when you see it in context say, after a strong rally or a steep decline, it becomes far more meaningful. After an uptrend, it might suggest that bullish momentum is fading. After a downtrend, it could hint that selling pressure is losing steam. In both cases, it’s a signal to pause, observe, and prepare, not to jump in immediately. Risk Averse Traders like Aakash would wait for the next candle to confirm the direction before acting, while Risk Taker Arjun might already be watching for signs of volatility to exploit.
6.2 Spinning Top in Downtrend

When a stock is in a downtrend, it’s usually the bears who are steering the market, pushing prices lower with consistent selling pressure. But when a Spinning Top appears in the middle of this decline, it signals something different: a pause, a moment of hesitation. The candle tells us that although the bears are still active, they may be losing momentum, and the bulls are beginning to test the waters, trying to halt the fall. However, their efforts aren’t strong enough to reverse the trend just yet, if they were, we’d see a solid bullish candle instead of a narrow-bodied Spinning Top.
So what should a trader make of this?
The presence of Spinning Tops in a downtrend opens up two equally plausible outcomes:
- either the market continues its downward journey, or
- it begins to reverse.
Since the candle itself doesn’t confirm direction, the trader must prepare for both possibilities. If someone has been waiting to go long, this could be a strategic entry point, but caution is key. Rather than jumping in with full exposure, the trader might choose to enter with half the intended quantity, say 100 shares out of a planned 200. This way, if the market turns upward, they can average up and build the position gradually. And if the downtrend resumes, the loss is limited to just half the stake.
This approach reflects a balanced mindset, not passive, but not reckless either. It’s about using the Spinning Top as a signal to stay alert, not to act impulsively. The candle doesn’t offer certainty, but it does offer context. And when placed within a broader chart, especially after a prolonged fall, it can be the first whisper of a potential turnaround.
This chart below illustrates a clear initial downtrend, signalling market indecision. Shortly after their appearance, the stock shifts direction and begins to rally, suggesting that the spinning tops marked a potential turning point in sentiment.

The below chart presents a scenario where, despite the appearance of spinning top candles, the downtrend persists—indicating that market indecision did not lead to a reversal, and bearish momentum remained intact.

Small Activity For You
Spot Spinning top in downtrend from the below chart

Here is your answer

6.3 Spinning Tops in Uptrend

A spinning top appearing during an uptrend carries a message similar to when it forms in a downtrend—market indecision. However, the interpretation shifts slightly. In the context of a rising market, the spinning top suggests that bullish momentum may be losing steam. If you observe the chart below, you’ll notice that despite the upward movement, the candle reflects hesitation. This could mean that buyers are pausing, sellers are beginning to test resistance, or both. The key inference here is that the trend may be at a crossroads, either preparing for a continuation or signalling an upcoming reversal.

When you look at the chart, one thing is immediately clear: the stock has been in a strong uptrend, with bulls firmly in control over the past few sessions. But now, a few spinning top candles have appeared, and that changes the tone. These candles suggest that the bullish dominance is starting to waver. If the bulls were still fully in charge, we wouldn’t see spinning tops, we’d see long-bodied bullish candles. Their appearance signals that the bears have entered the scene, even if they haven’t taken over yet. What’s important is that the bulls have allowed some room for the bears to test the waters.
So what does this mean for your trading stance? The spinning top is a classic sign of indecision, neither side is able to push the market decisively. In the context of an uptrend, this opens up two equally likely possibilities:
(a) The bulls might simply be consolidating before launching another leg upward, or (b) They could be running out of steam, giving way to a potential correction.
Since both outcomes are equally probable, the smart move is to prepare for either.
Let’s say you entered the trade earlier in the rally and now hold 500 shares. This could be a good time to book partial profits—perhaps sell 250 shares to lock in gains. That way, you’re protected if the market turns down, and you’ve secured profits at a higher level. If the bears take control and prices fall, you can exit the remaining shares and still come out ahead. On the other hand, if the bulls resume their charge and the rally continues, you’re still in the game with your remaining 250 shares, riding the upside.
This kind of balanced approach allows you to stay flexible and respond to whichever direction the market chooses next. In fact, the chart referred below shows exactly that: after a series of spinning tops, the stock resumed its upward move. By staying partially invested, you would have continued to benefit from the rally while managing your risk.

In summary, the Spinning Top candlestick reflects a phase of uncertainty in the market, where neither buyers nor sellers hold a clear advantage. With equal chances of a trend reversal or continuation, traders are advised to proceed with caution. During such periods, it’s wise to reduce position size and wait for clearer signals before committing fully to a trade.
Small Exercise for You
Plot Spinning Top in Uptrend from the below chart
Here is your Answer

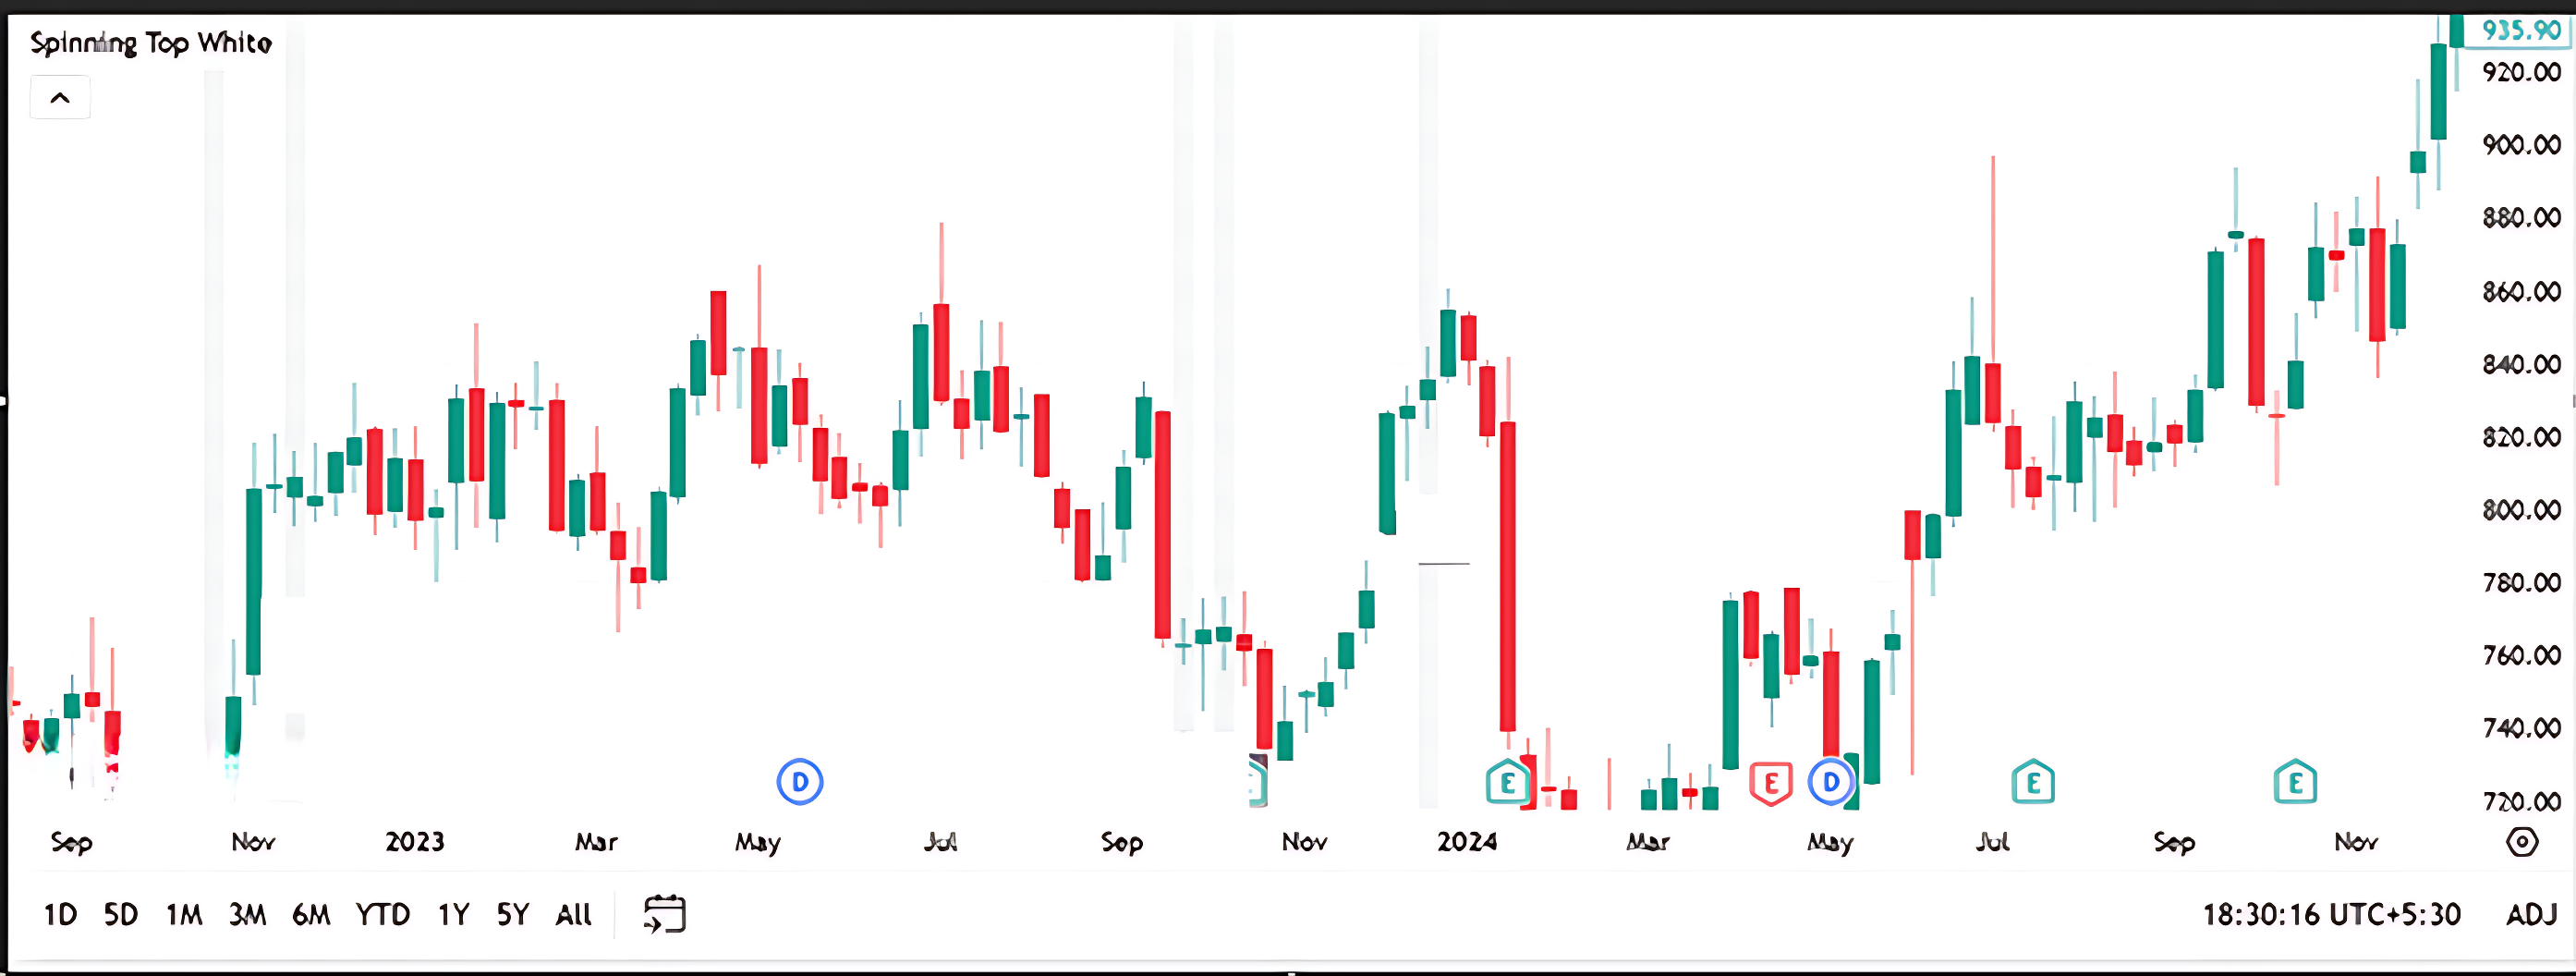
Spinning Top in Uptrend: This pattern typically signals indecision in the market. It appears after a strong move, often hinting at a potential reversal or consolidation. In this chart, the STW appears near the recent highs, which could mean buyers are losing momentum.
6.5 Doji Candlestick Pattern

Doji candles closely resemble spinning tops in appearance, but with one key distinction—they have no real body. This occurs when the opening and closing prices are virtually identical, creating a cross-like shape on the chart. Despite their simplicity, Doji’s carry significant weight in technical analysis, as they reflect a moment of complete indecision in the market. They offer valuable insight into shifting sentiment and often serve as early indicators of potential reversals or pauses in trend, making them an essential pattern for traders to watch closely.
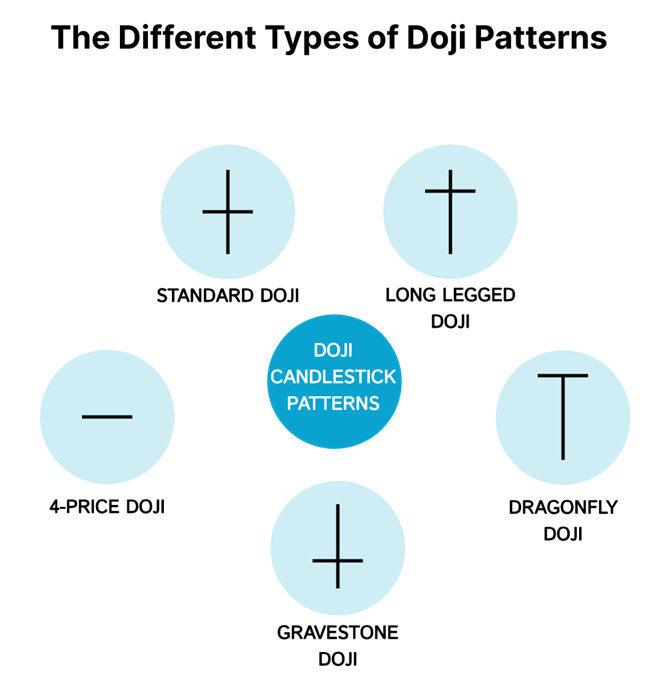
Doji candlesticks come in several distinct forms, each offering subtle clues about market sentiment and potential turning points. At their core, all Doji’s reflect indecision—formed when the opening and closing prices are nearly identical.
The Standard Doji is the most basic type, with a small or non-existent body and relatively equal upper and lower shadows. It signals a balance between buyers and sellers and often appears during consolidation or at the end of strong trends.
The Long-Legged Doji has extended upper and lower wicks, showing that the market was highly volatile during the session, but ultimately settled near the open. This type suggests intense indecision and is often seen near major support or resistance zones.
The Dragonfly Doji is shaped like a “T”, with a long lower shadow and no upper wick, indicating that sellers dominated early in the session but buyers managed to push the price back up by the close. This pattern is considered a bullish reversal signal, especially when it forms after a downtrend.
On the flip side, the Gravestone Doji resembles an inverted “”, with a long upper shadow and no lower wick. It shows that buyers initially drove prices higher, but sellers regained control by the close, often a bearish signal when it appears after an uptrend.
Lastly, the Four-Price Doji is extremely rare and occurs when the open, high, low, and close are all the same. It appears as a flat line and reflects complete market inactivity or equilibrium, typically in illiquid or halted trading conditions. Each type of Doji carries its own nuance, and while none offer standalone trading signals, they become powerful tools when interpreted within the broader context of trend and volume.
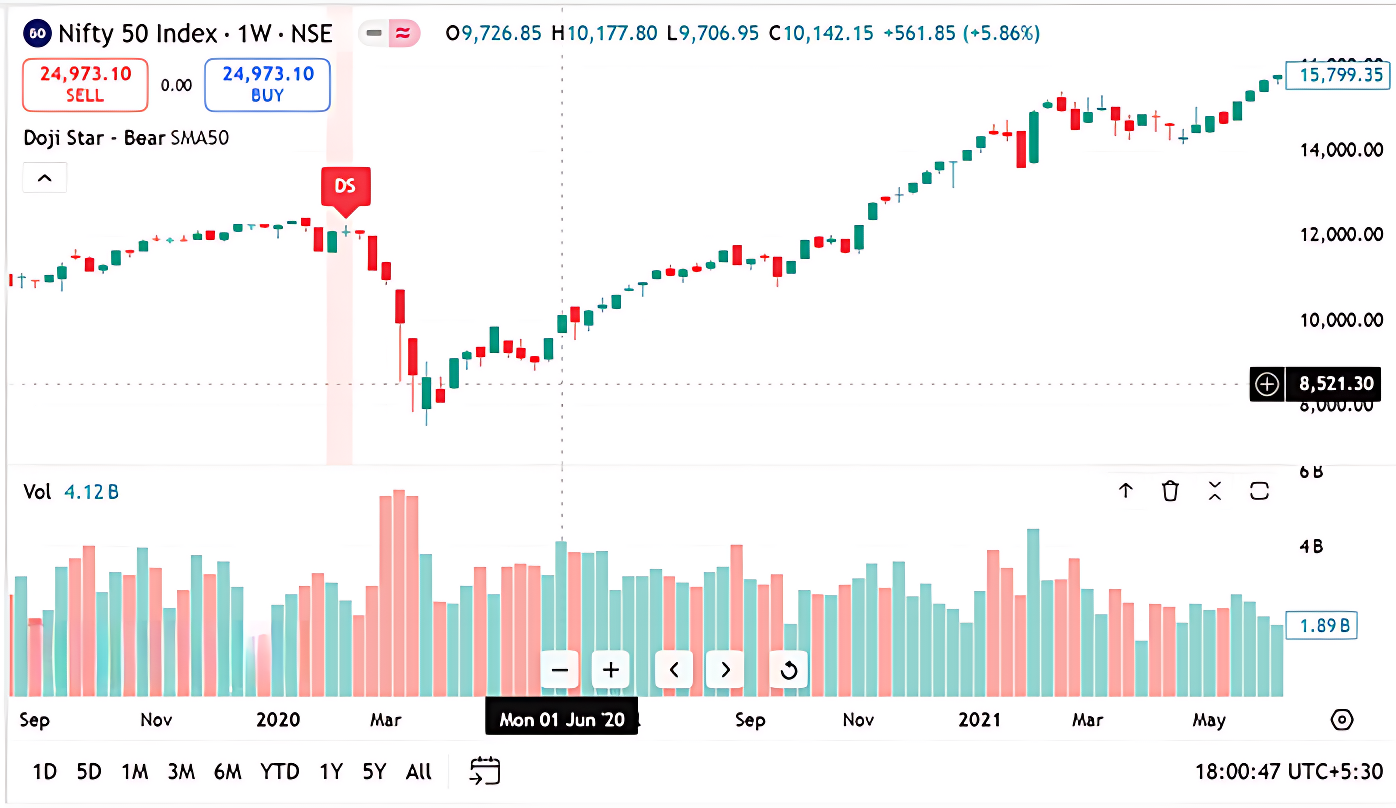
Here’s another chart that shows a strong uptrend followed by the appearance of a Doji candle, signaling hesitation in bullish momentum. Shortly after, the market shifts direction and enters a corrective phase, suggesting the Doji may have marked the turning point.
Take a look at the chart below—Doji’s have formed during a prevailing downtrend, signalling a phase of market indecision that often precedes a significant directional move.

The next time you spot a Spinning Top or a Doji, whether it’s a single candle or a cluster—recognize it as a sign of market indecision. It’s a moment where neither bulls nor bears have the upper hand, and the price could move in either direction. In such scenarios, it’s essential to adopt a flexible stance, one that prepares you for both a potential reversal and a continuation of the trend. Staying cautious and adjusting your position size accordingly can help you navigate the uncertainty with confidence.
Small Activity for You
On the weekly chart of HDFC Bank, a Doji candlestick is marked—based on its position and the candles around it, what does this pattern suggest about market sentiment, and how might a cautious trader interpret it in terms of trend continuation or reversal?

Here is your Answer
The Doji candlestick on HDFC Bank’s weekly chart signals indecision in the market—neither buyers nor sellers had clear control during that week. If it appears after a strong uptrend, it may suggest potential exhaustion or a pause in bullish momentum.
For a cautious trader this pattern, especially if followed by a bearish candle, could be a warning sign of a possible reversal or consolidation. He might choose to wait for confirmation in the next candle before making any move, rather than acting impulsively. This reflects disciplined trading psychology: observing, not reacting.
6.6 Key Takeaways

- Spinning Top = Indecision:
A small body with long upper and lower shadows shows that neither buyers nor sellers have control. - Color is Secondary:
Whether the spinning top is red or green is less important than its structure. - Context Matters:
On its own, a spinning top is neutral, but after a strong uptrend or downtrend, it signals possible momentum loss. - Need for Confirmation:
Traders should always wait for the next candle to confirm direction before acting. - Downtrend Implication:
A spinning top in a downtrend may indicate that bears are losing strength, but reversal isn’t certain. - Cautious Entry Strategy:
In downtrends, traders may enter with partial positions to balance risk and opportunity. - Uptrend Implication:
A spinning top in an uptrend suggests bulls are slowing down, and bears are testing resistance. - Partial Profit Booking:
During an uptrend, booking partial profits at spinning tops helps lock in gains while staying in the trade. - Doji = Stronger Indecision:
Unlike spinning tops, Doji candles have virtually no body (open ≈ close), signaling deeper hesitation. - Different Types of Doji:
- Standard Doji:Balanced indecision.
- Long-Legged Doji:High volatility but no clear outcome.
- Dragonfly Doji:Bullish reversal (after downtrend).
- Gravestone Doji:Bearish reversal (after uptrend).
- Four-Price Doji:Rare, signals complete market standstill.