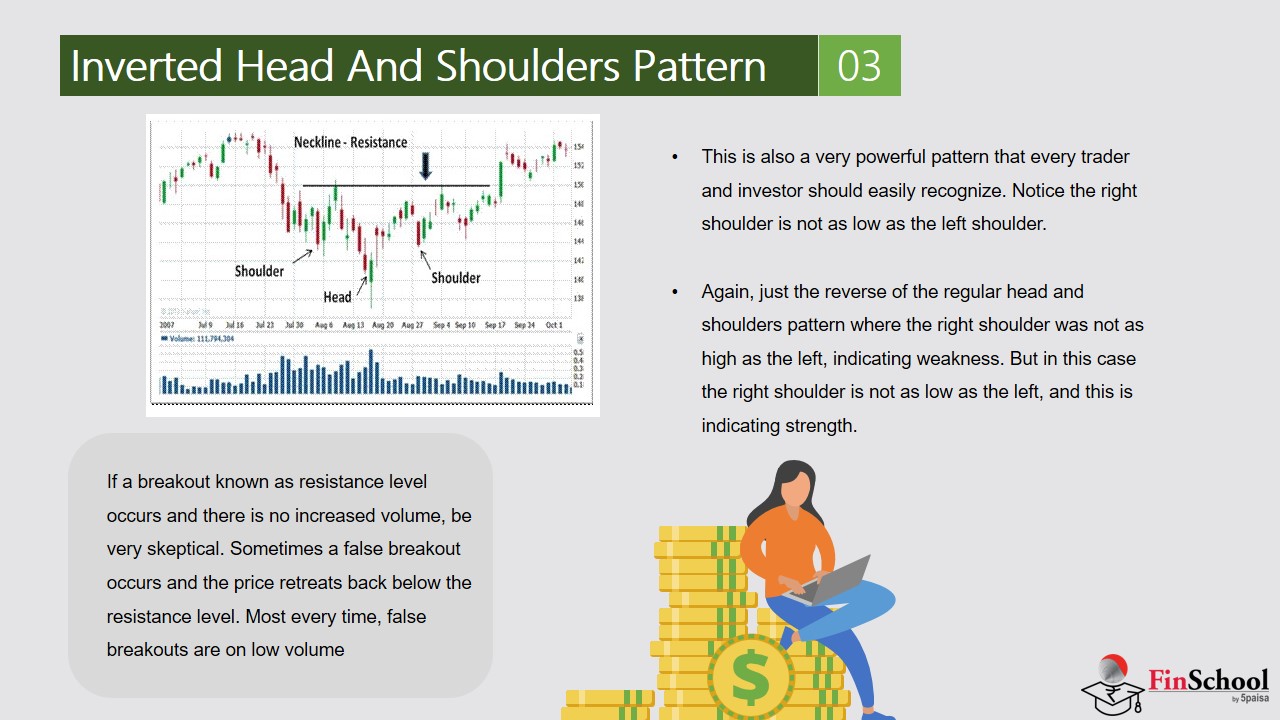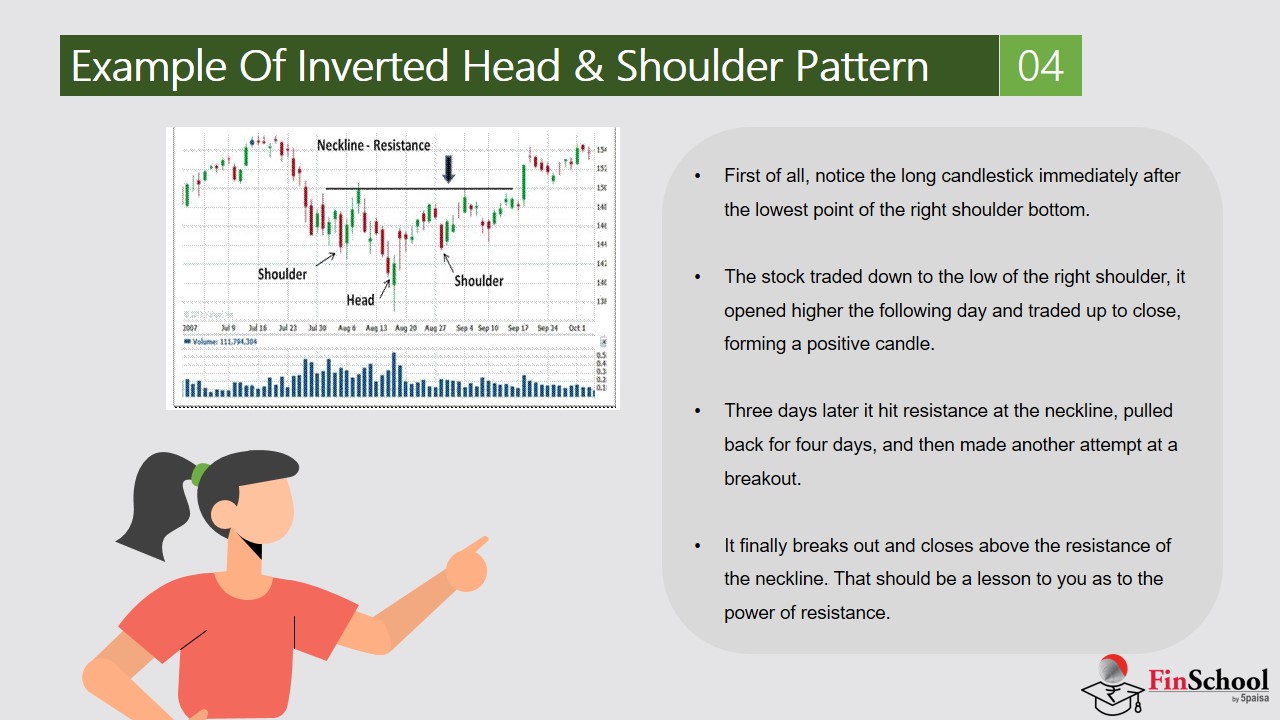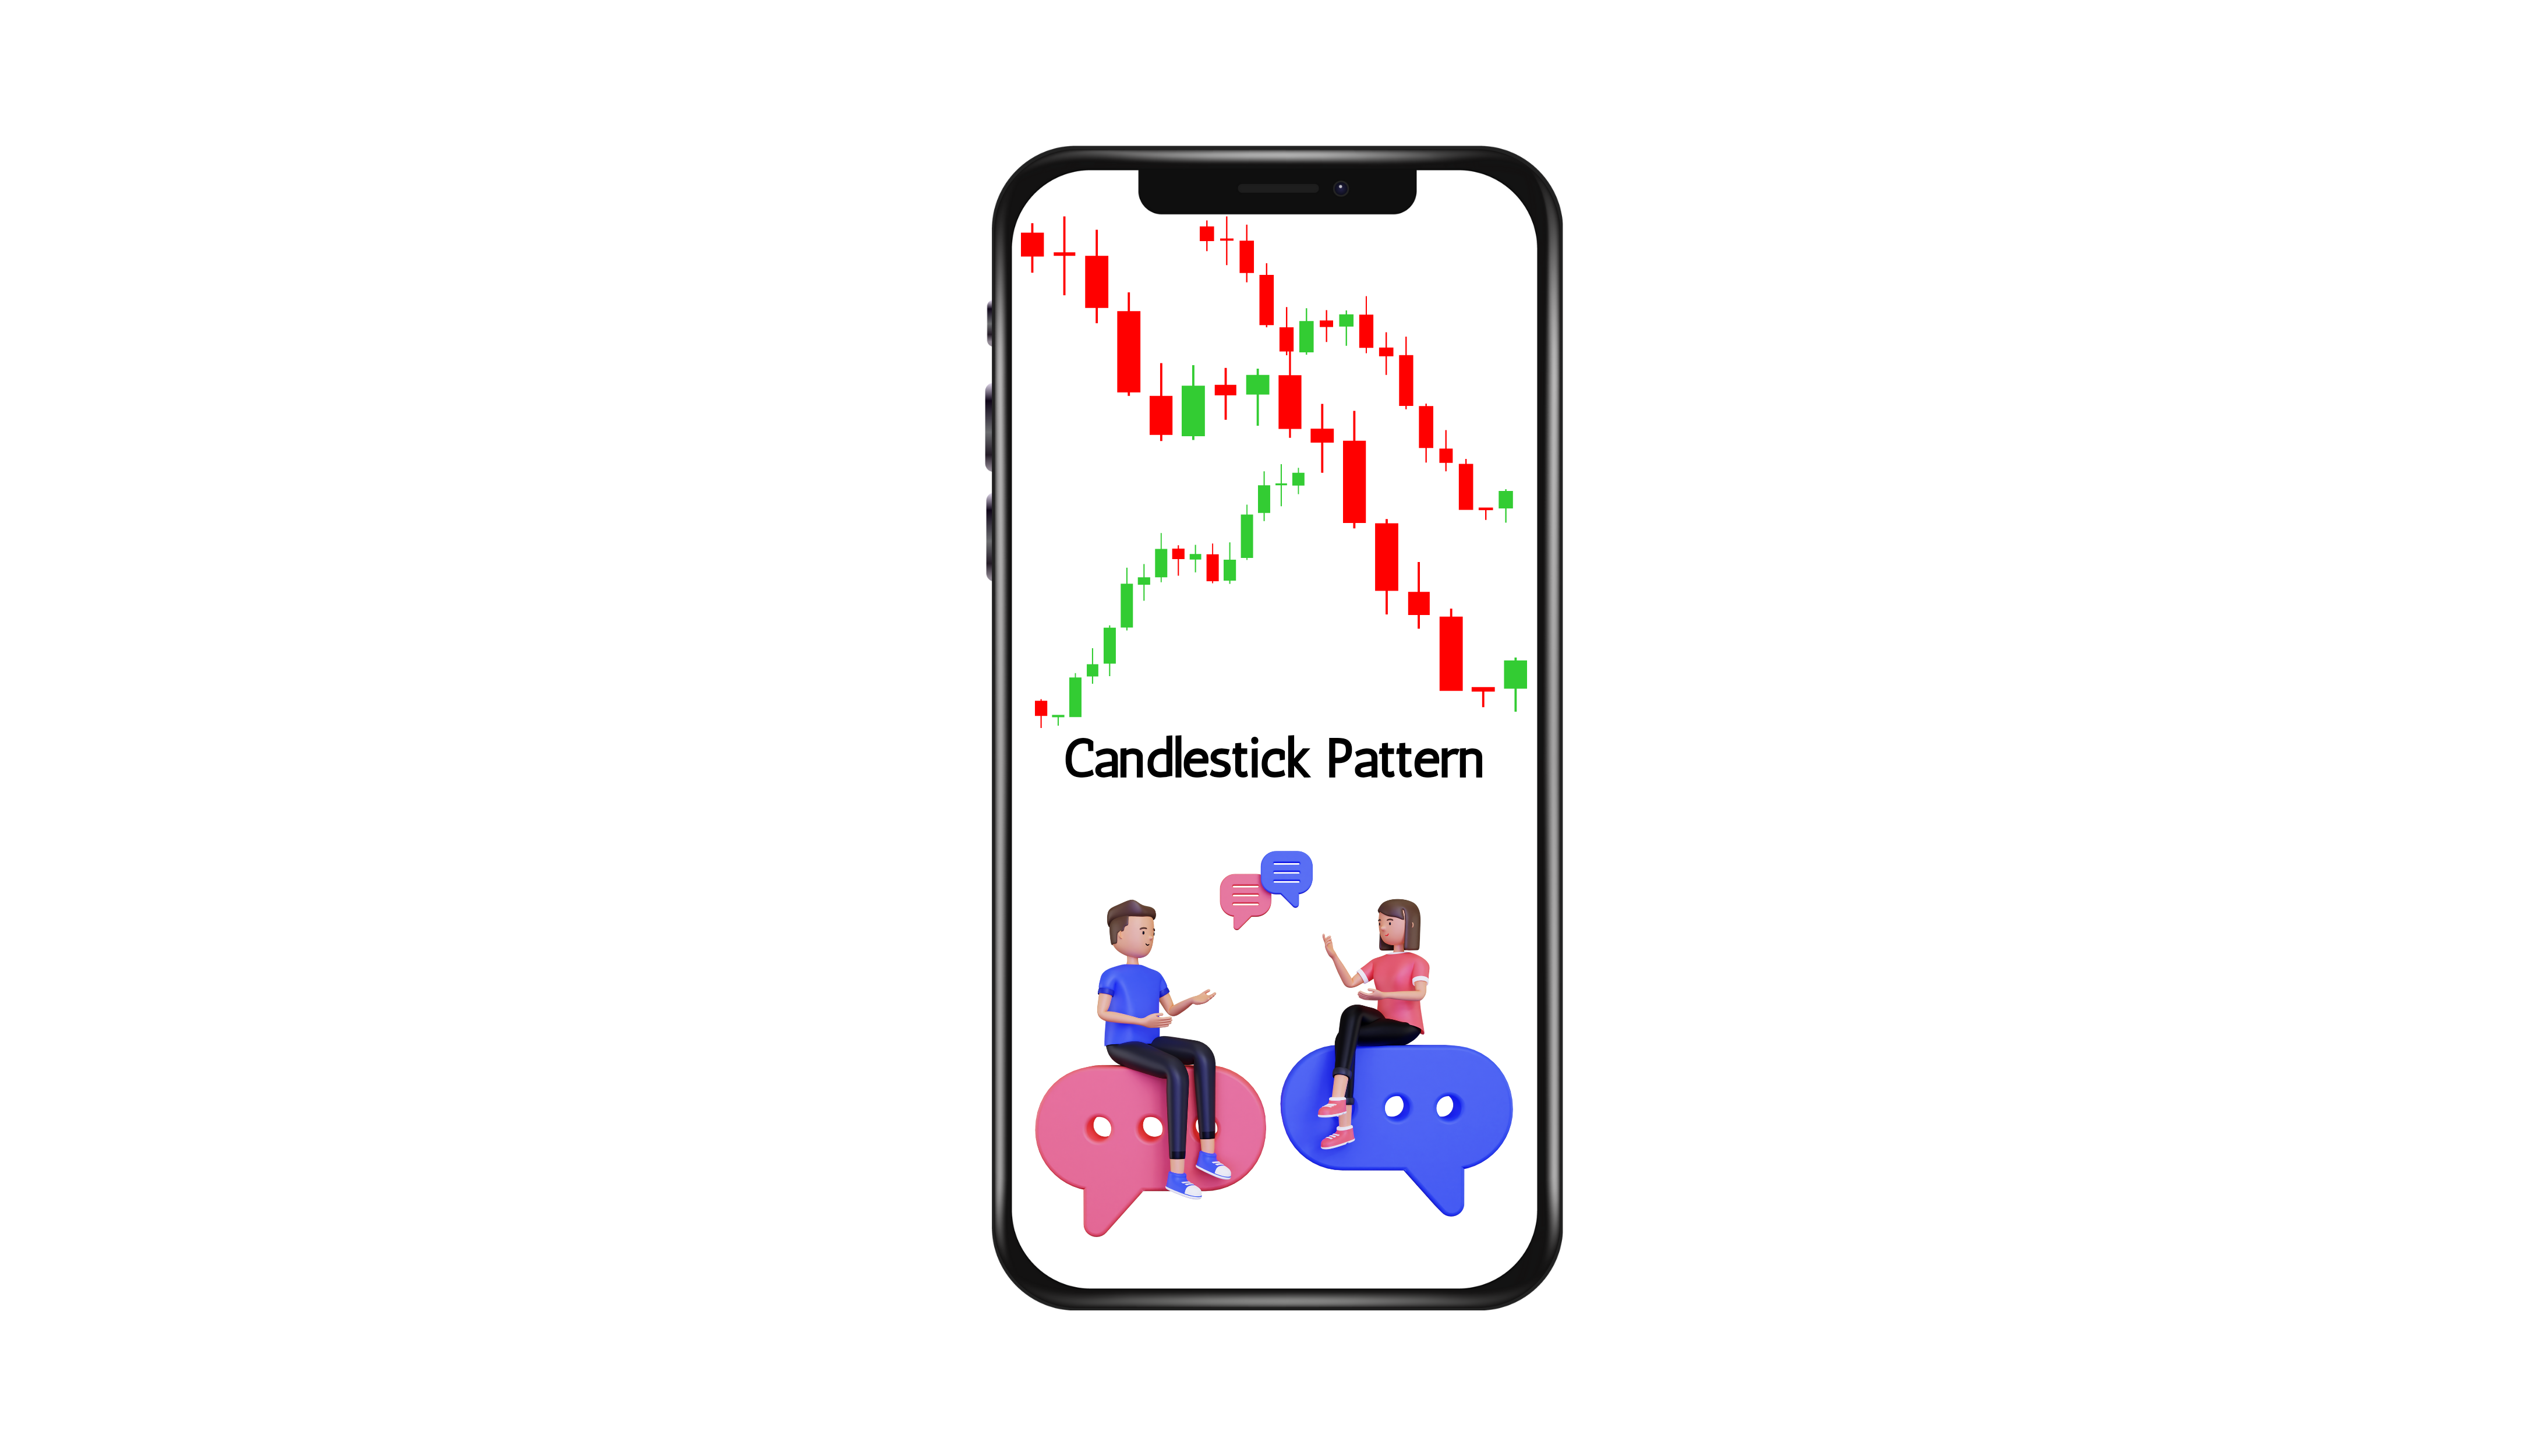
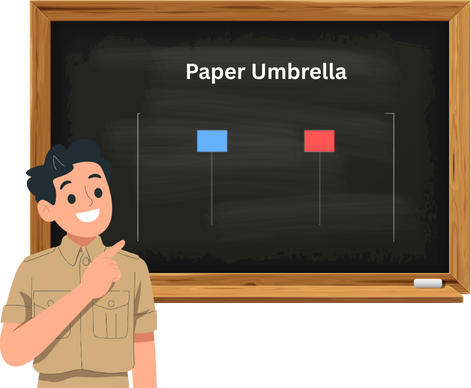
7.1 Paper Umbrella
A Paper Umbrella is a single candle on a chart that helps traders guess where the price might go next. Its meaning changes depending on where it shows up ,near the top, bottom, or middle of a price move.
Think of the Paper Umbrella like a road sign. If you see it at the bottom of a hill, it might be telling you the road is about to go uphill which means price may rise. If it appears at the top of a hill, it could be warning that a downhill stretch is coming which price may fall. In the middle of a flat road, it’s just a marker, you need more signs to know where you’re headed.
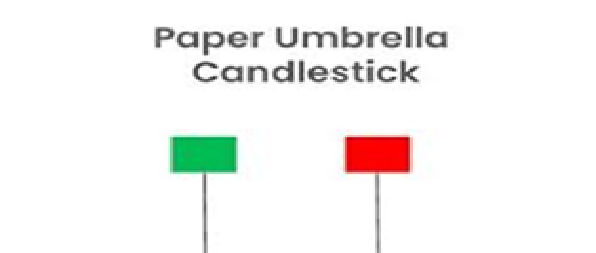
A Paper Umbrella is a special type of candlestick that signals a possible change in the direction of price movement. It has a small real body at the top and a long lower shadow, which means that during the trading session, prices fell significantly but then bounced back before closing. This shape resembles an upside-down umbrella, with the handle being the long shadow and the canopy being the small body.
There are two main types of Paper Umbrella patterns: the Hammer and the Hanging Man. The Hammer usually appears after a downtrend and suggests that buyers are starting to gain control, which could lead to a price increase. On the other hand, the Hanging Man shows up after an uptrend and hints that sellers might be stepping in, possibly causing the price to drop. So, while both patterns look similar, their meaning depends on where they appear on the chart.
The key feature of a Paper Umbrella is its long lower shadow, which should be at least twice the size of the body. This shadow shows that there was strong selling pressure during the session, but buyers managed to push the price back up before the close. The small body indicates that the opening and closing prices were close to each other, adding to the uncertainty and potential for reversal.
Suppose a candlestick with the following values: the stock opened at ₹250, reached a high of ₹255, dropped to a low of ₹240, and finally closed at ₹252. Since the closing price is higher than the opening price, this forms a bullish candle. The real body of the candle is ₹252 minus ₹250, which equals ₹2. The lower shadow is ₹250 minus ₹240, giving us ₹10. Because the lower shadow is five times longer than the body, this candle fits the definition of a Paper Umbrella. It shows that sellers pushed the price down during the session, but buyers came in strong and pulled it back up before closing, hinting at a possible reversal in trend.
7.2 The Hammer Formation
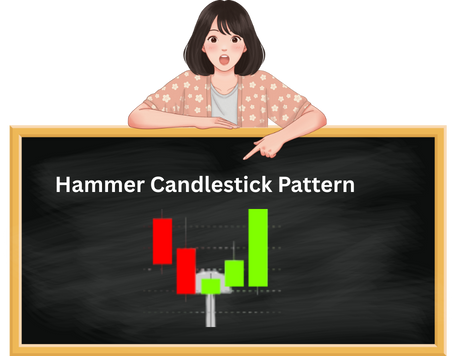
A bullish hammer is a powerful candlestick pattern that shows up at the bottom of a downtrend and hints at a possible price reversal. It looks like a small candle sitting on top of a long stick. The small body appears near the top of the candle’s range, while the long lower shadow shows that sellers tried to push the price down ,but buyers came in strong and pulled it back up before the close.
The longer this lower shadow, the stronger the buying pressure ,and the more bullish the signal. It’s like the market tested lower levels but refused to stay there, giving traders a clue that the trend might be ready to turn upward.

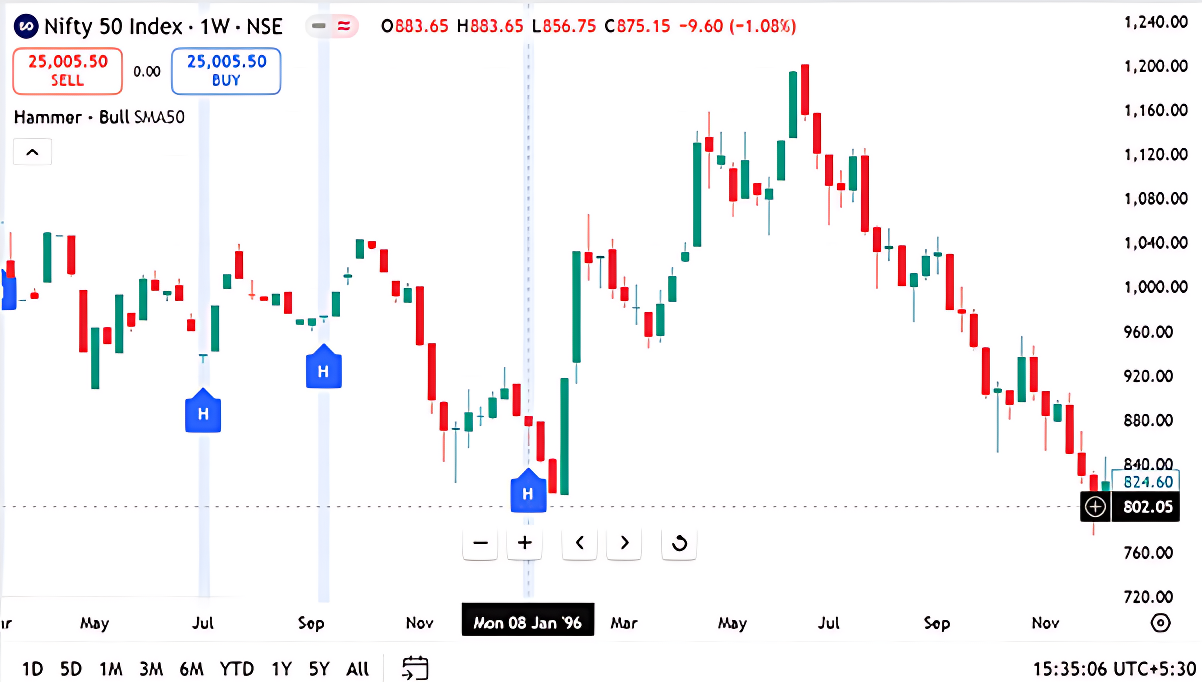
If you observe the image The Nifty 50 is in a clear downward trend on 8th January 1996, with several red candles leading into the hammer.These candles have Small real bodies near the top, Long lower shadows, showing rejection of lower prices, Appear after bearish candles, signaling potential reversal.This suggests that bears pushed the price down, but bulls bought the dip and market may be preparing for a reversal or pause in selling.
Before a hammer forms, the market must be in a clear downtrend, which is often marked by a series of lower highs and lower lows. This sets the stage for the hammer’s significance.
Thought Process Behind the Hammer Pattern
- Dominance of BearsThe market is consistently falling, with sellers firmly in control. Each session opens lower and closes even lower, reinforcing bearish sentiment.
- Continuation of the DowntrendTraders expect the decline to continue. The market opens and once again moves lower, forming a fresh low.
- Intraday Reversal BeginsAt the new low, buying interest suddenly emerges. Bulls begin to absorb the selling pressure and push prices upward.
- Strong Close by BullsBy the end of the session, the price recovers significantly and closes near the high of the day despite having traded much lower earlier.
- Shift in SentimentThis price action signals that bulls are attempting to regain control. While not a full reversal yet, it shows their strength and intent.
- Potential Buying OpportunityThe hammer suggests a possible change in market sentiment. Traders should watch for confirmation in the next candle and consider buying if bullish momentum continues.
The trade setup for the hammer is as follows:
The entry and exit in case of Hammer candlestick pattern depends on the risk appetite of the trader. If the trader is risk taker like Arjun he can enter the trade same day and buy some stocks whereas risk averse trader like Aakash will wait for next day and confirm that a Green colour candle is formed.
On the day a hammer candlestick is forming, a risk-taking trader can assess the pattern around 3:20 PM by checking two key conditions. First, the open and close prices should be nearly equal within a 1–2% range indicating indecision between buyers and sellers. Second, the lower shadow must be at least twice the length of the real body, showing that although the price dipped significantly during the session, buyers stepped in and pushed it back up. If both conditions are met, the trader can consider it a valid hammer and may choose to enter a long position before the market closes.
For a risk-averse trader, the strategy is more cautious. They wait until the next trading day to evaluate the price action. If the following candle is bullish typically a Green candle that closes above the hammer’s high, it confirms buying interest and validates the reversal signal. Only then does the trader consider entering a long position, reducing the chance of acting on a false pattern.
In both cases, the low of the hammer candle serves as a critical stoploss level. This is the point where buyers previously stepped in to defend the price. If the market falls below this level again, it suggests that the bullish reversal has failed, and the trader should exit to protect capital.
The chart below highlights hammer formation that offered a profitable setup for both risk-takers and risk-averse traders.

How?
on 2nd February 2009 on the Nifty 50 weekly chart, both types of traders ,risk takers like Arjun and risk-averse like Aakash could have benefited, but the risk taker would have gained earlier entry and potentially higher returns.
Here’s why:
The hammer on that date formed after a strong downtrend, and it met the classic criteria risk taker Arjun, checking the candle around 3:20 PM on that week’s Friday, would have seen the pattern shaping up and entered before the week closed, anticipating a reversal. This early entry would have allowed them to catch the initial bounce as the market began its recovery.
The risk-taker would have entered the trade at the close of the hammer candle, which was ₹2,873.45, anticipating a reversal based on the candlestick’s structure and its position after a sustained downtrend.
On the other hand, a risk-averse trader Aakash would have waited for the next week’s candle to confirm the reversal. In this case, the following candle was bullish, validating the hammer. So while they entered slightly later, they still benefited from the sustained uptrend that followed.
For both traders, the stoploss was placed at ₹2,750 the low of the hammer candle marking the level where buyers had stepped in to defend the price.
This setup proved effective, as the market reversed strongly in the following weeks, offering desirable returns regardless of entry style. The risk-taker benefited from early momentum, while the risk-averse trader entered with greater confirmation and reduced uncertainty.
Here is the below chart the risk averse trader that is Aakash would have benefited as he waited to watch next day candle whereas risk taker Arjun would have ended up making loss.
This chart below displays a well-formed hammer candlestick, but it lacks a preceding downtrend, which is a crucial condition for validating the pattern. Without a clear bearish phase leading into the hammer, it cannot be classified as a true bullish reversal signal.
Some Activity For You

Here is a image showing HDFC Bank Limited chart and the pattern formed is bullish Hammer. Below mentioned are 5 quiz questions for which you need to select the correct answer
- What does the ‘Hammer’ candlestick pattern typically indicate in technical analysis?
- Strong downtrend
- A bearish continuation
- Market Indecision
- A bullish reversal
- During which week did the ‘Hammer – Bull S/W&SJ’ pattern appear on the HDFC Bank chart?
- October 10, 2011
- January 3, 2011
- June 27, 2011
- March 14, 2011
- What does a weekly candlestick represent in the chart?
- One Week of Trading Activity
- One Year of Trading Activity
- One day of Trading Activity
- One Month of Trading Activity
Answers
- Bullish reversal
- March 14, 2011
- One Week of Trading Activity
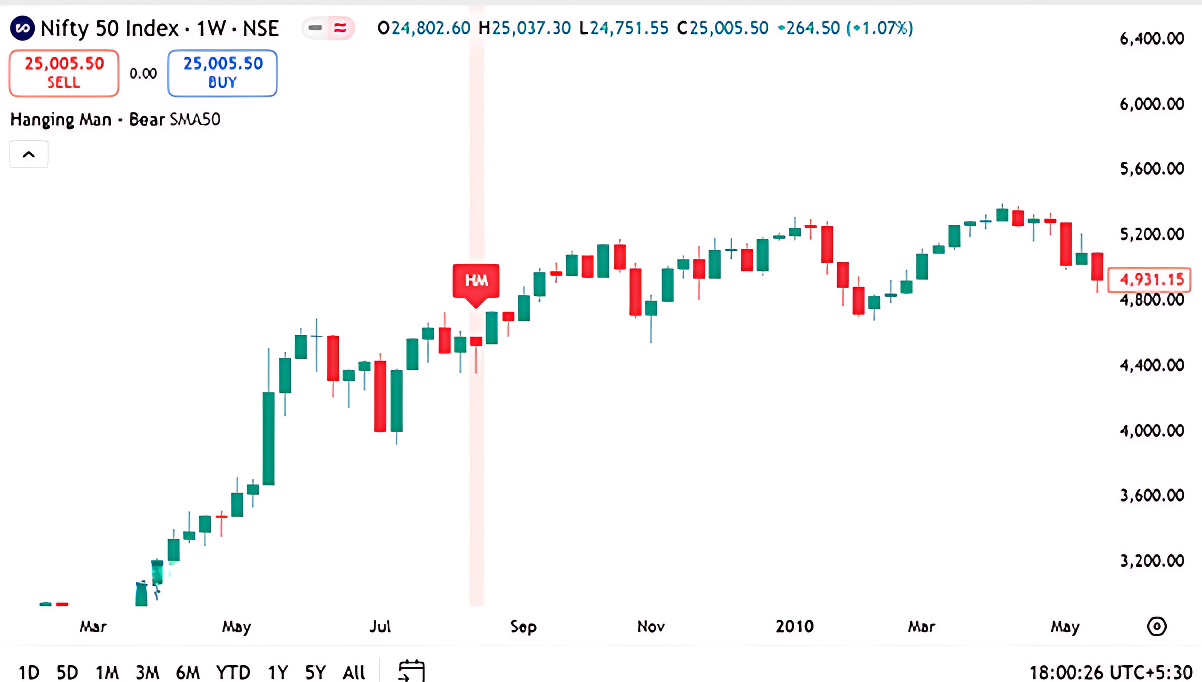
7.3- Hanging Man
The Hanging Man is a bearish candlestick pattern that typically appears at the end of an uptrend, signaling a potential reversal or slowdown in bullish momentum. It resembles a hammer in shape,with a small real body near the top and a long lower shadow ,but its meaning is quite different due to its placement. The long lower shadow indicates that sellers tried to push the price down during the session, but buyers managed to recover some ground by the close. However, this recovery is seen as weak, especially after a strong rally, and suggests that selling pressure may be building beneath the surface.
For traders, the Hanging Man serves as a cautionary signal. While the candle itself doesn’t confirm a reversal, it raises a red flag that the uptrend might be losing steam. Confirmation is key ,if the next candle closes lower, especially below the Hanging Man’s low, it validates the bearish sentiment and may trigger short positions. The low of the Hanging Man acts as a reference point for stoploss placement, and traders often wait for volume spikes or additional bearish indicators before acting.
The color of a Hanging Man candle whether red or green is not critical. What truly defines it is the proportion between the lower shadow and the real body. As long as the lower shadow is significantly longer than the body, the candle qualifies as a Hanging Man. However, for the pattern to be valid, it must appear after a clear uptrend like the one formed on the above chart, which sets the context for a potential bearish reversal.
The logic behind a Hanging Man is rooted in market psychology. During an uptrend, buyers are in control and prices continue to rise. On the day the Hanging Man forms, the market opens higher but then faces strong selling pressure, pushing prices down sharply. Although buyers manage to recover some ground by the close, the long lower shadow reveals vulnerability. This shift hints that sellers are beginning to challenge the bullish momentum, and if confirmed by a bearish candle next, it could signal a trend reversal.
The Hanging Man pattern signals potential weakness in an ongoing uptrend and sets the stage for a shorting opportunity. A risk-taking trader Arjun may choose to act immediately, initiating a short position on the same day the Hanging Man forms, typically around the closing price. In contrast, a risk-averse trader Aakash waits for confirmation, specifically, a red candle on the following day that closes lower before entering the trade. This cautious approach helps reduce the chance of reacting to a false signal.
The method for validating the Hanging Man is identical to that used for the hammer pattern: focus on the shadow-to-body ratio and ensure the candle appears after a clear uptrend. Once the short position is taken, the high of the Hanging Man candle becomes the stoploss level, as it marks the point where buyers last attempted to push prices higher. If the price breaks above this level, the bearish setup is considered invalid.
Trade setup in case of Hanging Man Candlestick Pattern
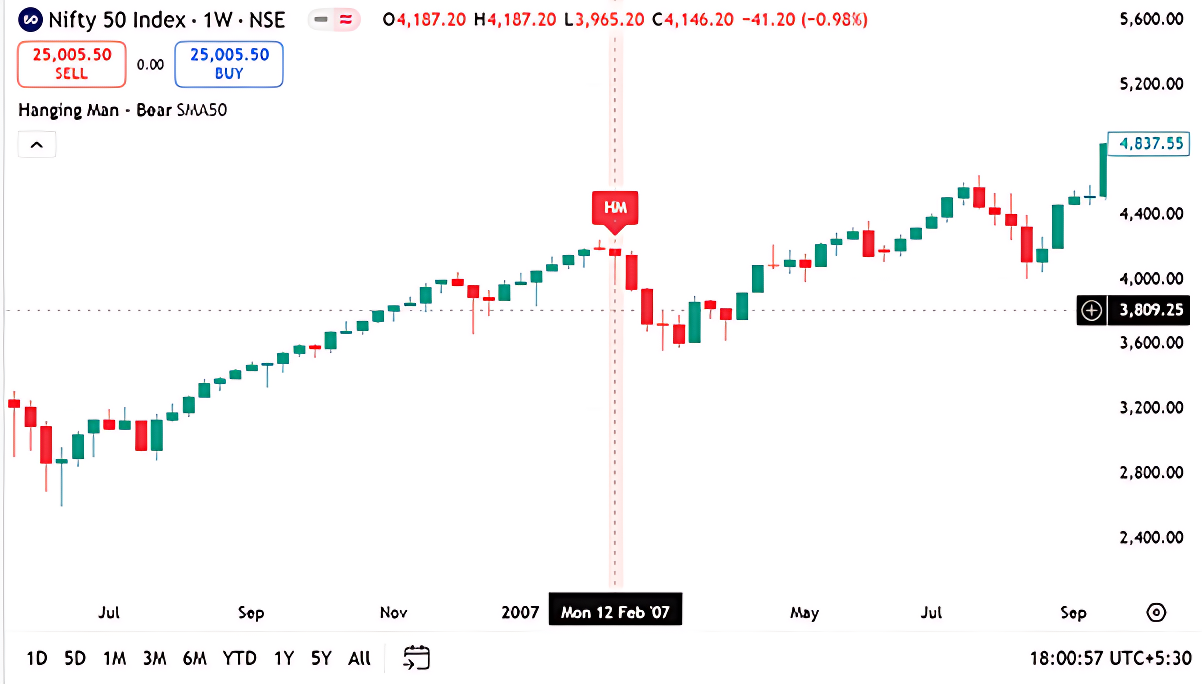
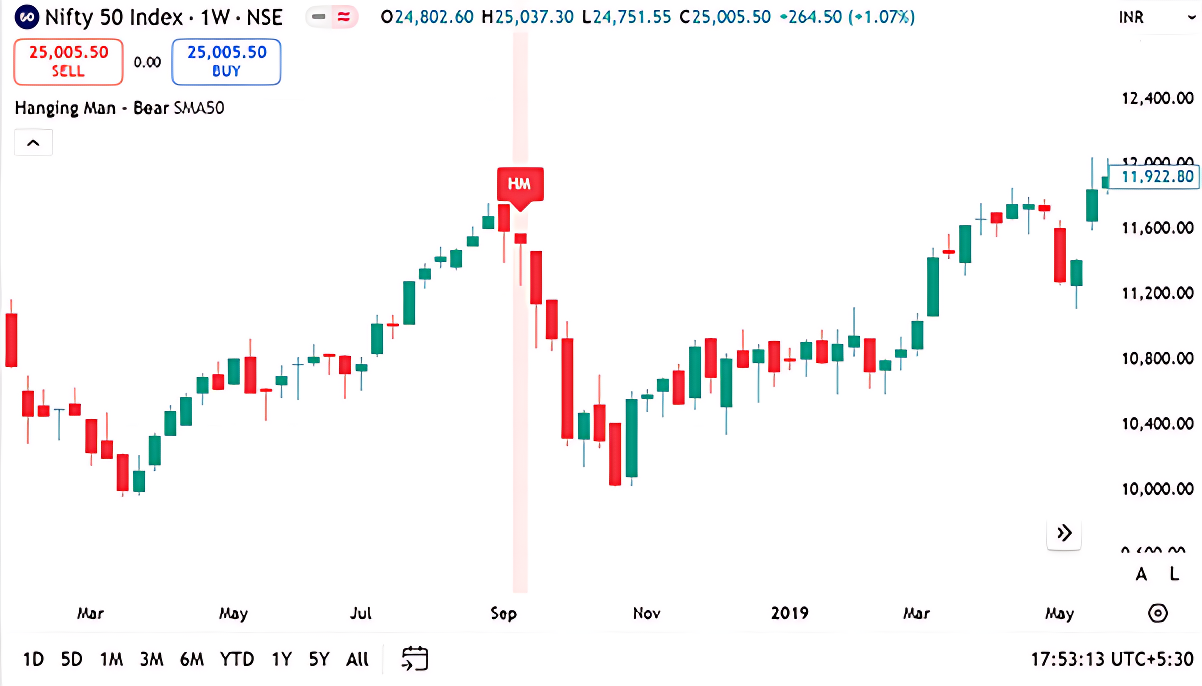
In the chart above, the Nifty 50 Index has formed a Hanging Man pattern during the week of 12 February 2007. The Day 1 OHLC details for this candle are:
- Open = ₹4,187.20
- High = ₹4,187.02
- Low =₹3,965.20
- Close =₹4,126.20
Day 2 OHLC is
- Open : 4149.25
- High : 4177.70
- Low : 3918.20
- Close : 3938.95
Based on this setup, the trade would unfold as follows:
- The risk taker initiates a short trade on the same day the Hanging Man appears, entering at the close price of ₹4,126.20.
- The risk-averse trader waits for confirmation and initiates the short trade on the following week, after ensuring the candle is red and closes lower, entering at ₹3938.95 (based on the next candle’s close).
- Both traders would have successfully entered their trades based on their respective strategies.
- The stoploss for this setup is placed just above the high of the Hanging Man candle, i.e., above ₹4,187.02.
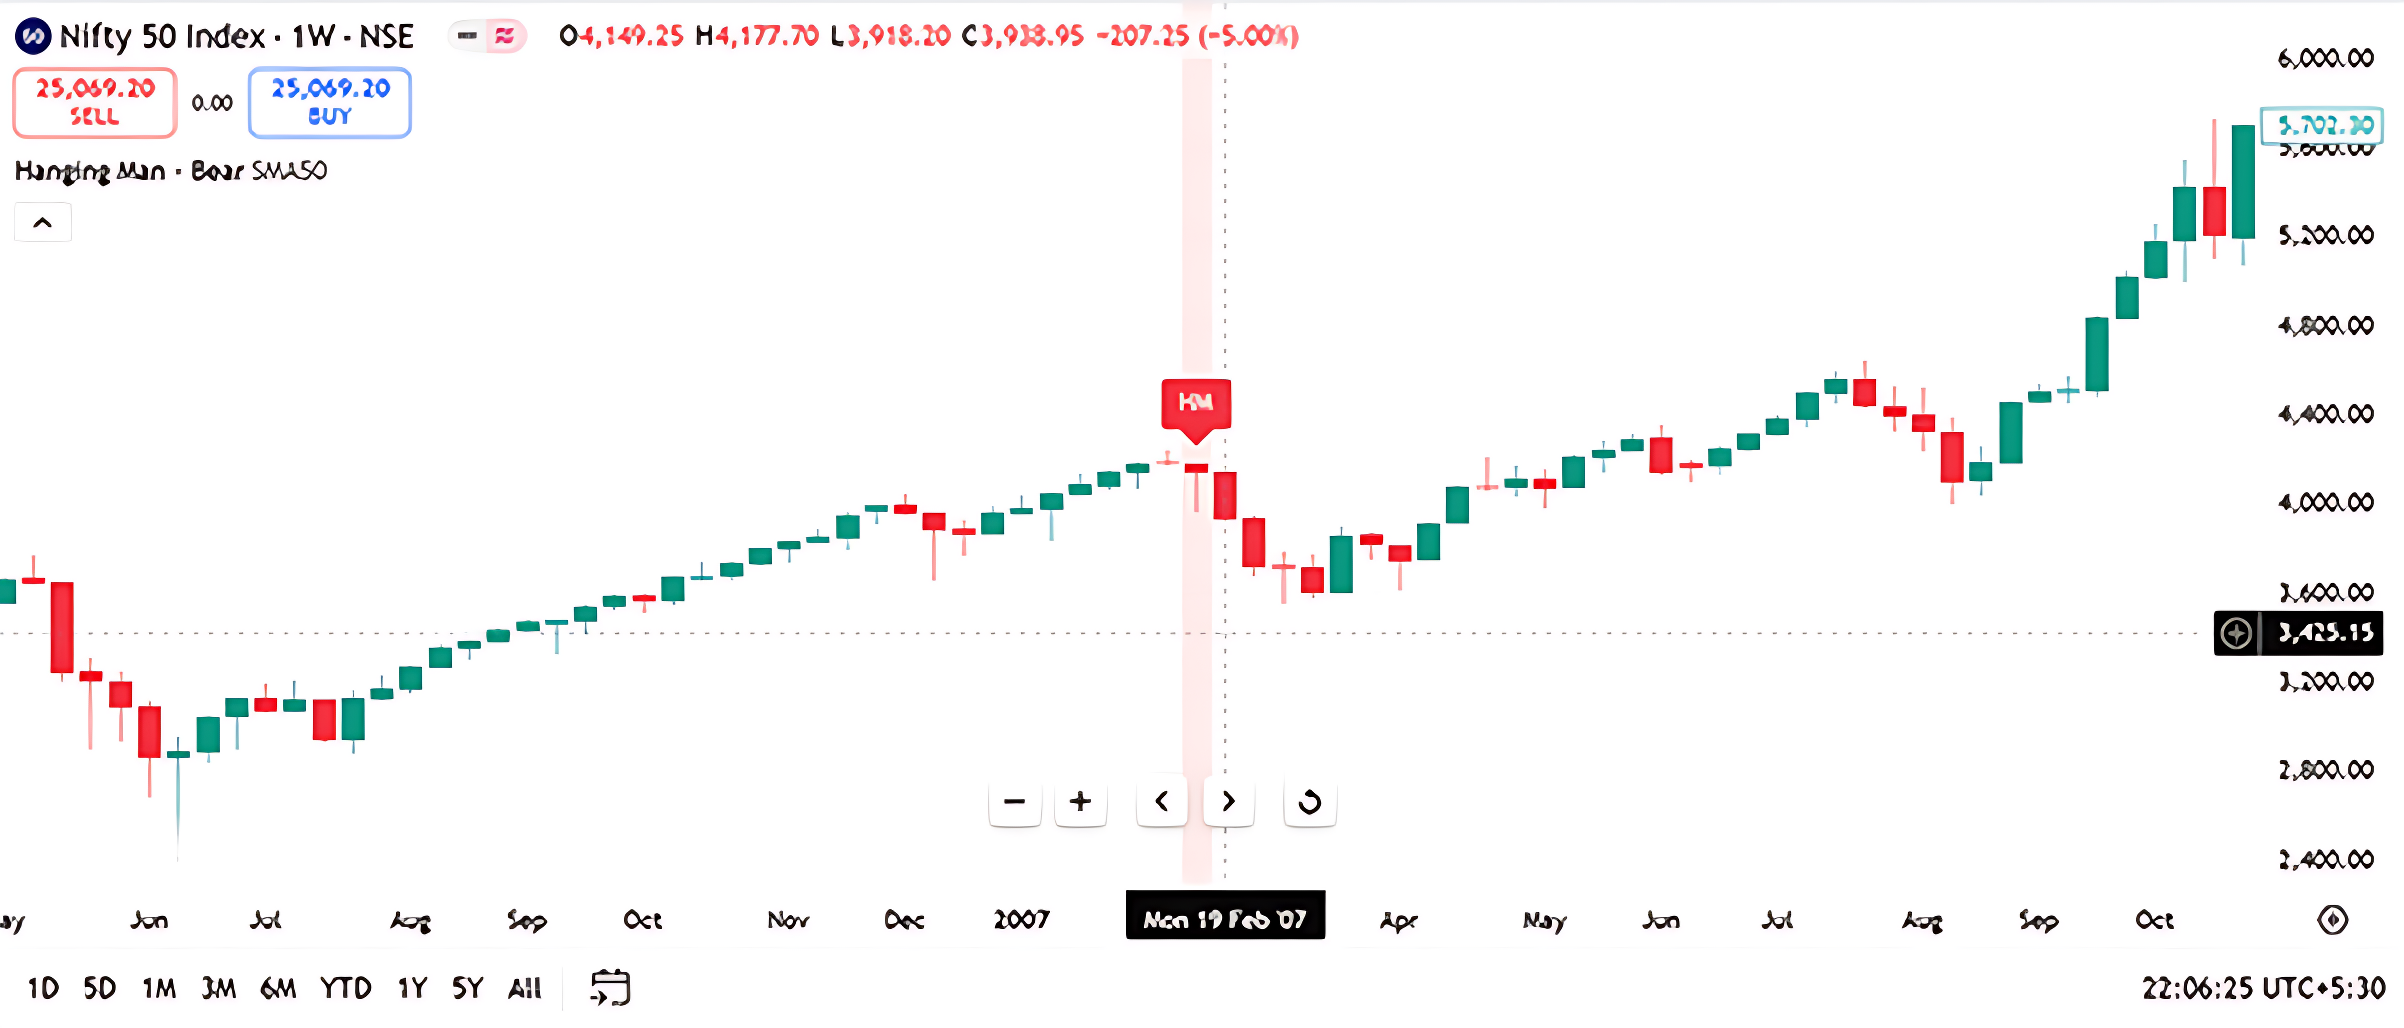
Looking at the chart dated around May 2010, the Hanging Man pattern marked on the Nifty 50 weekly chart appears visually correct in terms of candlestick shape—a small real body near the top with a long lower shadow. However, the pattern fails contextually, which is why it does not result in a successful bearish reversal.
Here’s why the Hanging Man is a failure in this case:
- Lack of Confirmation: After the Hanging Man forms, the next candle is not bearish. Instead, the market continues to rise, showing no signs of selling pressure or reversal. For a Hanging Man to be valid, it must be followed by a red candle that closes below the Hanging Man’s low. That confirmation is missing here.
- Strong Uptrend Continuation: The broader trend remains bullish even after the Hanging Man appears. The index keeps making higher highs, which invalidates the bearish signal. This suggests that buyers are still in control, and the Hanging Man was merely a pause or intraday dip—not a shift in sentiment.
- No Volume Spike or Weak Close: A strong Hanging Man setup often includes high volume and a weak close relative to the open. In this case, the candle closes near its high, which shows that buyers recovered well by the end of the week—again, not a sign of weakness.
In summary, while the candle visually resembles a Hanging Man, the lack of confirmation, continued bullish momentum, and absence of selling pressure make it a failed pattern. It’s a great example to teach learners that context and follow-through matter more than shape alone.
In this scenario, both the risk taker and the risk-averse trader would likely face a loss, but the risk taker would be hit harder.
Here’s why:
- The risk taker Arjun enters the short trade immediately after the Hanging Man forms, expecting a reversal. However, the following candles show continued bullish momentum, invalidating the bearish signal. Since they entered without confirmation, they’re exposed to the full upside move and would likely be stopped out quickly as the price rises above the Hanging Man’s high.
- The risk-averse trader Aakash, on the other hand, waits for a red candle to confirm the reversal. But in this case, the next candle is bullish, so they would not enter the trade at all. Their strategy protects them from acting on a false signal.
Some Activity for You
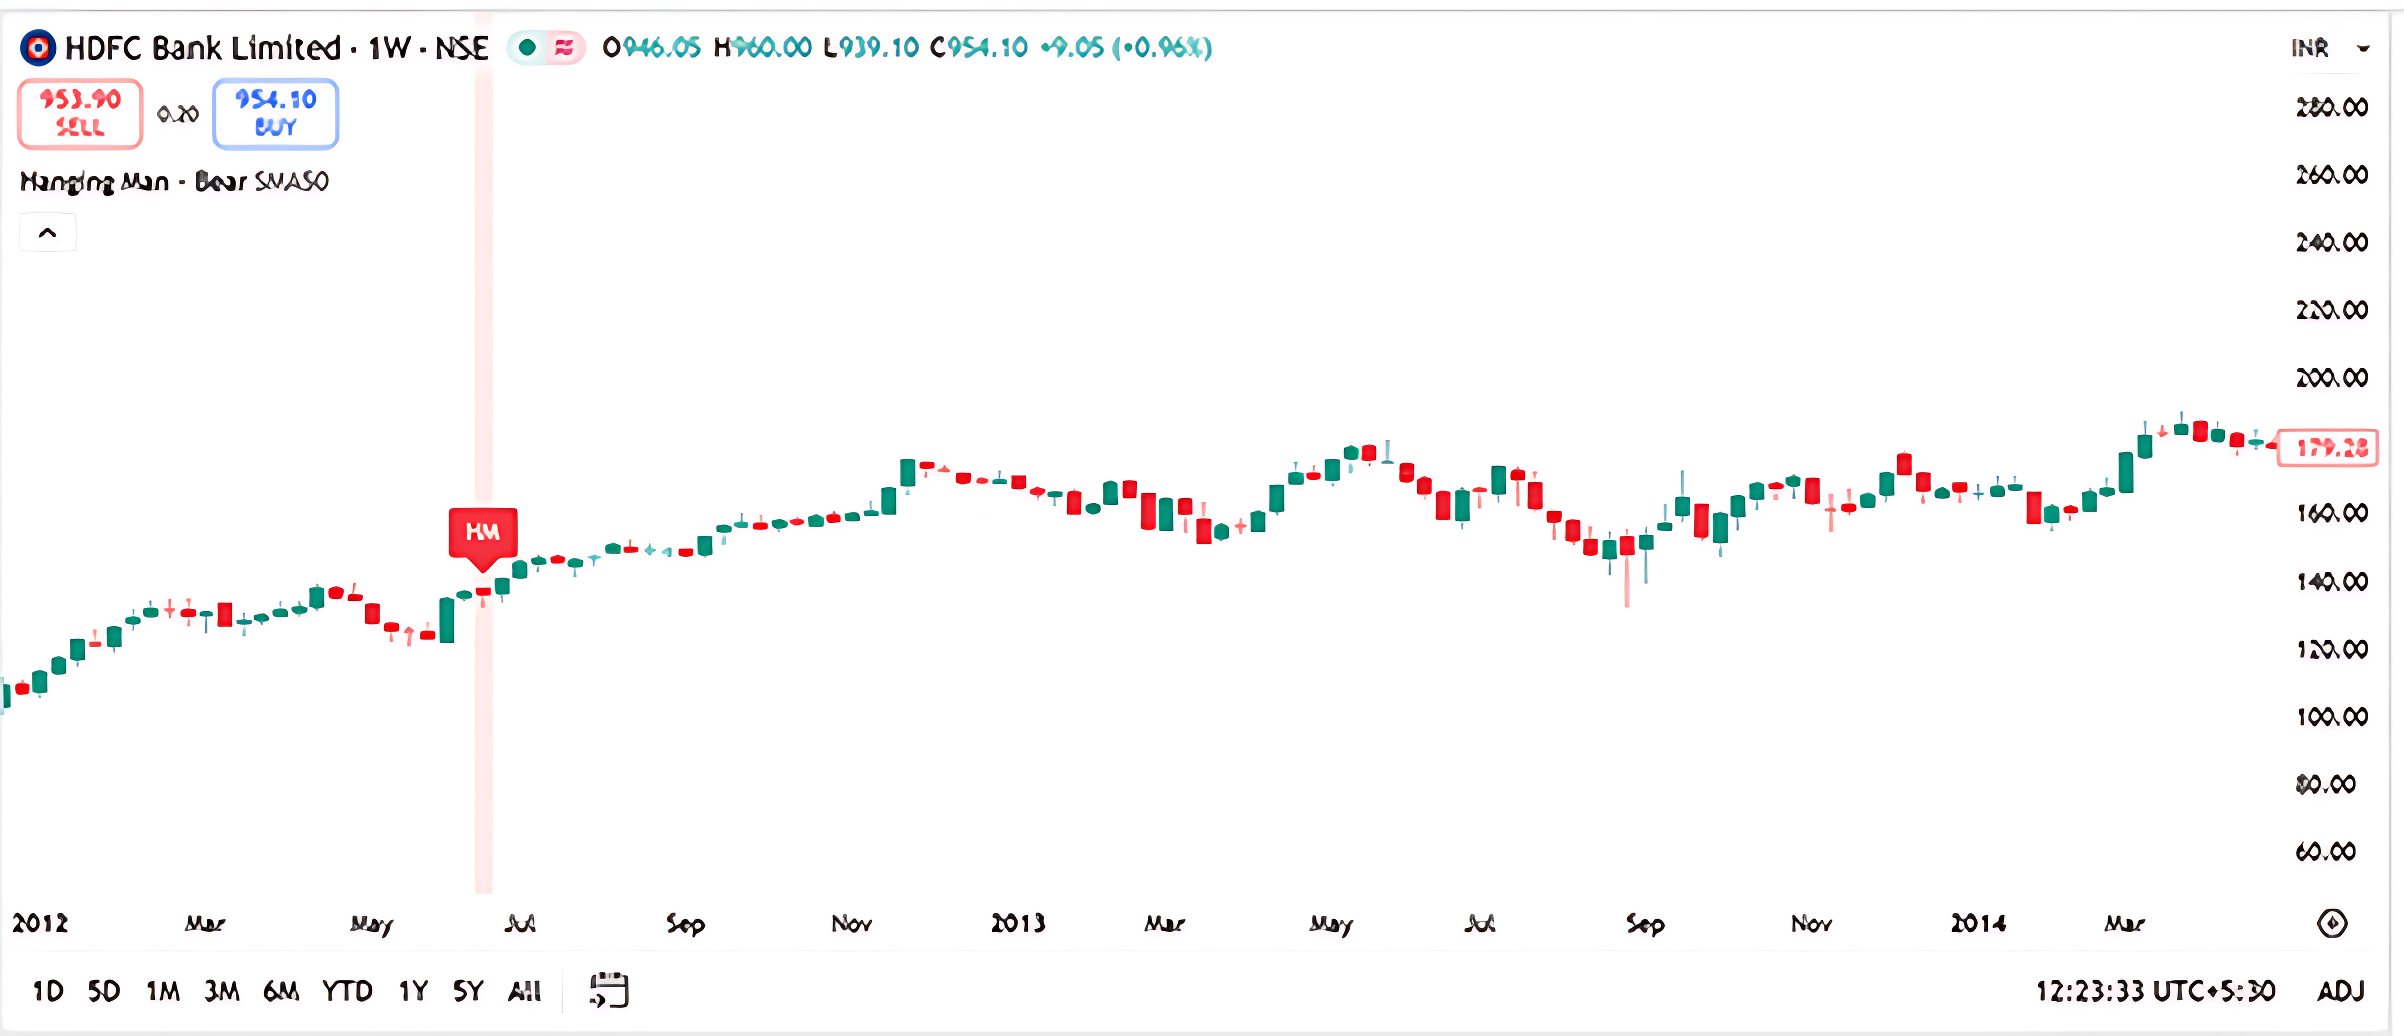
In May 2012, a Hanging Man candlestick pattern appeared on HDFC Bank’s weekly chart. The price opened at ₹151.20 and closed at ₹154.20, with a small body and a long lower shadow—classic signs of potential bearish reversal.
Exercise Prompt: Imagine you’re a trader who has been riding the uptrend. You spot the Hanging Man after several bullish weeks.
Question: Based on this pattern and its context, what would be your most prudent next step?
- A) Exit immediately, assuming a reversal is guaranteed
- B) Add more long positions, expecting the trend to continue
- C) Wait for confirmation from the next candle before making a decision
- D) Short the stock aggressively
Correct Answer:
- C) Wait for confirmation from the next candle before making a decision Why:The Hanging Man suggests potential weakness, but confirmation e.g., a bearish candle next week is essential before acting. Here your cautious approach reflects sound trading psychology.
7.4 Shooting Star Candlestick Pattern
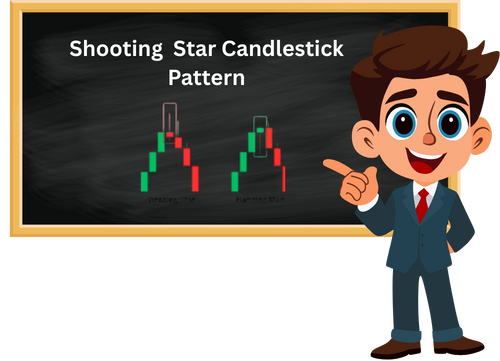
The Shooting Star is a bearish reversal candlestick pattern that typically appears at the end of an uptrend. It has a small real body near the bottom of the candle and a long upper shadow, usually at least twice the length of the body, indicating that buyers pushed the price significantly higher during the session, but sellers regained control and forced it back down near the opening level. This shift in momentum suggests that the bullish strength may be fading, and a potential reversal could be on the horizon.

For the pattern to be valid, the Shooting Star must occur after a sustained upward move, ideally with increasing volume. The colour of the candle is less important than its structure and placement. What matters is the rejection of higher prices, which is visually captured by the long upper wick. Traders often wait for confirmation in the form of a bearish candle on the following day or week, one that closes below the Shooting Star’s low to validate the reversal signal before initiating a short position.
Once confirmed, the trade setup typically involves entering a short position below the Shooting Star’s low, with a stoploss placed just above its high. This protects against false signals and limits risk. The Shooting Star is especially powerful when it appears near resistance zones or after an extended rally, as it reflects exhaustion among buyers. However, like all candlestick patterns, it should be used in conjunction with other indicators or price action analysis to improve reliability and avoid premature trades.

- Open: 1,238.75
- High: 1,297.10
- Low: 1,237.95
- Close: 1,295
The Shooting Star candlestick highlighted on the Nifty 50 weekly chart dated 4th August 1997 is an example of a bearish reversal signal. It appears after a short-term uptrend, with the candle’s long upper wick indicating that bulls initially pushed prices higher during the week, but were ultimately overpowered by bears who drove the price back down near its opening level. This rejection of higher prices suggests waning bullish momentum and potential for a trend reversal. The small real body near the candle’s low reinforces the bearish sentiment, especially when it forms near a resistance zone or after a sustained rally.
Looking at the weekly Nifty 50 chart from August 1997, the Shooting Star candlestick stands out as a potential bearish reversal signal. It forms after a short-term uptrend and is characterized by a long upper wick and a small real body near the candle’s low, indicating that buyers initially pushed prices higher but were ultimately overwhelmed by sellers. This rejection of higher prices suggests weakening bullish momentum.
Now, how do Arjun and Aakash respond?
Arjun, the risk taker, doesn’t wait for tomorrow. He acts on the same day the Shooting Star forms, but only after validating two things: first, that the current market price is hovering near the day’s low i.e. 1237.95 and second, that the upper shadow is at least twice the size of the real body. He’s betting on a reversal and is willing to take the heat if it doesn’t play out.
Aakash, on the other hand, waits for confirmation. He watches the next day’s candle closely. If it’s a red candle, meaning the price closes lower than it opens—he takes that as a sign that the reversal is real. Only then does he enter the short trade, ideally near the close of that second day. His stop-loss is also placed at 1297.10, just like Arjun’s.
Once either trader enters the trade, the rule is simple: don’t interfere. No second-guessing, no premature exits. The trade is valid until either the stop-loss is hit or the target is achieved. If the stop-loss is triggered, the trader must exit without hesitation, the setup has failed, and staying in the trade could lead to unnecessary losses. This discipline is what separates a strategy from a gamble.
Both traders recognize the significance of the Shooting Star, but their actions diverge based on their tolerance for uncertainty. Arjun seeks early entry and fast gains, while Aakash waits for confirmation and prefers a more calculated approach. This divergence beautifully illustrates how the same technical signal can lead to different strategies depending on the trader’s psychology and risk profile.
Small Activity for you

Scenario: In the week of November 2012, a Shooting Star candlestick appears on the chart after a bullish run. The candle has a small body and a long upper shadow, suggesting rejection of higher prices.
Prompt: You’re a trader who has been holding long positions. After spotting this Shooting Star, what’s the most disciplined next step?
Choose the best response:
- A) Exit all positions immediately
- B) Wait for a bearish confirmation candle next week
- C) Add more long positions expecting the trend to continue
- D) Ignore the signal—it’s just noise
Correct Answer:
- Wait for a bearish confirmation candle next week
Why: A Shooting Star signals potential reversal, but confirmation is key. A red candle following it strengthens the bearish case. You should observe before reacting.
7.5 Key Takeaways

- Paper Umbrella Pattern:
A candlestick with a small body on top and a long lower shadow (at least twice the body) – looks like an inverted umbrella. - Two Variants – Hammer & Hanging Man:
- Hammer:Appears after a downtrend → bullish reversal signal.
- Hanging Man:Appears after an uptrend → bearish reversal signal.
- Psychology of Paper Umbrella:
Shows sellers pushed price down during the session, but buyers pulled it back up before close, hinting at possible reversal. - Hammer Formation:
Appears at the bottom of a downtrend. Long lower shadow signals rejection of lower prices and potential bullish reversal. - Confirmation is Key:
Traders should wait for the next candle (preferably bullish after hammer, bearish after hanging man/shooting star) to confirm the reversal. - Risk Taker vs Risk Averse Strategies:
- Arjun (risk taker):Acts on the same day of pattern formation.
- Aakash (risk averse):Waits for next day’s candle for confirmation before entering.
- Stop-Loss Placement:
For Hammer – stop-loss is the low of the hammer candle.
For Hanging Man/Shooting Star – stop-loss is above the high of that candle. - Hanging Man Pattern:
Same shape as hammer but occurs at the top of an uptrend → signals weakening bullish momentum and potential reversal. - Shooting Star Pattern:
A bearish reversal signal appearing after an uptrend. Small body near the bottom with a long upper shadow shows buyers tried to push higher but sellers regained control. - Context Matters More than Shape:
A hammer or hanging man without a prior trend is invalid. Confirmation and trend context determine whether the pattern is reliable.