15.1 What is Fibonacci Retracement?
If you have ever looked at a price chart and wondered where the market might pause reverse, or pick up momentum again then you are not alone. One tool that traders often use is Fibonacci Retracement. Its rooted in centuries old mathematical sequence and its application in trading is surprisingly practical.
A technical analysis method called the Fibonacci Retracement is used to calculate how much a price may decline before moving back in its initial trend. Its foundation is the Fibonacci number sequence, which yields important ratios that traders utilize to pinpoint possible areas of support and resistance. The sequence yielded the following important ratios:
The Golden Ratio is 61.8%.
38.2%
23.6%
In an uptrend these ratios represent possible price zones where a bried drop could take place before the trend picks back up. To use the technique, a trader finds the chart’s most recent swing high and low, then projects these important levels using the Fibonacci Retracement Tool.
In an uptrend, these ratios represent possible price zones where a brief drop couldFibonacci Retracement is a way to measure how far a price might pull back before continuing in its original direction. It is based on the Fibonacci sequence which includes series of numbers where each number is the sum of two before it . E.g (0,1, 1, 2 ,3,5,8,13….).
Where
0,1 = (0+1) =1
1,1=(1+1)=2
1,2= (1+2)=3
2,3= (2+3)=5
3,5=(3+5)=8
8,13=(8+13)=21
So the full sequence looks like this:
0, 1, 1, 2, 3, 5, 8, 13, 21, 34, 55, 89, 144, 233, 377, 610, 987….
And the sequence goes on. This pattern was introduced by Leonardo of Pisa known as Fibonacci in the 13th Century.
15.2 What are Fibonacci Ratios?

When you divide a number in the Fibonacci series by its immediate predecessor, the result is consistently 1.618. This value is known as the Golden Ratio, or Phi.
Examples:
610 ÷ 377 = 1.618
377 ÷ 233 = 1.618
233 ÷ 144 = 1.618
This ratio appears frequently in nature—whether it’s the structure of flower petals, the proportions of the human face, or even the spirals of galaxies. While we won’t dive into those examples here, a quick online search for “Golden Ratio in nature” will reveal some fascinating insights.
Reverse Ratio: Preceding ÷ Current
If you flip the division, dividing a Fibonacci number by the one that follows, you get 0.618, which is 61.8% in percentage terms.
Examples:
89 ÷ 144 = 0.618
144 ÷ 233 = 0.618
377 ÷ 610 = 0.618
Two Steps Ahead
Dividing a Fibonacci number by the one two places ahead gives a consistent ratio of 0.382, or 38.2%.
Examples:
13 ÷ 34 = 0.382
21 ÷ 55 = 0.382
34 ÷ 89 = 0.382
Three Steps Ahead
Go three places forward in the series, and the ratio becomes 0.236, or 23.6%.
Examples:
13 ÷ 55 = 0.236
21 ÷ 89 = 0.236
34 ÷ 144 = 0.236
55 ÷ 233 = 0.236
These ratios 61.8%, 38.2%, and 23.6%, are foundational in Fibonacci retracement levels used in technical analysis. They help traders identify potential support and resistance zones with remarkable consistency.
So Why do these levels matter?
Think of market psychology. After every strong move, traders wait for a “discount” before re-entering. Fibonacci levels offer a structured way to anticipate where that discount might occur.
23.6% and 38.2%: Shallow retracements, often seen in strong trends.
50% and 61.8%: Deeper pullbacks, common in more volatile conditions.
78.6%: Last line of defence before the trend is considered broken.
These levels are reference points which helps traders to plan with more clarity. Fibonacci retracement isn’t about predicting the future, it’s about preparing for possibilities. Here’s how it helps:
Spotting Support and Resistance: These levels often align with areas where price has previously reacted, giving traders a heads-up on potential turning points.
Planning Entries and Exits: If price pulls back to a Fibonacci level and shows signs of reversal, traders may consider entering a trade. Similarly, these levels can guide stop-loss and target placement.
Adding Structure to Analysis: When used alongside other tools like moving averages or candlestick patterns, Fibonacci retracement adds another layer of insight.
15.3 Example of Fibonacci Retracement

Let’s say you’re analyzing Reliance Industries Ltd. (RELIANCE) stock. The price recently moved from ₹2,200 to ₹2,600 which is a strong uptrend. Now, the stock starts pulling back, and you want to identify potential support levels where it might bounce.
Step 1: Identify the Swing High and Swing Low
- Swing Low : ₹2,200
- Swing High : ₹2,600
- Difference:2,600-2,200= 400
You’ll apply Fibonacci retracement from the low to the high to find key levels where price might retrace before continuing upward.
Step 2: Apply Fibonacci Levels
The standard Fibonacci retracement levels are:
- 6%
- 2%
- 50%
- 8%
- 6%
Let’s calculate these retracement levels:
|
Level |
Calculation |
Price Level |
|
23.6% |
₹2,600 – (0.236 × ₹400) |
₹2,506.40 |
|
38.2% |
₹2,600 – (0.382 × ₹400) |
₹2,447.20 |
|
50% |
₹2,600 – (0.50 × ₹400) |
₹2,400.00 |
|
61.8% |
₹2,600 – (0.618 × ₹400) |
₹2,352.80 |
|
78.6% |
₹2,600 – (0.786 × ₹400) |
₹2,285.60 |
Step 3: Interpret the Levels
As the stock retraces from ₹2,600, you monitor how it behaves near these levels:
- If it bounces near ₹2,447 (38.2%), it suggests shallow retracement and strong bullish momentum.
- If it drops to ₹2,352 (61.8%) and then reverses, it’s a deeper pullback but still within healthy correction.
- If it breaks below ₹2,285 (78.6%), the uptrend may be weakening.
Step 4: Combine with Other Indicators
To improve accuracy, combine Fibonacci levels with:
- Volume spikes
- Candlestick patterns (e.g., bullish engulfing at 61.8%)
- RSI or MACD confirmation
Another Example
Look at the chart below
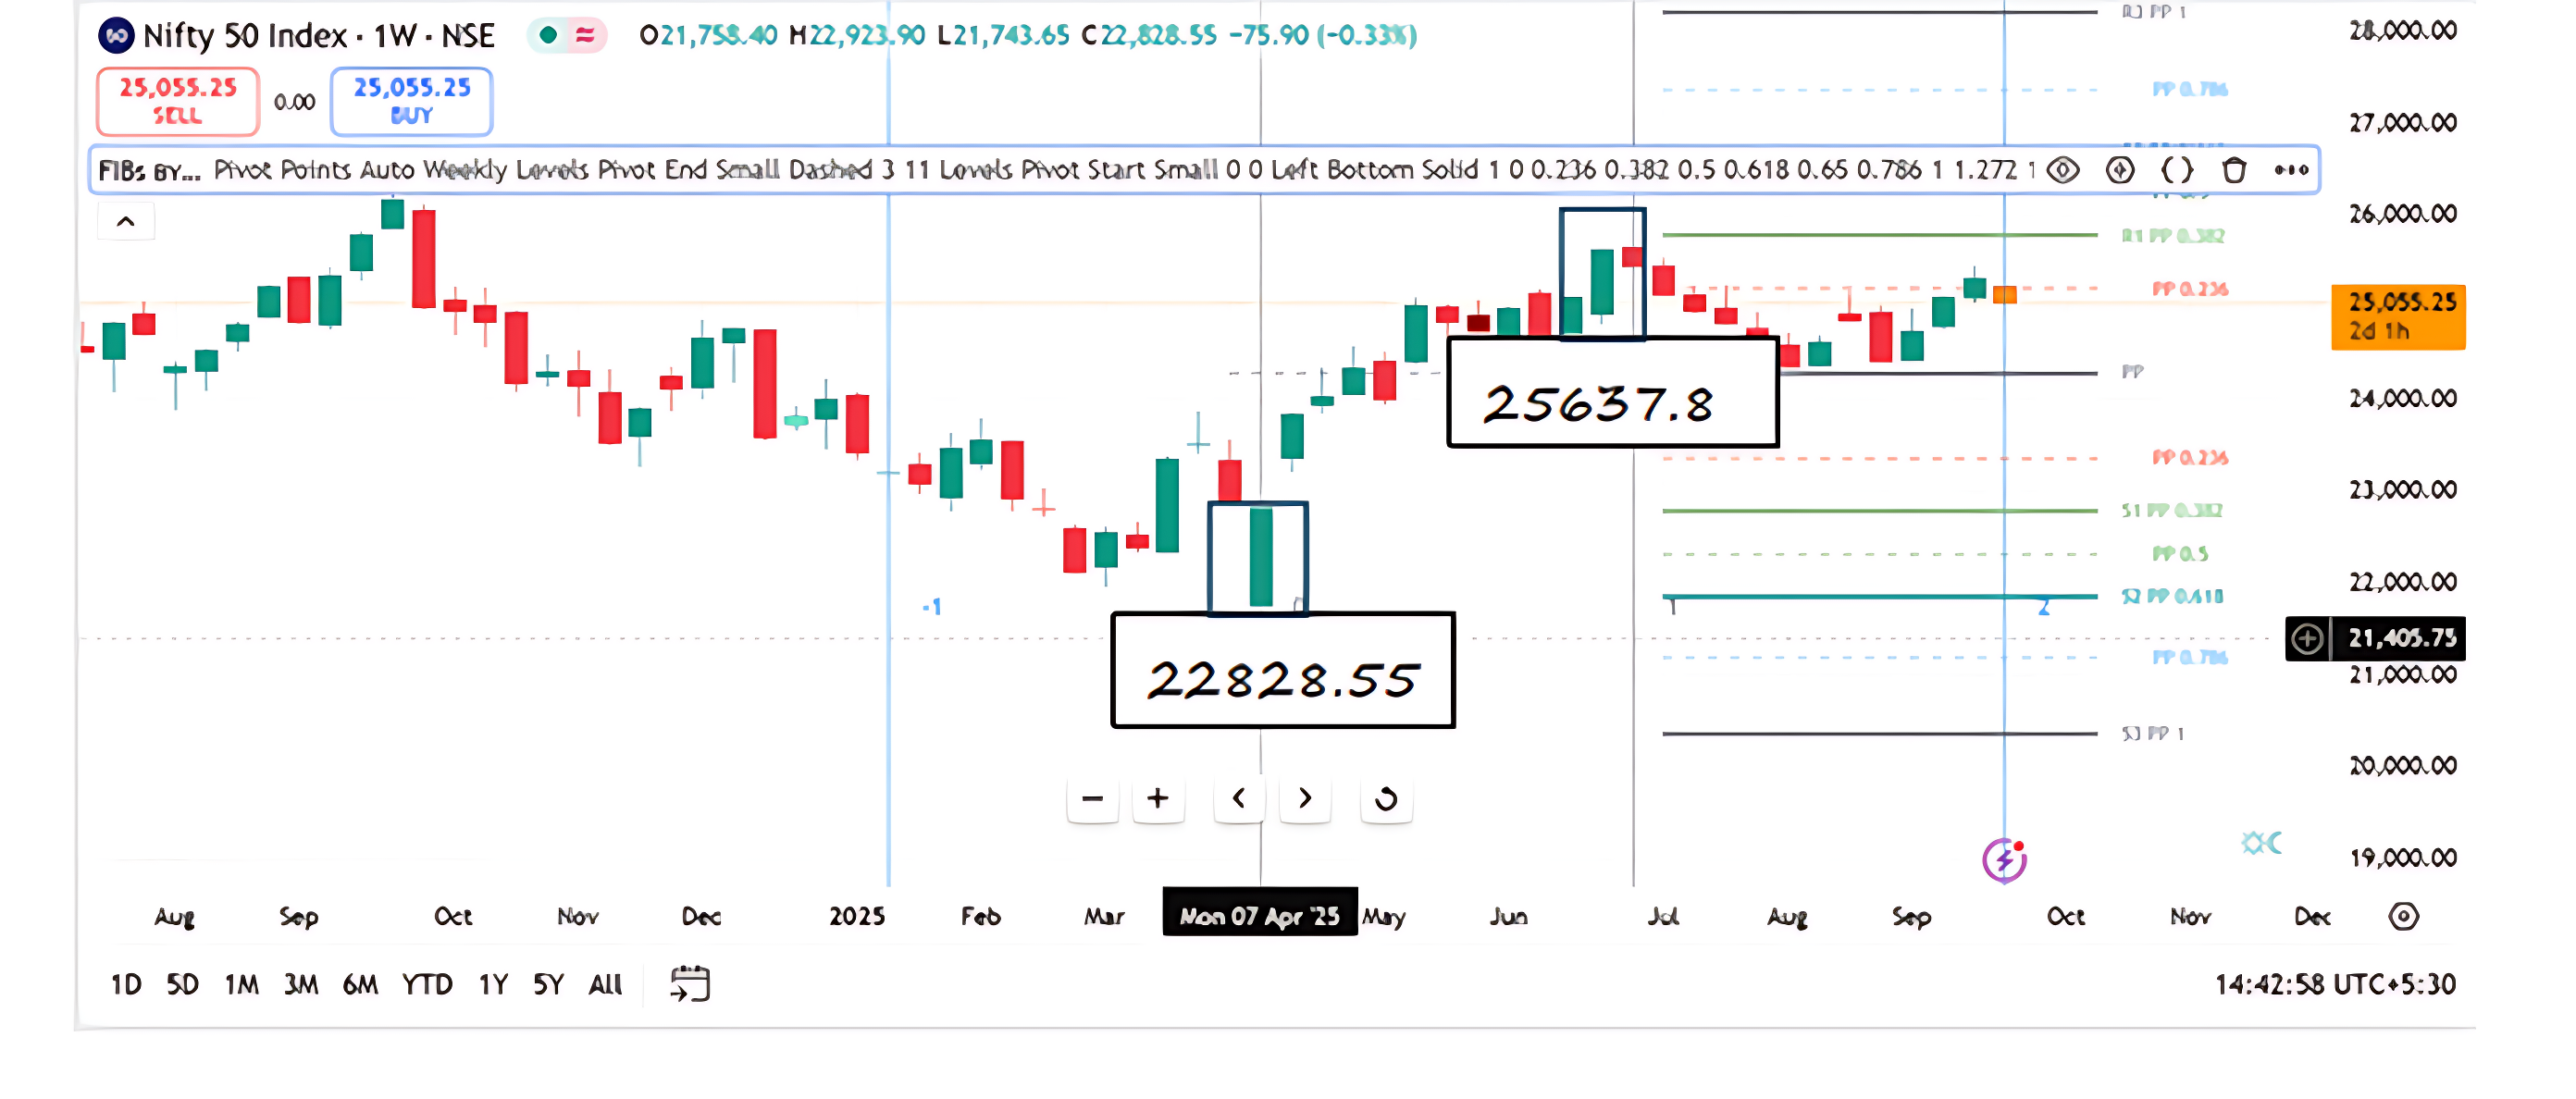
Identify Swing High and Swing Low from the Charts
From the first chart (latest weekly Nifty 50 chart):
- Swing Low: ₹22,828.55 (S3)
- Swing High: ₹25,637.80 (visible peak near R1)
This gives us a total upmove of:
₹25,637 − ₹22,828.55 = ₹2,808
Step 2: Calculate Fibonacci Retracement Levels
We now apply Fibonacci ratios to this upmove:
|
Ratio |
Calculation |
Retracement Level (from High) |
Price Level |
|
23.6% |
23.6% × ₹2,809.25 = ₹662.98 |
₹25,637.80 − ₹662.98 |
₹24,974.82 |
|
38.2% |
38.2% × ₹2,809.25 = ₹1,072.93 |
₹25,637.80 − ₹1,072.93 |
₹24,564.87 |
|
50.0% |
50.0% × ₹2,809.25 = ₹1,404.63 |
₹25,637.80 − ₹1,404.63 |
₹24,233.17 |
|
61.8% |
61.8% × ₹2,809.25 = ₹1,736.33 |
₹25,637.80 − ₹1,736.33 |
₹23,901.47 |
|
78.6% |
78.6% × ₹2,809.25 = ₹2,208.08 |
₹25,637.80 − ₹2,208.08 |
₹23,429.72 |
Interpreting the Retracement Zones
Let’s now interpret what these levels mean for a trader:
- ₹24,974.82 (23.6%): This is a shallow retracement. If Nifty pulls back only this far, it indicates strong bullish momentum. Traders may enter early here with tight stop-losses.
- ₹24,564.87 (38.2%): A moderate retracement. This level often acts as a first major support. If price stabilizes here, it’s a good zone for trend-following entries.
- ₹24,233.17 (50%): A psychological midpoint. Though not a Fibonacci ratio, many traders watch this level for confirmation of trend strength.
- ₹23,901.47 (61.8%): The golden ratio. If price retraces this far and holds, it’s a strong signal that the uptrend may resume. Many swing traders look for bullish reversal patterns here.
- ₹23,429.72 (78.6%): Deep retracement. If price reaches this level, the trend is at risk of reversal. Traders may wait for strong confirmation before entering.
Imagine Nifty as a spring stretched from ₹22,828 to ₹25,637. Before it can stretch further, it contracts—how much it contracts depends on market sentiment. The Fibonacci levels are like markers showing how far it might pull back before bouncing again.
15.4 How to Use Fibonacci Retracement Levels Effectively

Imagine you’ve been tracking a stock that suddenly surged upward, leaving you without a good entry point. Jumping in after a sharp rally can be risky—so instead, a smarter approach is to wait for a pullback. This is where Fibonacci retracement levels come into play.
Levels like 61.8%, 38.2%, and 23.6% serve as potential zones where the price might temporarily decline before resuming its trend. By plotting these levels on the chart, you can anticipate where the stock might stabilize—giving you a chance to enter the trade with better risk-reward alignment.
When used in conjunction with other trading signals and as part of a thorough checklist, Fibonacci Retracement works best. When a Fibonacci level coincides with a distinct candlestick pattern, a recognized support or resistance zone, and a rise in trading volume, it is considered a high conviction trade setting.
However, Fibonacci retracement should not be used in isolation. It’s most powerful when it supports other signals. Personally, I’d only consider entering a trade if the following conditions are met:
- The chart shows a clear candlestick pattern indicating reversal or continuation.
- The stop-loss level aligns with a known support or resistance zone.
- There’s a noticeable increase in trading volume, confirming interest.
If the Fibonacci level also matches the stop-loss zone, it adds another layer of confidence to the setup. That’s when I’d consider the trade a high-conviction opportunity, not because of the Fibonacci level alone, but because multiple factors are pointing in the same direction.
The same principle applies to short trades. If a stock has dropped sharply and begins to retrace upward, Fibonacci levels can help identify where the bounce might fade, offering a chance to enter a short position with precision.
Activity For You

- What does the 0.618 Fibonacci retracement level typically represent in technical analysis?
- A strong support or resistance zone
- The highest price of the stock
- The average trading volume
- A guaranteed reversal point
2. If HDFC Bank’s price pulls back from ₹951.00, which Fibonacci level is closest to ₹874.05?
- 0.786
- 0.5
- 0.236
- 0.382
3. Which of the following is NOT a standard Fibonacci retracement level?
- 0.618
- 0.75
- 0.382
- 0.5
Answers :
- A guaranteed reversal point
- 0.236
- 0.75
15.5 Key Takeaways

- Fibonacci Retracement is a technical analysis tool used to measure how far a price might pull back before continuing in its original direction. It is based on the Fibonacci sequence of numbers, where each number is the sum of the two preceding ones.
- The tool utilizes key ratios derived from the Fibonacci sequence, such as 61.8%, 38.2%, and 23.6%. These ratios serve as potential price zones where a temporary decline in price might occur before the trend resumes.
- Fibonacci retracement levels can be used to anticipate where a stock might stabilize during a pullback, providing a chance for traders to enter a trade with a better risk-to-reward ratio.
- It is crucial to not use Fibonacci retracement in isolation. It is most effective when it supports other trading signals and is part of a comprehensive checklist.
- For a high-conviction trade setup, the Fibonacci level should align with other confirmations, such as a clear candlestick pattern, a known support or resistance zone, and an increase in trading volume. This multi-layered confirmation strengthens a trader’s conviction and improves their odds.
- For short trades, Fibonacci levels help identify where an upward bounce might fade, offering a chance to enter a short position with greater precision.
15.1 What is Fibonacci Retracement?
If you have ever looked at a price chart and wondered where the market might pause reverse, or pick up momentum again then you are not alone. One tool that traders often use is Fibonacci Retracement. Its rooted in centuries old mathematical sequence and its application in trading is surprisingly practical.
A technical analysis method called the Fibonacci Retracement is used to calculate how much a price may decline before moving back in its initial trend. Its foundation is the Fibonacci number sequence, which yields important ratios that traders utilize to pinpoint possible areas of support and resistance. The sequence yielded the following important ratios:
The Golden Ratio is 61.8%.
38.2%
23.6%
In an uptrend these ratios represent possible price zones where a bried drop could take place before the trend picks back up. To use the technique, a trader finds the chart’s most recent swing high and low, then projects these important levels using the Fibonacci Retracement Tool.
In an uptrend, these ratios represent possible price zones where a brief drop couldFibonacci Retracement is a way to measure how far a price might pull back before continuing in its original direction. It is based on the Fibonacci sequence which includes series of numbers where each number is the sum of two before it . E.g (0,1, 1, 2 ,3,5,8,13….).
Where
0,1 = (0+1) =1
1,1=(1+1)=2
1,2= (1+2)=3
2,3= (2+3)=5
3,5=(3+5)=8
8,13=(8+13)=21
So the full sequence looks like this:
0, 1, 1, 2, 3, 5, 8, 13, 21, 34, 55, 89, 144, 233, 377, 610, 987….
And the sequence goes on. This pattern was introduced by Leonardo of Pisa known as Fibonacci in the 13th Century.
15.2 What are Fibonacci Ratios?
When you divide a number in the Fibonacci series by its immediate predecessor, the result is consistently 1.618. This value is known as the Golden Ratio, or Phi.
Examples:
610 ÷ 377 = 1.618
377 ÷ 233 = 1.618
233 ÷ 144 = 1.618
This ratio appears frequently in nature—whether it’s the structure of flower petals, the proportions of the human face, or even the spirals of galaxies. While we won’t dive into those examples here, a quick online search for “Golden Ratio in nature” will reveal some fascinating insights.
Reverse Ratio: Preceding ÷ Current
If you flip the division, dividing a Fibonacci number by the one that follows, you get 0.618, which is 61.8% in percentage terms.
Examples:
89 ÷ 144 = 0.618
144 ÷ 233 = 0.618
377 ÷ 610 = 0.618
Two Steps Ahead
Dividing a Fibonacci number by the one two places ahead gives a consistent ratio of 0.382, or 38.2%.
Examples:
13 ÷ 34 = 0.382
21 ÷ 55 = 0.382
34 ÷ 89 = 0.382
Three Steps Ahead
Go three places forward in the series, and the ratio becomes 0.236, or 23.6%.
Examples:
13 ÷ 55 = 0.236
21 ÷ 89 = 0.236
34 ÷ 144 = 0.236
55 ÷ 233 = 0.236
These ratios 61.8%, 38.2%, and 23.6%, are foundational in Fibonacci retracement levels used in technical analysis. They help traders identify potential support and resistance zones with remarkable consistency.
So Why do these levels matter?
Think of market psychology. After every strong move, traders wait for a “discount” before re-entering. Fibonacci levels offer a structured way to anticipate where that discount might occur.
23.6% and 38.2%: Shallow retracements, often seen in strong trends.
50% and 61.8%: Deeper pullbacks, common in more volatile conditions.
78.6%: Last line of defence before the trend is considered broken.
These levels are reference points which helps traders to plan with more clarity. Fibonacci retracement isn’t about predicting the future, it’s about preparing for possibilities. Here’s how it helps:
Spotting Support and Resistance: These levels often align with areas where price has previously reacted, giving traders a heads-up on potential turning points.
Planning Entries and Exits: If price pulls back to a Fibonacci level and shows signs of reversal, traders may consider entering a trade. Similarly, these levels can guide stop-loss and target placement.
Adding Structure to Analysis: When used alongside other tools like moving averages or candlestick patterns, Fibonacci retracement adds another layer of insight.
15.3 Example of Fibonacci Retracement
Let’s say you’re analyzing Reliance Industries Ltd. (RELIANCE) stock. The price recently moved from ₹2,200 to ₹2,600 which is a strong uptrend. Now, the stock starts pulling back, and you want to identify potential support levels where it might bounce.
Step 1: Identify the Swing High and Swing Low
- Swing Low : ₹2,200
- Swing High : ₹2,600
- Difference:2,600-2,200= 400
You’ll apply Fibonacci retracement from the low to the high to find key levels where price might retrace before continuing upward.
Step 2: Apply Fibonacci Levels
The standard Fibonacci retracement levels are:
- 6%
- 2%
- 50%
- 8%
- 6%
Let’s calculate these retracement levels:
|
Level |
Calculation |
Price Level |
|
23.6% |
₹2,600 – (0.236 × ₹400) |
₹2,506.40 |
|
38.2% |
₹2,600 – (0.382 × ₹400) |
₹2,447.20 |
|
50% |
₹2,600 – (0.50 × ₹400) |
₹2,400.00 |
|
61.8% |
₹2,600 – (0.618 × ₹400) |
₹2,352.80 |
|
78.6% |
₹2,600 – (0.786 × ₹400) |
₹2,285.60 |
Step 3: Interpret the Levels
As the stock retraces from ₹2,600, you monitor how it behaves near these levels:
- If it bounces near ₹2,447 (38.2%), it suggests shallow retracement and strong bullish momentum.
- If it drops to ₹2,352 (61.8%) and then reverses, it’s a deeper pullback but still within healthy correction.
- If it breaks below ₹2,285 (78.6%), the uptrend may be weakening.
Step 4: Combine with Other Indicators
To improve accuracy, combine Fibonacci levels with:
- Volume spikes
- Candlestick patterns (e.g., bullish engulfing at 61.8%)
- RSI or MACD confirmation
Another Example
Look at the chart below
Identify Swing High and Swing Low from the Charts
From the first chart (latest weekly Nifty 50 chart):
- Swing Low: ₹22,828.55 (S3)
- Swing High: ₹25,637.80 (visible peak near R1)
This gives us a total upmove of:
₹25,637 − ₹22,828.55 = ₹2,808
Step 2: Calculate Fibonacci Retracement Levels
We now apply Fibonacci ratios to this upmove:
|
Ratio |
Calculation |
Retracement Level (from High) |
Price Level |
|
23.6% |
23.6% × ₹2,809.25 = ₹662.98 |
₹25,637.80 − ₹662.98 |
₹24,974.82 |
|
38.2% |
38.2% × ₹2,809.25 = ₹1,072.93 |
₹25,637.80 − ₹1,072.93 |
₹24,564.87 |
|
50.0% |
50.0% × ₹2,809.25 = ₹1,404.63 |
₹25,637.80 − ₹1,404.63 |
₹24,233.17 |
|
61.8% |
61.8% × ₹2,809.25 = ₹1,736.33 |
₹25,637.80 − ₹1,736.33 |
₹23,901.47 |
|
78.6% |
78.6% × ₹2,809.25 = ₹2,208.08 |
₹25,637.80 − ₹2,208.08 |
₹23,429.72 |
Interpreting the Retracement Zones
Let’s now interpret what these levels mean for a trader:
- ₹24,974.82 (23.6%): This is a shallow retracement. If Nifty pulls back only this far, it indicates strong bullish momentum. Traders may enter early here with tight stop-losses.
- ₹24,564.87 (38.2%): A moderate retracement. This level often acts as a first major support. If price stabilizes here, it’s a good zone for trend-following entries.
- ₹24,233.17 (50%): A psychological midpoint. Though not a Fibonacci ratio, many traders watch this level for confirmation of trend strength.
- ₹23,901.47 (61.8%): The golden ratio. If price retraces this far and holds, it’s a strong signal that the uptrend may resume. Many swing traders look for bullish reversal patterns here.
- ₹23,429.72 (78.6%): Deep retracement. If price reaches this level, the trend is at risk of reversal. Traders may wait for strong confirmation before entering.
Imagine Nifty as a spring stretched from ₹22,828 to ₹25,637. Before it can stretch further, it contracts—how much it contracts depends on market sentiment. The Fibonacci levels are like markers showing how far it might pull back before bouncing again.
15.4 How to Use Fibonacci Retracement Levels Effectively
Imagine you’ve been tracking a stock that suddenly surged upward, leaving you without a good entry point. Jumping in after a sharp rally can be risky—so instead, a smarter approach is to wait for a pullback. This is where Fibonacci retracement levels come into play.
Levels like 61.8%, 38.2%, and 23.6% serve as potential zones where the price might temporarily decline before resuming its trend. By plotting these levels on the chart, you can anticipate where the stock might stabilize—giving you a chance to enter the trade with better risk-reward alignment.
When used in conjunction with other trading signals and as part of a thorough checklist, Fibonacci Retracement works best. When a Fibonacci level coincides with a distinct candlestick pattern, a recognized support or resistance zone, and a rise in trading volume, it is considered a high conviction trade setting.
However, Fibonacci retracement should not be used in isolation. It’s most powerful when it supports other signals. Personally, I’d only consider entering a trade if the following conditions are met:
- The chart shows a clear candlestick pattern indicating reversal or continuation.
- The stop-loss level aligns with a known support or resistance zone.
- There’s a noticeable increase in trading volume, confirming interest.
If the Fibonacci level also matches the stop-loss zone, it adds another layer of confidence to the setup. That’s when I’d consider the trade a high-conviction opportunity, not because of the Fibonacci level alone, but because multiple factors are pointing in the same direction.
The same principle applies to short trades. If a stock has dropped sharply and begins to retrace upward, Fibonacci levels can help identify where the bounce might fade, offering a chance to enter a short position with precision.
Activity For You
- What does the 0.618 Fibonacci retracement level typically represent in technical analysis?
- A strong support or resistance zone
- The highest price of the stock
- The average trading volume
- A guaranteed reversal point
2. If HDFC Bank’s price pulls back from ₹951.00, which Fibonacci level is closest to ₹874.05?
- 0.786
- 0.5
- 0.236
- 0.382
3. Which of the following is NOT a standard Fibonacci retracement level?
- 0.618
- 0.75
- 0.382
- 0.5
Answers :
- A guaranteed reversal point
- 0.236
- 0.75
15.5 Key Takeaways
- Fibonacci Retracement is a technical analysis tool used to measure how far a price might pull back before continuing in its original direction. It is based on the Fibonacci sequence of numbers, where each number is the sum of the two preceding ones.
- The tool utilizes key ratios derived from the Fibonacci sequence, such as 61.8%, 38.2%, and 23.6%. These ratios serve as potential price zones where a temporary decline in price might occur before the trend resumes.
- Fibonacci retracement levels can be used to anticipate where a stock might stabilize during a pullback, providing a chance for traders to enter a trade with a better risk-to-reward ratio.
- It is crucial to not use Fibonacci retracement in isolation. It is most effective when it supports other trading signals and is part of a comprehensive checklist.
- For a high-conviction trade setup, the Fibonacci level should align with other confirmations, such as a clear candlestick pattern, a known support or resistance zone, and an increase in trading volume. This multi-layered confirmation strengthens a trader’s conviction and improves their odds.
- For short trades, Fibonacci levels help identify where an upward bounce might fade, offering a chance to enter a short position with greater precision.


