13.1 Understanding the ‘Moving’ Average
During school days, it’s likely that we’ve learn’t about averagesand moving averages are merely a step further. Moving averages are trend indicators in technical analysis, and they are used frequently because they’re simple and effective.
Moving averages are trend indicators that help determine the underlying trend by smoothing outprice data over a given time period. The idea is straightforward: figure out the average closing price over a predetermined period of time.
The term “moving” refers to the process of dropping the oldest data point in order to maintain the average current as a new day’s closing price is added.
Simple Moving Average: The Simple Moving Average assigns each data point in the computation an identical weight.
Exponential Moving Average (EMA):
Compared to the Simple Moving Average, the Exponential Moving Average is more sensitive to fresh information and responds to price changes faster because it places greater weight on recent prices. For this reason, traders frequently favor EMA over SMA.
Before we jump into moving averages, let’s do a quick refresher on how to calculate basic average.
Monthly Average Restaurant Expense
Assume that Ramesh keeps track of how much he spends on eating out on average each week:
Week Amount Spent (₹)
Week 1 ₹800
Week 2 ₹1,200
Week 3 ₹600
Week 4 ₹1,400
To find the average monthly expense, he adds each of the weekly amounts, and divides that total by the number of weeks:
Average = (₹800 + ₹1,200 + ₹600 + ₹1,400) ÷ 4 = ₹4,000 ÷ 4 = ₹1,000
Thus, Ramesh has spent an average of ₹1,000 a week on restaurants.
Here,we get a general idea from the average how much Ramesh typically spends each week on eating out. Obviously, there were weeks when he had spent more than average and weeks when he had spent less. For instance In Week 4 he had spent ₹1,400, significantly more than the average of ₹1,000 and at Week 3 had spent just ₹600 which was much lower than the average. This illustrates that the average is merely an estimate which helps to summarize the data but does not fully account for the full range of spending. Therefore, Ramesh did not spend exactly ₹1,000 every week, despite the fact that that is the average weekly expense.
Now, let’s connect this to the stock market. In trading, we apply the same logic to prices or volumes. Instead of calculating how much Ramesh spends, we calculate the average closing price of a stock over a set number of days. This is called a moving average, and it helps traders smooth out short-term fluctuations to identify trends more clearly.
Extending the Concept to Stock Prices
Let’s apply the Idea of averages to the stock market. Suppose we’re looking at the closing prices of Larsen & Toubro (L&T) over the last 5 trading sessions. Just like we calculated the average number of Ramesh spending every week, we’ll now calculate the average closing price of a stock.
Here are the closing prices for L&T:
|
Day |
Closing Price (₹) |
|
Day 1 |
₹3,120.50 |
|
Day 2 |
₹3,145.75 |
|
Day 3 |
₹3,110.20 |
|
Day 4 |
₹3,135.60 |
|
Day 5 |
₹3,160.40 |
Total = ₹3,120.50 + ₹3,145.75 + ₹3,110.20 + ₹3,135.60 + ₹3,160.40 = ₹15,672.45
To find the 5-day average closing price, we divide the total by 5:
Average = ₹15,672.45 ÷ 5 = ₹3,134.49
So, the average closing price of L&T over the last 5 trading sessions is ₹3,134.49.
This average helps traders smooth out daily price fluctuations and get a clearer sense of the stock’s short-term trend. In technical analysis, this forms the basis of moving averages, which are calculated continuously as new data comes in.
13.1 – Understanding the ‘Moving’ Average (Simple Moving Average)
Let’s say you want to calculate the average closing price of Tata Consumer Products over the latest 5 trading sessions. Here are the closing prices:
|
Date |
Closing Price (₹) |
|
01/08/25 |
₹875.20 |
|
04/08/25 |
₹878.50 |
|
05/08/25 |
₹880.10 |
|
06/08/25 |
₹882.40 |
|
07/08/25 |
₹884.30 |
Total = ₹875.20 + ₹878.50 + ₹880.10 + ₹882.40 + ₹884.30 = ₹4,400.50
To find the 5-day average closing price, divide the total by 5:
Average = ₹4,400.50 ÷ 5 = ₹880.10
So, the average closing price of Tata Consumer over these 5 sessions is ₹880.10.
Now What It is a “Moving” Average?
Let’s say the next trading day is 08/08/25. A new closing price is available: ₹886.50.
To keep the average updated, we include this new data point and drop the oldest one (01/08/25). The new set of dates becomes:
|
Date |
Closing Price (₹) |
|
04/08/25 |
₹878.50 |
|
05/08/25 |
₹880.10 |
|
06/08/25 |
₹882.40 |
|
07/08/25 |
₹884.30 |
|
08/08/25 |
₹886.50 |
New Total = ₹4,411.80
New Average = ₹4,411.80 ÷ 5 = ₹882.36
As you can see, we’ve moved forward by including the latest closing price and excluding the oldest one. This process continues each day, always using the most recent 5 data points. That’s why it’s called a “moving” average, because it shifts forward with each new trading session.
In the above example the moving average is calculated using closing prices which are commonly preferred by traders and investors. The closing price represents the final value at which the stock trades for the day which makes it a reliable indicator of market sentiment. While closing prices are used most frequently , moving averages also can be computed using other data points such as OHL data which means opening, High and Low prices depending on the specific analysis or strategy. Moving averages are highly flexible and can be applied across various time frames.
For those who frequently use excel can calculate average within minutes. Observe how the cell reference moves in the average formula, eliminating the oldest to include the latest data points. Here is a screenshot of excel calculation.
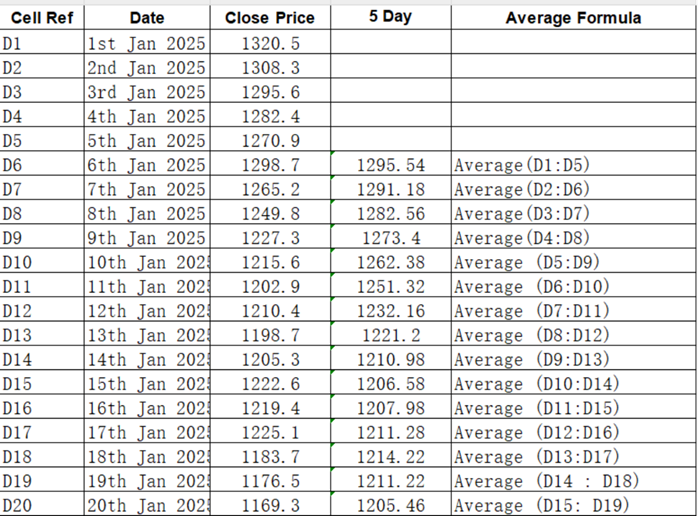
The moving average adjusts dynamically with each new closing price, reflecting the latest market trends. This type of average is known as a Simple Moving Average (SMA). When calculated using the most recent five days of data, it’s specifically referred to as the 5-Day SMA.
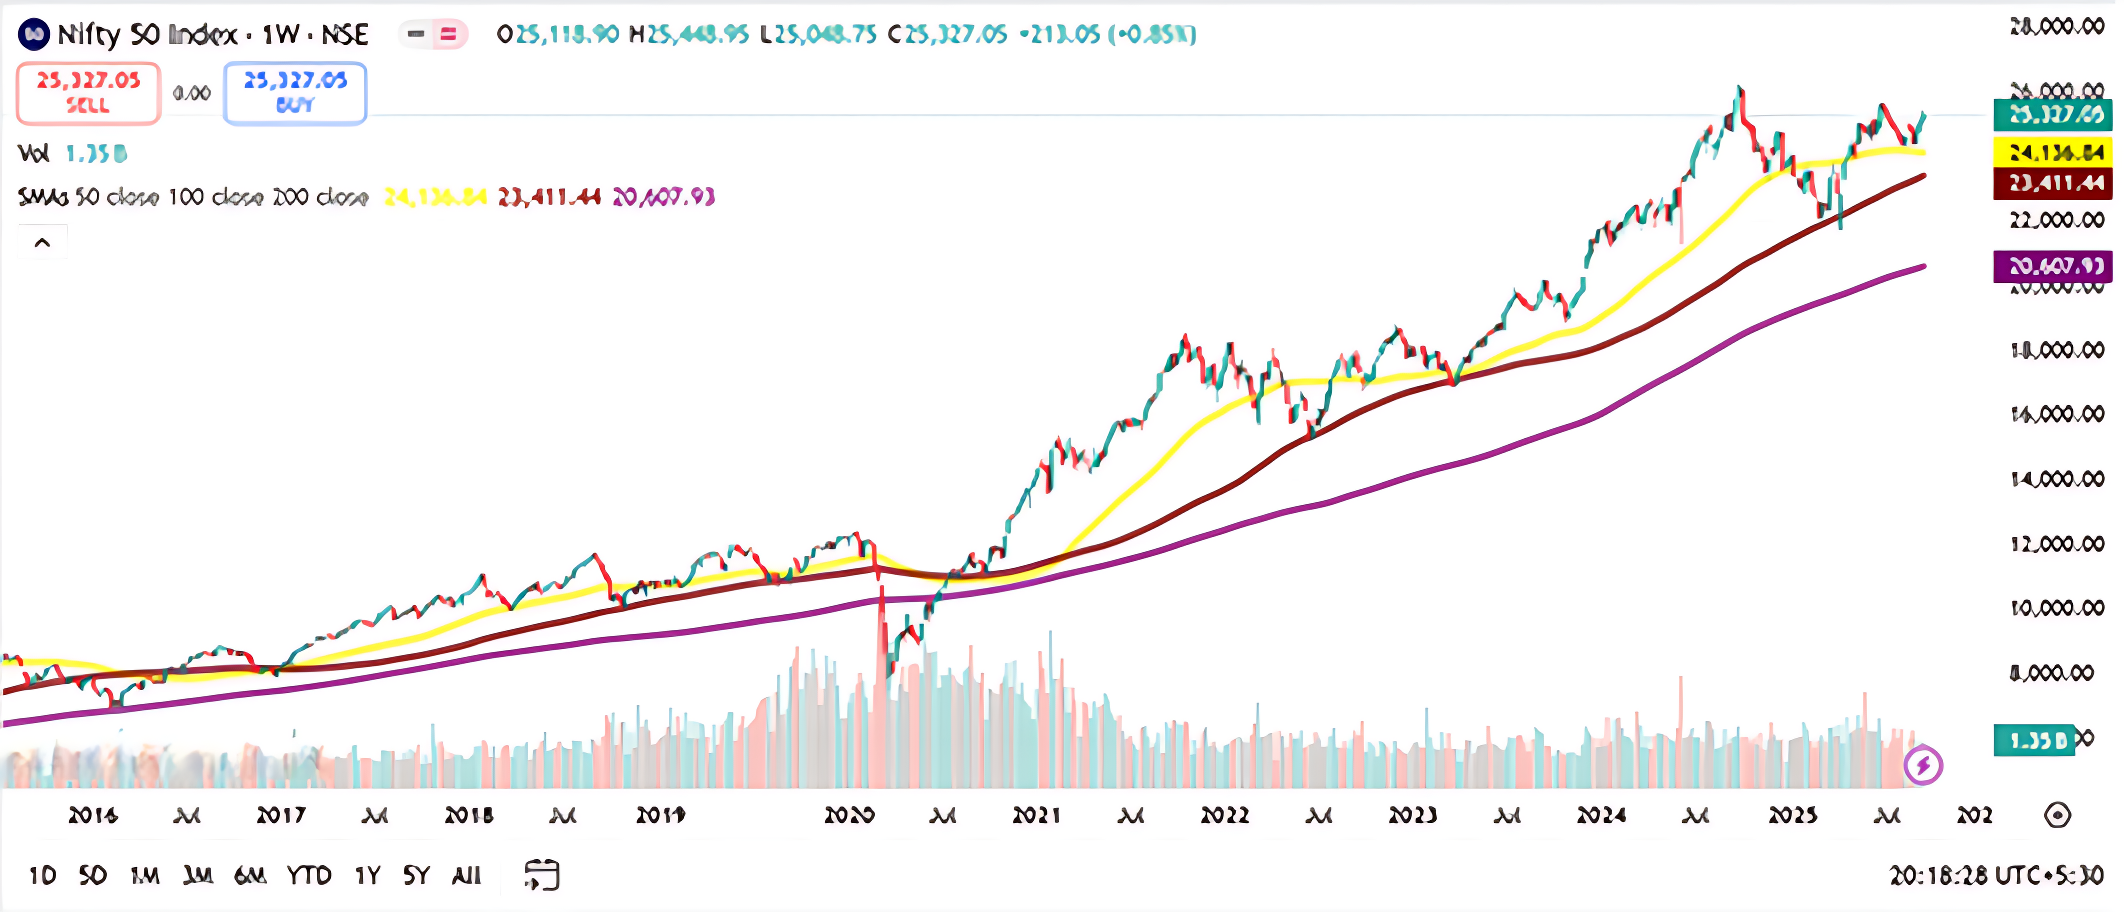
By computing averages over a set number of days, commonly 5, 10, 50, 100, or 200—the resulting values can be plotted to create a smooth, flowing line called the moving average line. This line evolves continuously over time, offering a clearer view of price direction and helping to filter out short-term fluctuations.
Here is a chart which shows 50, 100 and 200 days Simple Moving Average is plotted.
What does a moving average tell us, and how is it used? In fact, moving averages have a wide range of applications in financial analysis and trading. Now it’s important to understand another powerful variation—the Exponential Moving Average.
Activity for You

The current price is ₹930.65, which is above the SMA 100 (₹854.14) and SMA 200 (₹809.32), and equal to the SMA 50.
Question: If you’re a trader and you observe the price staying above all three SMAs, what could this indicate?
- A) Weak market momentum
- B) Potential continuation of bullish trend
- C) Imminent breakdown
- D) No relevance to trend
Correct Answer: B) Potential continuation of bullish trend
Why: When the price remains above the SMA 50, SMA 100, and SMA 200, it typically signals strength and supports the possibility of an ongoing uptrend.
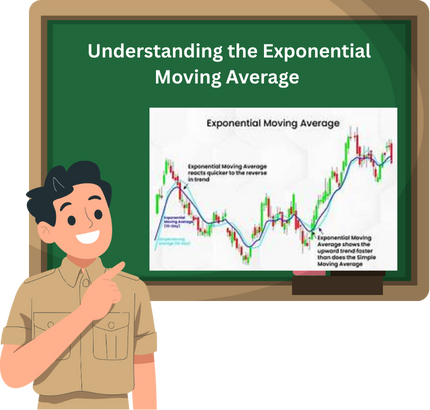
13.2 Understanding the Exponential Moving Average (EMA)
Let’s consider a fresh set of closing prices:
|
Date |
Closing Price |
|
22/07/14 |
310.5 |
|
23/07/14 |
312.8 |
|
24/07/14 |
315.2 |
|
25/07/14 |
318.6 |
|
28/07/14 |
320.9 |
|
Total |
1,578.0 |
When we calculate a simple average of these values, we’re assuming each data point carries equal weight. That means the price on 22nd July is treated as just as important as the price on 28th July. But in the context of financial markets, this assumption doesn’t always hold.
One of the key principles of technical analysis is that markets discount everything, meaning the most recent price reflects all known and unknown information. As a result, the latest price i.e 28th July is considered more significant than earlier ones.
To account for this, we assign greater weight to newer data points. So, the closing price on 28th July receives the highest weight, followed by 25th July, then 24th July, and so on. This approach emphasizes recent market behavior while still considering historical data.
By applying these weights, we create a scaled average where newer prices have more influence. The result is the Exponential Moving Average (EMA), a refined version of the moving average that responds more quickly to price changes.
Calculation of Exponential Moving Average
The Exponential Moving Average (EMA) is a type of moving average that gives more weight to recent prices, making it more responsive to new information than the Simple Moving Average (SMA). It’s widely used in technical analysis to identify trends.
The formula for EMA is:
EMAt = (Pt×K) +(EMAt−1×(1−K))
Where:
- EMAt= EMA today
- Pt= Price today
- EMAt−1=EMA yesterday
- K = Smoothing constant = 2/N+1
- N = Number of periods
Example Using Indian Stock: Infosys Ltd (INFY)
Let’s say we want to calculate the 10-day EMA for Infosys stock.
Step 1: Get the last 10 closing prices :
|
Day |
Closing Price (₹) |
|
1 |
1,450 |
|
2 |
1,460 |
|
3 |
1,455 |
|
4 |
1,470 |
|
5 |
1,465 |
|
6 |
1,475 |
|
7 |
1,480 |
|
8 |
1,490 |
|
9 |
1,495 |
|
10 |
1,500 |
Step 2: Calculate the 10-day SMA (used as the first EMA value):
SMA=1450+1460+1455+ 1470+1465+1475+1480+1490+1495+1500/10= ₹1,474
Step 3: Calculate the multiplier:
K=2/10+1
=0.1818
Step 4: Calculate EMA for Day 11 (assuming closing price is ₹1,510):
EMAt = (Pt×K) +(EMAt−1×(1−K)
EMA11= (1510×0.1818) + (1474×0.8182) = ₹1,480.5
If the EMA is rising, it suggests a bullish trend. Traders often use crossovers (e.g., 10-day EMA crossing above 50-day EMA) as buy/sell signals.
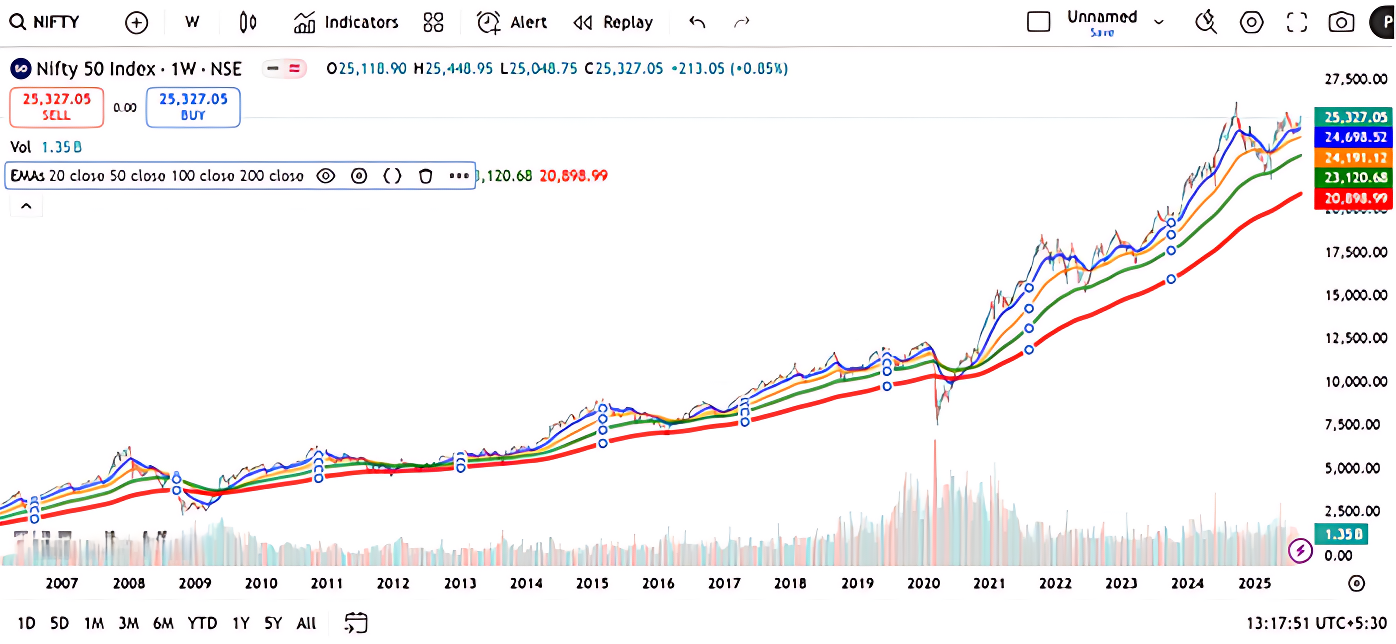
Here is a chart which shows 20, 50, 100 , 200 days EMA Plotted.
13.3 Simple Application of Moving Average

Trading with the 50-Day EMA: A Simple System
The 50-day Exponential Moving Average (EMA) isn’t just a line on a chart—it’s a signal of market sentiment. When price moves in relation to this average, it reflects how traders feel about the stock’s future.
- Price Above EMA: Traders are buying at levels higher than the recent average. That’s a vote of confidence. Momentum is building. Time to consider entering a long position.
- Price Below EMA: Traders are selling below the average. That’s caution, maybe even fear. Momentum is fading. Time to think about exiting or staying out.
The Strategy
Let’s keep it clean and rule-based. No guesswork. Just two core rules:
- Entry Rule: Go long when the current price climbs above the 50-day EMA. This suggests upward momentum. Stay in the trade until the exit condition is met.
- Exit Rule: Close the position when the price drops below the 50-day EMA. This signals potential weakness or reversal.
This system doesn’t predict the future, it reacts to it. That’s its strength. It’s built to follow trends, not fight them.

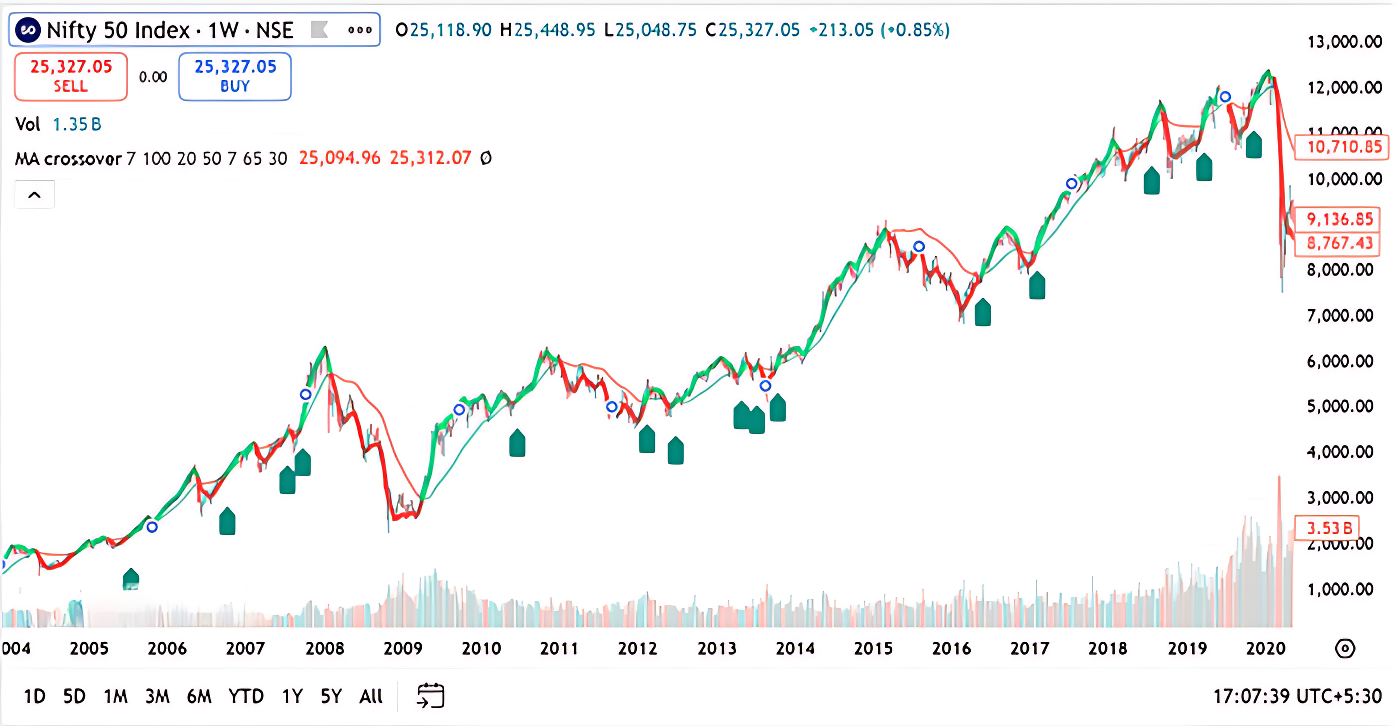
Let’s analyze how the Exponential Moving Average (EMA) strategy would have played out on the Nifty 50 index using the chart you provided. We’ll focus on buy and sell signals generated when price crosses above or below key EMAs (like 50 EMA), and how trend behavior influences profitability.
Trade 1: B1 near ~5,727 → S1 near ~7,000
- Buy Signal (B1):Price crosses above the 50 EMA around mid-2013.
- Sell Signal (S1):Exit triggered when price dips below EMA after a rally.
- Outcome:Approximate gain of ₹1,273 (7000-5727)
- Trend Context:Strong upward breakout from consolidation.
Trade 2: B2 near ~7,000 → S2 near ~7,300
- Buy Signal (B2):Another crossover above EMA, but price moves sideways.
- Sell Signal (S2):Minor dip below EMA.
- Outcome:Marginal gain of ₹300
- Trend Context:Sideways movement, low momentum.
🔹 Trade 3: B3 near ~7,300 → S3 near ~11,500
- Buy Signal (B3):Clear breakout above EMA, followed by sustained rally.
- Sell Signal (S3):Exit near peak before correction.
- Outcome:Massive gain of ₹4,200
- Trend Context:Strong bullish trend lasting several months.
Summary Table (Based on Chart)
|
Trade No |
Buy Level |
Sell Level |
Gain (Approx) |
Trend Type |
|
1 |
₹5,727 |
₹7,000 |
₹1,273 |
Trending Up |
|
2 |
₹7,000 |
₹7,300 |
₹300 |
Sideways |
|
3 |
₹7,300 |
₹11,500 |
₹4,200 |
Strong Rally |
Insights from the Chart
- EMA works best in trending markets—Trade 1 and 3 show strong gains.
- Sideways phases generate weak signals—Trade 2 had minimal returns.
- Big winners compensate for small losses or flat trades.
- Consistency is key—Don’t skip signals; the next one could be the breakout.
- EMA helps ride long-term trends—Trade 3 lasted several months, ideal for positional investors.
13.4 Moving Average Crossover System

A moving average crossover system is a popular method used by traders to identify potential buy and sell signals in the stock market. Instead of relying on just one moving average, this system uses two, one that reacts quickly to price changes (called the short-term or fast moving average) and another that reacts more slowly (called the long-term or slow moving average). The idea is to observe how these two lines interact with each other on a price chart.
Moving Average Crossover System
Moving Average Crossover System is a more refined strategy. It uses two moving averages: a faster one (e.g., a 9-day EMA) and a slower one (e.g., a 21-day EMA)
Bullish Crossover: When the faster EMA crosses over the slower EMA, it indicates a possible upward trend and generates a buy signal. Bearish Crossover: When the faster EMA crosses below the slower EMA, it indicates a possible decline and generates a sell signal.
This approach helps cut down on the noise or erroneous signals that frequently surface during sideways times and is quite successful in trending markets.
The fast moving average, such as a 50-day EMA (Exponential Moving Average), stays closer to the current market price because it uses fewer data points. The slow moving average, like the 100-day EMA, uses more data points and therefore moves more gradually. When the fast moving average crosses above the slow moving average, it signals that momentum is picking up, this is considered a buy signal. On the other hand, when the fast moving average crosses below the slow one, it indicates that the trend may be weakening—this becomes a sell signal.
This crossover method helps traders avoid false signals that often occur in sideways markets. In a basic moving average system, where only one average is used, traders might receive too many signals during periods of low volatility, leading to small or unprofitable trades. The crossover system filters out much of this noise by requiring confirmation from both averages, making it more reliable during trending phases.
Different combinations of moving averages can be used depending on the trader’s goals. For short-term trades, a 9-day and 21-day EMA might be used. For medium-term trades, combinations like 25-day and 50-day EMA’s are common. Long-term investors might prefer using 100-day and 200-day EMA’s to identify major trends that can last for months or even years. The longer the time frame, the fewer signals you will get, but those signals tend to be stronger and more meaningful.
This system can also be applied to intraday trading by using shorter time frames, such as 5-minute and 10-minute EMAs. Aggressive traders often use these to catch quick moves during the trading day. Regardless of the time frame, the principle remains the same: when the fast average overtakes the slow one, it’s a sign to enter the trade; when it falls below, it’s time to exit.
In summary, the moving average crossover system is a simple yet effective way to follow market trends. It helps traders stay invested during strong moves and avoid getting caught in choppy, directionless markets. By using two averages instead of one, this system offers better timing and more confidence in trading decisions—especially for beginners who are learning to spot trends and manage risk.
Activity for you

The current price is ₹950.15, which is slightly below the EMA 9 line at ₹964.62.
Question: If you’re a trader and you notice the price dropping below the EMA 9 after a recent uptrend, what could this signal?
- A) Strong bullish momentum
- B) Potential short-term bearish shift
- C) Market indecision
- D) No relevance to trend
Correct Answer: B) Potential short-term bearish shift Why: When price falls below a short-term EMA like EMA 9, it may indicate weakening momentum and a possible short-term reversal or pullback.
13.5 Key Takeaways

- Moving averages are trend indicators used in technical analysis to help traders smooth out short-term price fluctuations and identify trends more clearly.
- A moving average is calculated by taking the average closing price of a stock over a set number of days.
- The “moving” part of a moving average means that as a new day’s closing price is added, the oldest data point is dropped from the calculation to keep the average updated.
- An average is just an estimate and doesn’t account for the full range of price behaviour, as there will be days when the price is higher or lower than the average.
- The Moving Average Crossover System uses two different moving averages to generate buy and sell signals.
- In a bullish crossover, a faster-moving average (like a 9-day) crosses above a slower-moving average (like a 21-day), signaling a potential upward trend and a buy opportunity.
- In a bearish crossover, the faster-moving average crosses below the slower one, signaling a potential downtrend and an exit or sell opportunity.
- This crossover system helps traders stay invested during strong moves and avoid getting caught in choppy, directionless markets.
- Different combinations of moving averages are used depending on the trading time frame: short-term traders might use 9-day and 21-day EMAs, while long-term investors might use 100-day and 200-day EMAs.
- The longer the time frame, the fewer signals you will get, but those signals tend to be stronger and more meaningful.
13.1 Understanding the ‘Moving’ Average
During school days, it’s likely that we’ve learn’t about averagesand moving averages are merely a step further. Moving averages are trend indicators in technical analysis, and they are used frequently because they’re simple and effective.
Moving averages are trend indicators that help determine the underlying trend by smoothing outprice data over a given time period. The idea is straightforward: figure out the average closing price over a predetermined period of time.
The term “moving” refers to the process of dropping the oldest data point in order to maintain the average current as a new day’s closing price is added.
Simple Moving Average: The Simple Moving Average assigns each data point in the computation an identical weight.
Exponential Moving Average (EMA):
Compared to the Simple Moving Average, the Exponential Moving Average is more sensitive to fresh information and responds to price changes faster because it places greater weight on recent prices. For this reason, traders frequently favor EMA over SMA.
Before we jump into moving averages, let’s do a quick refresher on how to calculate basic average.
Monthly Average Restaurant Expense
Assume that Ramesh keeps track of how much he spends on eating out on average each week:
Week Amount Spent (₹)
Week 1 ₹800
Week 2 ₹1,200
Week 3 ₹600
Week 4 ₹1,400
To find the average monthly expense, he adds each of the weekly amounts, and divides that total by the number of weeks:
Average = (₹800 + ₹1,200 + ₹600 + ₹1,400) ÷ 4 = ₹4,000 ÷ 4 = ₹1,000
Thus, Ramesh has spent an average of ₹1,000 a week on restaurants.
Here,we get a general idea from the average how much Ramesh typically spends each week on eating out. Obviously, there were weeks when he had spent more than average and weeks when he had spent less. For instance In Week 4 he had spent ₹1,400, significantly more than the average of ₹1,000 and at Week 3 had spent just ₹600 which was much lower than the average. This illustrates that the average is merely an estimate which helps to summarize the data but does not fully account for the full range of spending. Therefore, Ramesh did not spend exactly ₹1,000 every week, despite the fact that that is the average weekly expense.
Now, let’s connect this to the stock market. In trading, we apply the same logic to prices or volumes. Instead of calculating how much Ramesh spends, we calculate the average closing price of a stock over a set number of days. This is called a moving average, and it helps traders smooth out short-term fluctuations to identify trends more clearly.
Extending the Concept to Stock Prices
Let’s apply the Idea of averages to the stock market. Suppose we’re looking at the closing prices of Larsen & Toubro (L&T) over the last 5 trading sessions. Just like we calculated the average number of Ramesh spending every week, we’ll now calculate the average closing price of a stock.
Here are the closing prices for L&T:
|
Day |
Closing Price (₹) |
|
Day 1 |
₹3,120.50 |
|
Day 2 |
₹3,145.75 |
|
Day 3 |
₹3,110.20 |
|
Day 4 |
₹3,135.60 |
|
Day 5 |
₹3,160.40 |
Total = ₹3,120.50 + ₹3,145.75 + ₹3,110.20 + ₹3,135.60 + ₹3,160.40 = ₹15,672.45
To find the 5-day average closing price, we divide the total by 5:
Average = ₹15,672.45 ÷ 5 = ₹3,134.49
So, the average closing price of L&T over the last 5 trading sessions is ₹3,134.49.
This average helps traders smooth out daily price fluctuations and get a clearer sense of the stock’s short-term trend. In technical analysis, this forms the basis of moving averages, which are calculated continuously as new data comes in.
13.1 – Understanding the ‘Moving’ Average (Simple Moving Average)
Let’s say you want to calculate the average closing price of Tata Consumer Products over the latest 5 trading sessions. Here are the closing prices:
|
Date |
Closing Price (₹) |
|
01/08/25 |
₹875.20 |
|
04/08/25 |
₹878.50 |
|
05/08/25 |
₹880.10 |
|
06/08/25 |
₹882.40 |
|
07/08/25 |
₹884.30 |
Total = ₹875.20 + ₹878.50 + ₹880.10 + ₹882.40 + ₹884.30 = ₹4,400.50
To find the 5-day average closing price, divide the total by 5:
Average = ₹4,400.50 ÷ 5 = ₹880.10
So, the average closing price of Tata Consumer over these 5 sessions is ₹880.10.
Now What It is a “Moving” Average?
Let’s say the next trading day is 08/08/25. A new closing price is available: ₹886.50.
To keep the average updated, we include this new data point and drop the oldest one (01/08/25). The new set of dates becomes:
|
Date |
Closing Price (₹) |
|
04/08/25 |
₹878.50 |
|
05/08/25 |
₹880.10 |
|
06/08/25 |
₹882.40 |
|
07/08/25 |
₹884.30 |
|
08/08/25 |
₹886.50 |
New Total = ₹4,411.80
New Average = ₹4,411.80 ÷ 5 = ₹882.36
As you can see, we’ve moved forward by including the latest closing price and excluding the oldest one. This process continues each day, always using the most recent 5 data points. That’s why it’s called a “moving” average, because it shifts forward with each new trading session.
In the above example the moving average is calculated using closing prices which are commonly preferred by traders and investors. The closing price represents the final value at which the stock trades for the day which makes it a reliable indicator of market sentiment. While closing prices are used most frequently , moving averages also can be computed using other data points such as OHL data which means opening, High and Low prices depending on the specific analysis or strategy. Moving averages are highly flexible and can be applied across various time frames.
For those who frequently use excel can calculate average within minutes. Observe how the cell reference moves in the average formula, eliminating the oldest to include the latest data points. Here is a screenshot of excel calculation.
The moving average adjusts dynamically with each new closing price, reflecting the latest market trends. This type of average is known as a Simple Moving Average (SMA). When calculated using the most recent five days of data, it’s specifically referred to as the 5-Day SMA.
By computing averages over a set number of days, commonly 5, 10, 50, 100, or 200—the resulting values can be plotted to create a smooth, flowing line called the moving average line. This line evolves continuously over time, offering a clearer view of price direction and helping to filter out short-term fluctuations.
Here is a chart which shows 50, 100 and 200 days Simple Moving Average is plotted.
What does a moving average tell us, and how is it used? In fact, moving averages have a wide range of applications in financial analysis and trading. Now it’s important to understand another powerful variation—the Exponential Moving Average.
Activity for You
The current price is ₹930.65, which is above the SMA 100 (₹854.14) and SMA 200 (₹809.32), and equal to the SMA 50.
Question: If you’re a trader and you observe the price staying above all three SMAs, what could this indicate?
- A) Weak market momentum
- B) Potential continuation of bullish trend
- C) Imminent breakdown
- D) No relevance to trend
Correct Answer: B) Potential continuation of bullish trend
Why: When the price remains above the SMA 50, SMA 100, and SMA 200, it typically signals strength and supports the possibility of an ongoing uptrend.
13.2 Understanding the Exponential Moving Average (EMA)
Let’s consider a fresh set of closing prices:
|
Date |
Closing Price |
|
22/07/14 |
310.5 |
|
23/07/14 |
312.8 |
|
24/07/14 |
315.2 |
|
25/07/14 |
318.6 |
|
28/07/14 |
320.9 |
|
Total |
1,578.0 |
When we calculate a simple average of these values, we’re assuming each data point carries equal weight. That means the price on 22nd July is treated as just as important as the price on 28th July. But in the context of financial markets, this assumption doesn’t always hold.
One of the key principles of technical analysis is that markets discount everything, meaning the most recent price reflects all known and unknown information. As a result, the latest price i.e 28th July is considered more significant than earlier ones.
To account for this, we assign greater weight to newer data points. So, the closing price on 28th July receives the highest weight, followed by 25th July, then 24th July, and so on. This approach emphasizes recent market behavior while still considering historical data.
By applying these weights, we create a scaled average where newer prices have more influence. The result is the Exponential Moving Average (EMA), a refined version of the moving average that responds more quickly to price changes.
Calculation of Exponential Moving Average
The Exponential Moving Average (EMA) is a type of moving average that gives more weight to recent prices, making it more responsive to new information than the Simple Moving Average (SMA). It’s widely used in technical analysis to identify trends.
The formula for EMA is:
EMAt = (Pt×K) +(EMAt−1×(1−K))
Where:
- EMAt= EMA today
- Pt= Price today
- EMAt−1=EMA yesterday
- K = Smoothing constant = 2/N+1
- N = Number of periods
Example Using Indian Stock: Infosys Ltd (INFY)
Let’s say we want to calculate the 10-day EMA for Infosys stock.
Step 1: Get the last 10 closing prices :
|
Day |
Closing Price (₹) |
|
1 |
1,450 |
|
2 |
1,460 |
|
3 |
1,455 |
|
4 |
1,470 |
|
5 |
1,465 |
|
6 |
1,475 |
|
7 |
1,480 |
|
8 |
1,490 |
|
9 |
1,495 |
|
10 |
1,500 |
Step 2: Calculate the 10-day SMA (used as the first EMA value):
SMA=1450+1460+1455+ 1470+1465+1475+1480+1490+1495+1500/10= ₹1,474
Step 3: Calculate the multiplier:
K=2/10+1
=0.1818
Step 4: Calculate EMA for Day 11 (assuming closing price is ₹1,510):
EMAt = (Pt×K) +(EMAt−1×(1−K)
EMA11= (1510×0.1818) + (1474×0.8182) = ₹1,480.5
If the EMA is rising, it suggests a bullish trend. Traders often use crossovers (e.g., 10-day EMA crossing above 50-day EMA) as buy/sell signals.
Here is a chart which shows 20, 50, 100 , 200 days EMA Plotted.
13.3 Simple Application of Moving Average
Trading with the 50-Day EMA: A Simple System
The 50-day Exponential Moving Average (EMA) isn’t just a line on a chart—it’s a signal of market sentiment. When price moves in relation to this average, it reflects how traders feel about the stock’s future.
- Price Above EMA: Traders are buying at levels higher than the recent average. That’s a vote of confidence. Momentum is building. Time to consider entering a long position.
- Price Below EMA: Traders are selling below the average. That’s caution, maybe even fear. Momentum is fading. Time to think about exiting or staying out.
The Strategy
Let’s keep it clean and rule-based. No guesswork. Just two core rules:
- Entry Rule: Go long when the current price climbs above the 50-day EMA. This suggests upward momentum. Stay in the trade until the exit condition is met.
- Exit Rule: Close the position when the price drops below the 50-day EMA. This signals potential weakness or reversal.
This system doesn’t predict the future, it reacts to it. That’s its strength. It’s built to follow trends, not fight them.
Let’s analyze how the Exponential Moving Average (EMA) strategy would have played out on the Nifty 50 index using the chart you provided. We’ll focus on buy and sell signals generated when price crosses above or below key EMAs (like 50 EMA), and how trend behavior influences profitability.
Trade 1: B1 near ~5,727 → S1 near ~7,000
- Buy Signal (B1):Price crosses above the 50 EMA around mid-2013.
- Sell Signal (S1):Exit triggered when price dips below EMA after a rally.
- Outcome:Approximate gain of ₹1,273 (7000-5727)
- Trend Context:Strong upward breakout from consolidation.
Trade 2: B2 near ~7,000 → S2 near ~7,300
- Buy Signal (B2):Another crossover above EMA, but price moves sideways.
- Sell Signal (S2):Minor dip below EMA.
- Outcome:Marginal gain of ₹300
- Trend Context:Sideways movement, low momentum.
🔹 Trade 3: B3 near ~7,300 → S3 near ~11,500
- Buy Signal (B3):Clear breakout above EMA, followed by sustained rally.
- Sell Signal (S3):Exit near peak before correction.
- Outcome:Massive gain of ₹4,200
- Trend Context:Strong bullish trend lasting several months.
Summary Table (Based on Chart)
|
Trade No |
Buy Level |
Sell Level |
Gain (Approx) |
Trend Type |
|
1 |
₹5,727 |
₹7,000 |
₹1,273 |
Trending Up |
|
2 |
₹7,000 |
₹7,300 |
₹300 |
Sideways |
|
3 |
₹7,300 |
₹11,500 |
₹4,200 |
Strong Rally |
Insights from the Chart
- EMA works best in trending markets—Trade 1 and 3 show strong gains.
- Sideways phases generate weak signals—Trade 2 had minimal returns.
- Big winners compensate for small losses or flat trades.
- Consistency is key—Don’t skip signals; the next one could be the breakout.
- EMA helps ride long-term trends—Trade 3 lasted several months, ideal for positional investors.
13.4 Moving Average Crossover System
A moving average crossover system is a popular method used by traders to identify potential buy and sell signals in the stock market. Instead of relying on just one moving average, this system uses two, one that reacts quickly to price changes (called the short-term or fast moving average) and another that reacts more slowly (called the long-term or slow moving average). The idea is to observe how these two lines interact with each other on a price chart.
Moving Average Crossover System
Moving Average Crossover System is a more refined strategy. It uses two moving averages: a faster one (e.g., a 9-day EMA) and a slower one (e.g., a 21-day EMA)
Bullish Crossover: When the faster EMA crosses over the slower EMA, it indicates a possible upward trend and generates a buy signal. Bearish Crossover: When the faster EMA crosses below the slower EMA, it indicates a possible decline and generates a sell signal.
This approach helps cut down on the noise or erroneous signals that frequently surface during sideways times and is quite successful in trending markets.
The fast moving average, such as a 50-day EMA (Exponential Moving Average), stays closer to the current market price because it uses fewer data points. The slow moving average, like the 100-day EMA, uses more data points and therefore moves more gradually. When the fast moving average crosses above the slow moving average, it signals that momentum is picking up, this is considered a buy signal. On the other hand, when the fast moving average crosses below the slow one, it indicates that the trend may be weakening—this becomes a sell signal.
This crossover method helps traders avoid false signals that often occur in sideways markets. In a basic moving average system, where only one average is used, traders might receive too many signals during periods of low volatility, leading to small or unprofitable trades. The crossover system filters out much of this noise by requiring confirmation from both averages, making it more reliable during trending phases.
Different combinations of moving averages can be used depending on the trader’s goals. For short-term trades, a 9-day and 21-day EMA might be used. For medium-term trades, combinations like 25-day and 50-day EMA’s are common. Long-term investors might prefer using 100-day and 200-day EMA’s to identify major trends that can last for months or even years. The longer the time frame, the fewer signals you will get, but those signals tend to be stronger and more meaningful.
This system can also be applied to intraday trading by using shorter time frames, such as 5-minute and 10-minute EMAs. Aggressive traders often use these to catch quick moves during the trading day. Regardless of the time frame, the principle remains the same: when the fast average overtakes the slow one, it’s a sign to enter the trade; when it falls below, it’s time to exit.
In summary, the moving average crossover system is a simple yet effective way to follow market trends. It helps traders stay invested during strong moves and avoid getting caught in choppy, directionless markets. By using two averages instead of one, this system offers better timing and more confidence in trading decisions—especially for beginners who are learning to spot trends and manage risk.
Activity for you
The current price is ₹950.15, which is slightly below the EMA 9 line at ₹964.62.
Question: If you’re a trader and you notice the price dropping below the EMA 9 after a recent uptrend, what could this signal?
- A) Strong bullish momentum
- B) Potential short-term bearish shift
- C) Market indecision
- D) No relevance to trend
Correct Answer: B) Potential short-term bearish shift Why: When price falls below a short-term EMA like EMA 9, it may indicate weakening momentum and a possible short-term reversal or pullback.
13.5 Key Takeaways
- Moving averages are trend indicators used in technical analysis to help traders smooth out short-term price fluctuations and identify trends more clearly.
- A moving average is calculated by taking the average closing price of a stock over a set number of days.
- The “moving” part of a moving average means that as a new day’s closing price is added, the oldest data point is dropped from the calculation to keep the average updated.
- An average is just an estimate and doesn’t account for the full range of price behaviour, as there will be days when the price is higher or lower than the average.
- The Moving Average Crossover System uses two different moving averages to generate buy and sell signals.
- In a bullish crossover, a faster-moving average (like a 9-day) crosses above a slower-moving average (like a 21-day), signaling a potential upward trend and a buy opportunity.
- In a bearish crossover, the faster-moving average crosses below the slower one, signaling a potential downtrend and an exit or sell opportunity.
- This crossover system helps traders stay invested during strong moves and avoid getting caught in choppy, directionless markets.
- Different combinations of moving averages are used depending on the trading time frame: short-term traders might use 9-day and 21-day EMAs, while long-term investors might use 100-day and 200-day EMAs.
- The longer the time frame, the fewer signals you will get, but those signals tend to be stronger and more meaningful.