12.1 All About Volume

Volume is a very crucial indicator in Technical Analysis. It acts like the voice of stock market. Price shows what is happening whereas volume shows how strongly market participants believe in that move. So how does Volume help us?
- Volume validates trends and chart patterns
- Gauge the conviction of buyers and sellers
- Understand market sentiment and participation
What Does Trading Volume Actually Mean?
The number of shares that were actually exchanged over a certain time period is indicated by volume.It shows how active a stock is; more trades indicate a larger volume, which frequently indicates more interest or momentum.
Let’s use an example to make things simpler:
|
Sl. No |
Time |
Buy Quantity |
Sell Quantity |
Price |
Volume |
Cumulative Volume |
|
1 |
9:30 AM |
300 |
300 |
₹58.40 |
300 |
300 |
|
2 |
10:30 AM |
450 |
450 |
₹59.10 |
450 |
750 |
|
3 |
11:30 AM |
600 |
400 |
₹59.85 |
400 |
1,150 |
|
4 |
12:30 PM |
200 |
200 |
₹60.30 |
200 |
1,350 |
|
5 |
1:30 PM |
700 |
700 |
₹61.00 |
700 |
2,050 |
|
6 |
2:30 PM |
550 |
550 |
₹61.45 |
550 |
2,600 |
|
7 |
3:30 PM |
900 |
900 |
₹61.20 |
900 |
3,500 |
Suppose, You prepared to sell 250 Tata Power shares at ₹210, and you choose to purchase 250 shares at ₹210. A trade occurs since our quantity and price are equal. Now the volume recorded is 250 shares and not 250+250=500 shares.
This is due to the fact that volume does not include the total of buyer and seller actions, but rather the number of shares that are exchanged.
Table – Cumulative Volume
As shares are traded at different prices and times throughout the trading day, volume increases. At 9:30 AM, 300 shares were traded at ₹58.40, setting the initial volume. By 10:30 AM, 450 additional shares were traded at ₹59.10, bringing the total volume to 750. At 11:30 AM, 400 more shares were traded at ₹59.85, increasing the total to 1,150. A spike of 700 shares at ₹61.00 by 1:30 PM (volume reaching 2,050) followed by 200 shares at ₹60.30 by 12:30 PM (for a total of 1,350). At 2:30 PM, 550 shares were traded at ₹61.45, bringing the total volume to 2,600. The day’s total volume reached 3,500 shares at 3:30 PM, when 900 shares were traded at ₹61.20 resulting in a cumulative volume of 3,500 shares for the day. This step-by-step build-up helps traders track market activity and gauge interest in the stock as the day progresses.
Take from live data
Here is a screen shot from the live market highlighting the volumes for some of the shares at 12.25 pm

Here is a screen shot from the live market highlighting the volumes for some of the shares at 2.24 pm

If you observe Reliance Industries Volume has increased from 4.23 M to 6.45 m in the same day. Similary HDFC Bank , Tata Consultancy Services and all the remaining shares volume has increased
12.2 Volume Trend Table

Volume by itself doesn’t tell us much. What matters is how today’s volume compares with previous price and volume trends. When volume is paired with price movement, it becomes a powerful tool to gauge market sentiment and trader conviction.
Interpreting Volume with Price Action
|
Sl No |
Price Action |
Volume Trend |
Market Interpretation |
|
1 |
Price increases |
Volume increases |
Strong buying interest → Bullish |
|
2 |
Price increases |
Volume decreases |
Low conviction → Caution: weak hands buying |
|
3 |
Price decreases |
Volume increases |
Strong selling pressure → Bearish |
|
4 |
Price decreases |
Volume decreases |
Low conviction → Caution: weak hands selling |
Before we can examine trends in volume, it’s important to define what we mean by an “increase in volume.” Increase in volume in comparison to what?
Today’s volume might be greater than yesterday’s volume or it may be more than last week’s average. Most often, traders are not worried about what the trading volume was in comparison to one day’s volume. They are comparing today’s volume to the volume over the last ten trading days.
This gives a much more reasonable perspective on the “average” volume and this is a more realistic view of things. Here’s a general rule of thumb:
- High Volume, means today’s volume is higher than the 10-day average.
- Low Volume, means today’s volume is less than the 10-day average.
- Average Volume, means today’s volume is “about equal to” the 10-day average.
To get these numbers you do a simple 10-day moving average of the volume bars in your charts. This gives you a smoothed chart, one free of daily spikes and fluctuations, that allows you to quickly show today’s action is significantly higher or lower than the average.
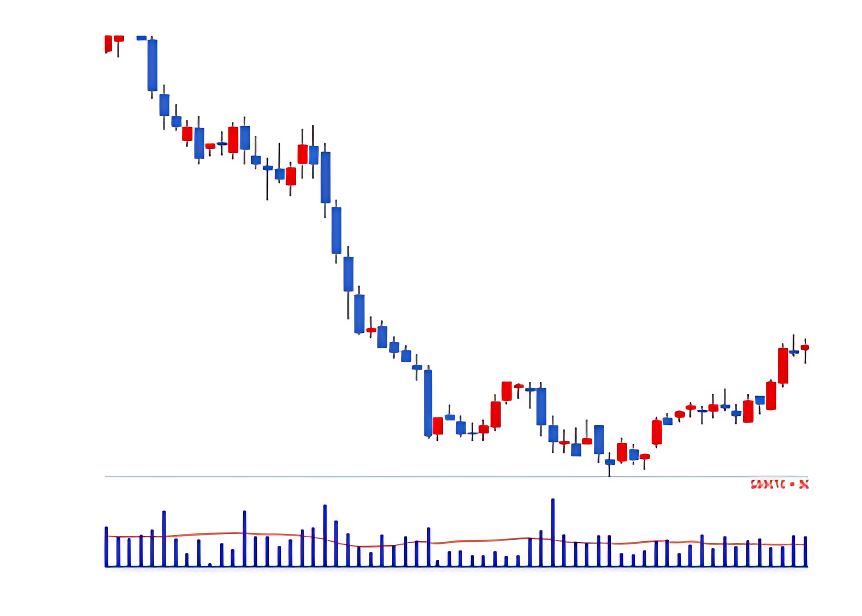
The chart has blue bars at the bottom that display daily trading volumes. The red line laid on top of the blue bars shows the 10-day average volume. A blue bar that exceeds the red line range indicates a spike in volume, usually an indication of increased participation into the market and at times, institutional buying, which can be considered as large participants.
12.3 Relationship between Volume and Price Scenario
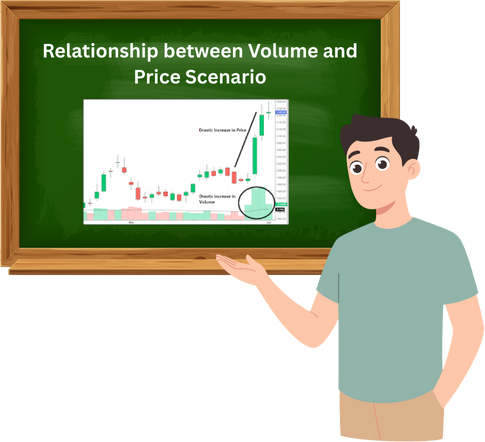
Scenario 1: Price and Volume Rise → Bullish Signal
Example: For instance, Infosys is currently trading at ₹1,450. The volume is much higher than the 10-day average, and the price has jumped to ₹1,480 today.
This is like a crowded Kirana store where everyone’s rushing to buy a newly launched product. The price is rising and many people are buying clearly, there’s strong demand. In stock terms, this suggests institutional investors (smart money) are accumulating. You might consider entering a long position.
Scenario 2: Price increases and Volume decreases → Caution
Example: Tata Motors moves from ₹620 to ₹635, but volume is lower than usual.
Imagine a cricket match where the crowd cheers loudly for a boundary, but only a few people are actually in the stadium. The price is rising, but participation is weak. This could be retail traders pushing the price up without institutional backing. Be cautious—it might be a bull trap.
Scenario 3: Price decreases and Volume increases → Bearish Signal
Example: HDFC Bank drops from ₹980 to ₹960, and volume spikes above the 10-day average.
This is like a big player exiting a business, lots of goods being sold off quickly. The price is falling and many are selling, likely including institutions. This signals strong bearish sentiment. You might consider shorting or exiting your position.
Scenario 4: Price decrease and Volume decrease → Caution
Example: Bharti Airtel slips from ₹1,020 to ₹1,010, but volume is unusually low.
Think of a quiet vegetable market where prices drop slightly, but hardly anyone is buying or selling. The decline lacks conviction. It’s likely retail-driven and not backed by smart money. This could be a bear trap, so avoid panic selling.
12.4 Revisiting the checklist

Let’s take a fresh look at the trading checklist, this time through the lens of volume analysis. Volume isn’t just a supporting detail—it’s often the deciding factor that separates a strong setup from a weak one. To understand its importance, imagine a scenario where a stock forms a bullish engulfing pattern. This pattern alone suggests a potential upward move. Now, suppose this pattern appears near a well-established support level. That’s already a compelling signal—price action is aligning with a zone where buyers have historically stepped in.
But the real conviction comes when we add volume to the mix. Let’s say on the second day of the bullish engulfing pattern, the candle closes higher with significantly above-average volume. This isn’t just a price move—it’s a message. It tells us that institutional players or large market participants are likely accumulating the stock. When price, support, and volume all point in the same direction, the trader isn’t just guessing—they’re acting on a triple-layered confirmation.
This is why volume deserves a permanent place in your trading checklist. It validates the strength behind a move. A candlestick pattern without volume is like a headline without substance. Support and resistance levels without volume may not hold. But when volume surges alongside price action, it confirms intent.
So when evaluating a trade, ask yourself: Is the pattern clear? Is it forming near a key level? And most importantly, is volume backing the move? If all three align, the trade setup gains credibility. If volume is missing, it’s perfectly reasonable to wait or pass. Patience is part of discipline.
Volume provides confirmation, which turns a decent trade setup into a brilliant one. An empty candlestick pattern is akin to a headline without content, and without volume support or resistance level might not hold. The following should be on a disciplined trader’s checklist:
- Is the pattern clear?
- Is it forming close to a crucial level?
Above all, its volume supporting the clear? The trade setting becomes more credible if all three line up.
The Accumulation/Distribution Line is a volume-based indicator that blends price movement with trading volume to assess whether a stock is being accumulated (bought) or distributed (sold). Unlike raw volume, which only shows how much was traded, the A/D Line evaluates how price and volume interact. If a stock closes near its high for the day with strong volume, it suggests accumulation buyers are in control. If it closes near its low with heavy volume, it points to distribution sellers are dominating. This makes the A/D Line a powerful tool for detecting underlying buying or selling pressure that may not be visible in price alone.

For traders tracking smart money, the A/D Line acts like a backstage pass. Imagine a stock moving sideways for weeks, but the A/D Line is steadily rising—this hints that institutional players might be quietly accumulating shares before a breakout. Conversely, if the price is climbing but the A/D Line is falling, it could mean retail traders are pushing the price up while smart money is exiting. This divergence between price and the A/D Line is a key signal for spotting potential reversals or false rallies.
To make this relatable, think of a vegetable market. If prices are stable but you notice bulk buyers quietly loading up crates of onions, you’d suspect a price hike is coming. That’s accumulation. If prices are rising but sellers are offloading aggressively, it’s distribution, expect a drop soon. The A/D Line captures this behind-the-scenes activity in the stock market. For Indian traders, combining this indicator with candlestick patterns or moving averages can offer a sharper edge in identifying trend strength and spotting early entry or exit points.
Activity For You
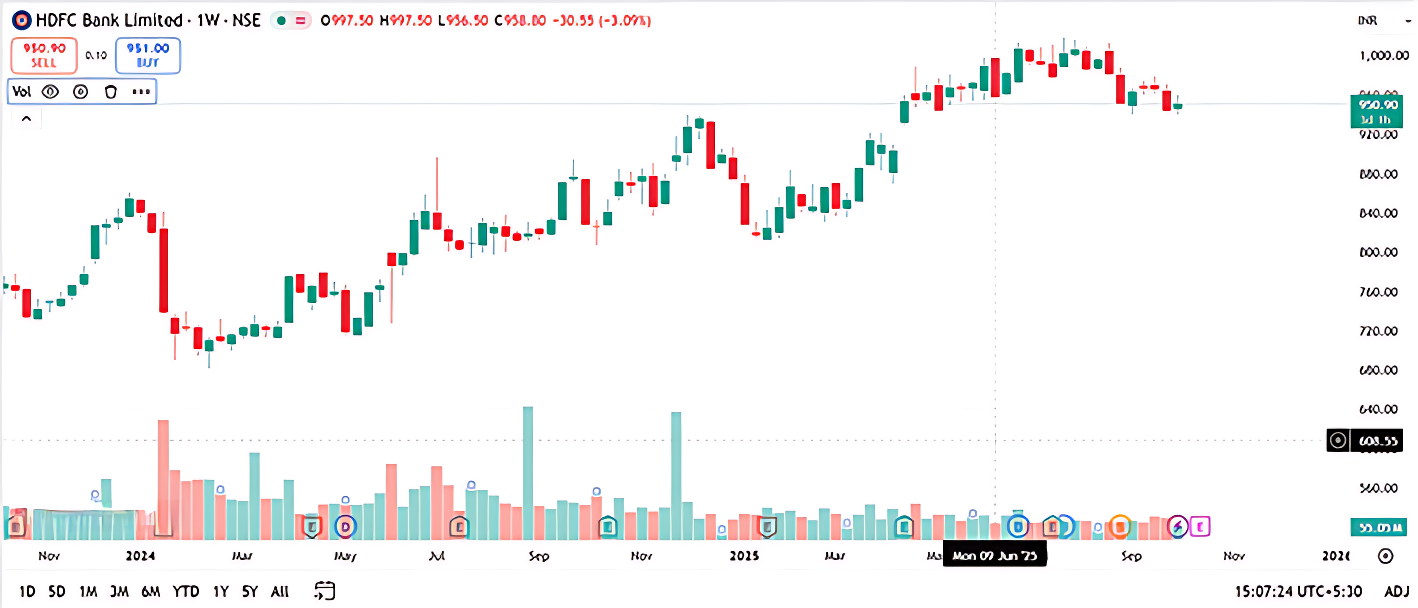
The chart shows a price decline of ₹15.00 (−1.55%) along with visible trading volume bars at the bottom.
Question: If you’re a trader and you notice a sharp price drop accompanied by rising volume, what could this combination suggest?
- A) Weak selling pressure
- B) Strong buying interest
- C) Increased selling pressure and possible trend reversal
- D) No significance—volume doesn’t matter
Correct Answer: C) Increased selling pressure and possible trend reversal
Why: A price drop with rising volume often indicates strong selling activity. It may signal a shift in sentiment or a potential reversal, prompting traders to reassess their positions.
12.5 Key Takeaways

- Volume validates price action: Volume is a crucial indicator in technical analysis that acts as the “voice of the stock market”. While price shows what is happening, volume indicates how strongly market participants believe in that move.
- Meaning of Trading Volume: Trading volume represents the number of shares exchanged over a specific period, showing how active a stock is. A larger volume often indicates greater interest or momentum in a stock.
- Volume confirms trends: The presence of high volume alongside a price move confirms the strength and conviction behind that move. For instance, a bullish price move with high volume suggests that large market players are likely accumulating the stock.
- Integration with other tools: Volume transforms a good trade setup into a great one. It should be used in conjunction with other tools like candlestick patterns and support/resistance levels to provide multi-layered confirmation for a trading decision. A candlestick pattern without volume is like a “headline without substance,” and support/resistance levels may not hold without volume backing.
- Importance of a trading checklist: A disciplined trader should use a checklist to filter out impulsive decisions. This checklist should include questions such as: “Is the pattern clear?” “Is it forming near a key level?” and, most importantly, “Is volume backing the move?”. If volume is missing, it is reasonable to wait or pass on the trade.
12.1 All About Volume
Volume is a very crucial indicator in Technical Analysis. It acts like the voice of stock market. Price shows what is happening whereas volume shows how strongly market participants believe in that move. So how does Volume help us?
- Volume validates trends and chart patterns
- Gauge the conviction of buyers and sellers
- Understand market sentiment and participation
What Does Trading Volume Actually Mean?
The number of shares that were actually exchanged over a certain time period is indicated by volume.It shows how active a stock is; more trades indicate a larger volume, which frequently indicates more interest or momentum.
Let’s use an example to make things simpler:
|
Sl. No |
Time |
Buy Quantity |
Sell Quantity |
Price |
Volume |
Cumulative Volume |
|
1 |
9:30 AM |
300 |
300 |
₹58.40 |
300 |
300 |
|
2 |
10:30 AM |
450 |
450 |
₹59.10 |
450 |
750 |
|
3 |
11:30 AM |
600 |
400 |
₹59.85 |
400 |
1,150 |
|
4 |
12:30 PM |
200 |
200 |
₹60.30 |
200 |
1,350 |
|
5 |
1:30 PM |
700 |
700 |
₹61.00 |
700 |
2,050 |
|
6 |
2:30 PM |
550 |
550 |
₹61.45 |
550 |
2,600 |
|
7 |
3:30 PM |
900 |
900 |
₹61.20 |
900 |
3,500 |
Suppose, You prepared to sell 250 Tata Power shares at ₹210, and you choose to purchase 250 shares at ₹210. A trade occurs since our quantity and price are equal. Now the volume recorded is 250 shares and not 250+250=500 shares.
This is due to the fact that volume does not include the total of buyer and seller actions, but rather the number of shares that are exchanged.
Table – Cumulative Volume
As shares are traded at different prices and times throughout the trading day, volume increases. At 9:30 AM, 300 shares were traded at ₹58.40, setting the initial volume. By 10:30 AM, 450 additional shares were traded at ₹59.10, bringing the total volume to 750. At 11:30 AM, 400 more shares were traded at ₹59.85, increasing the total to 1,150. A spike of 700 shares at ₹61.00 by 1:30 PM (volume reaching 2,050) followed by 200 shares at ₹60.30 by 12:30 PM (for a total of 1,350). At 2:30 PM, 550 shares were traded at ₹61.45, bringing the total volume to 2,600. The day’s total volume reached 3,500 shares at 3:30 PM, when 900 shares were traded at ₹61.20 resulting in a cumulative volume of 3,500 shares for the day. This step-by-step build-up helps traders track market activity and gauge interest in the stock as the day progresses.
Take from live data
Here is a screen shot from the live market highlighting the volumes for some of the shares at 12.25 pm
Here is a screen shot from the live market highlighting the volumes for some of the shares at 2.24 pm
If you observe Reliance Industries Volume has increased from 4.23 M to 6.45 m in the same day. Similary HDFC Bank , Tata Consultancy Services and all the remaining shares volume has increased
12.2 Volume Trend Table
Volume by itself doesn’t tell us much. What matters is how today’s volume compares with previous price and volume trends. When volume is paired with price movement, it becomes a powerful tool to gauge market sentiment and trader conviction.
Interpreting Volume with Price Action
|
Sl No |
Price Action |
Volume Trend |
Market Interpretation |
|
1 |
Price increases |
Volume increases |
Strong buying interest → Bullish |
|
2 |
Price increases |
Volume decreases |
Low conviction → Caution: weak hands buying |
|
3 |
Price decreases |
Volume increases |
Strong selling pressure → Bearish |
|
4 |
Price decreases |
Volume decreases |
Low conviction → Caution: weak hands selling |
Before we can examine trends in volume, it’s important to define what we mean by an “increase in volume.” Increase in volume in comparison to what?
Today’s volume might be greater than yesterday’s volume or it may be more than last week’s average. Most often, traders are not worried about what the trading volume was in comparison to one day’s volume. They are comparing today’s volume to the volume over the last ten trading days.
This gives a much more reasonable perspective on the “average” volume and this is a more realistic view of things. Here’s a general rule of thumb:
- High Volume, means today’s volume is higher than the 10-day average.
- Low Volume, means today’s volume is less than the 10-day average.
- Average Volume, means today’s volume is “about equal to” the 10-day average.
To get these numbers you do a simple 10-day moving average of the volume bars in your charts. This gives you a smoothed chart, one free of daily spikes and fluctuations, that allows you to quickly show today’s action is significantly higher or lower than the average.
The chart has blue bars at the bottom that display daily trading volumes. The red line laid on top of the blue bars shows the 10-day average volume. A blue bar that exceeds the red line range indicates a spike in volume, usually an indication of increased participation into the market and at times, institutional buying, which can be considered as large participants.
12.3 Relationship between Volume and Price Scenario
Scenario 1: Price and Volume Rise → Bullish Signal
Example: For instance, Infosys is currently trading at ₹1,450. The volume is much higher than the 10-day average, and the price has jumped to ₹1,480 today.
This is like a crowded Kirana store where everyone’s rushing to buy a newly launched product. The price is rising and many people are buying clearly, there’s strong demand. In stock terms, this suggests institutional investors (smart money) are accumulating. You might consider entering a long position.
Scenario 2: Price increases and Volume decreases → Caution
Example: Tata Motors moves from ₹620 to ₹635, but volume is lower than usual.
Imagine a cricket match where the crowd cheers loudly for a boundary, but only a few people are actually in the stadium. The price is rising, but participation is weak. This could be retail traders pushing the price up without institutional backing. Be cautious—it might be a bull trap.
Scenario 3: Price decreases and Volume increases → Bearish Signal
Example: HDFC Bank drops from ₹980 to ₹960, and volume spikes above the 10-day average.
This is like a big player exiting a business, lots of goods being sold off quickly. The price is falling and many are selling, likely including institutions. This signals strong bearish sentiment. You might consider shorting or exiting your position.
Scenario 4: Price decrease and Volume decrease → Caution
Example: Bharti Airtel slips from ₹1,020 to ₹1,010, but volume is unusually low.
Think of a quiet vegetable market where prices drop slightly, but hardly anyone is buying or selling. The decline lacks conviction. It’s likely retail-driven and not backed by smart money. This could be a bear trap, so avoid panic selling.
12.4 Revisiting the checklist
Let’s take a fresh look at the trading checklist, this time through the lens of volume analysis. Volume isn’t just a supporting detail—it’s often the deciding factor that separates a strong setup from a weak one. To understand its importance, imagine a scenario where a stock forms a bullish engulfing pattern. This pattern alone suggests a potential upward move. Now, suppose this pattern appears near a well-established support level. That’s already a compelling signal—price action is aligning with a zone where buyers have historically stepped in.
But the real conviction comes when we add volume to the mix. Let’s say on the second day of the bullish engulfing pattern, the candle closes higher with significantly above-average volume. This isn’t just a price move—it’s a message. It tells us that institutional players or large market participants are likely accumulating the stock. When price, support, and volume all point in the same direction, the trader isn’t just guessing—they’re acting on a triple-layered confirmation.
This is why volume deserves a permanent place in your trading checklist. It validates the strength behind a move. A candlestick pattern without volume is like a headline without substance. Support and resistance levels without volume may not hold. But when volume surges alongside price action, it confirms intent.
So when evaluating a trade, ask yourself: Is the pattern clear? Is it forming near a key level? And most importantly, is volume backing the move? If all three align, the trade setup gains credibility. If volume is missing, it’s perfectly reasonable to wait or pass. Patience is part of discipline.
Volume provides confirmation, which turns a decent trade setup into a brilliant one. An empty candlestick pattern is akin to a headline without content, and without volume support or resistance level might not hold. The following should be on a disciplined trader’s checklist:
- Is the pattern clear?
- Is it forming close to a crucial level?
Above all, its volume supporting the clear? The trade setting becomes more credible if all three line up.
The Accumulation/Distribution Line is a volume-based indicator that blends price movement with trading volume to assess whether a stock is being accumulated (bought) or distributed (sold). Unlike raw volume, which only shows how much was traded, the A/D Line evaluates how price and volume interact. If a stock closes near its high for the day with strong volume, it suggests accumulation buyers are in control. If it closes near its low with heavy volume, it points to distribution sellers are dominating. This makes the A/D Line a powerful tool for detecting underlying buying or selling pressure that may not be visible in price alone.
For traders tracking smart money, the A/D Line acts like a backstage pass. Imagine a stock moving sideways for weeks, but the A/D Line is steadily rising—this hints that institutional players might be quietly accumulating shares before a breakout. Conversely, if the price is climbing but the A/D Line is falling, it could mean retail traders are pushing the price up while smart money is exiting. This divergence between price and the A/D Line is a key signal for spotting potential reversals or false rallies.
To make this relatable, think of a vegetable market. If prices are stable but you notice bulk buyers quietly loading up crates of onions, you’d suspect a price hike is coming. That’s accumulation. If prices are rising but sellers are offloading aggressively, it’s distribution, expect a drop soon. The A/D Line captures this behind-the-scenes activity in the stock market. For Indian traders, combining this indicator with candlestick patterns or moving averages can offer a sharper edge in identifying trend strength and spotting early entry or exit points.
Activity For You
The chart shows a price decline of ₹15.00 (−1.55%) along with visible trading volume bars at the bottom.
Question: If you’re a trader and you notice a sharp price drop accompanied by rising volume, what could this combination suggest?
- A) Weak selling pressure
- B) Strong buying interest
- C) Increased selling pressure and possible trend reversal
- D) No significance—volume doesn’t matter
Correct Answer: C) Increased selling pressure and possible trend reversal
Why: A price drop with rising volume often indicates strong selling activity. It may signal a shift in sentiment or a potential reversal, prompting traders to reassess their positions.
12.5 Key Takeaways
- Volume validates price action: Volume is a crucial indicator in technical analysis that acts as the “voice of the stock market”. While price shows what is happening, volume indicates how strongly market participants believe in that move.
- Meaning of Trading Volume: Trading volume represents the number of shares exchanged over a specific period, showing how active a stock is. A larger volume often indicates greater interest or momentum in a stock.
- Volume confirms trends: The presence of high volume alongside a price move confirms the strength and conviction behind that move. For instance, a bullish price move with high volume suggests that large market players are likely accumulating the stock.
- Integration with other tools: Volume transforms a good trade setup into a great one. It should be used in conjunction with other tools like candlestick patterns and support/resistance levels to provide multi-layered confirmation for a trading decision. A candlestick pattern without volume is like a “headline without substance,” and support/resistance levels may not hold without volume backing.
- Importance of a trading checklist: A disciplined trader should use a checklist to filter out impulsive decisions. This checklist should include questions such as: “Is the pattern clear?” “Is it forming near a key level?” and, most importantly, “Is volume backing the move?”. If volume is missing, it is reasonable to wait or pass on the trade.