
The Hanging Man candle is a reversal candlestick pattern that comes at the peak of a bullish trend and denotes a price reversal in technical analysis. This pattern is typically used by price action traders to choose the most secure moment to initiate a sell trade.
Trading using candlestick charts has grown in popularity on the bitcoin market. Additionally, its efficiency aids investors in discovering lucrative trades on any financial market. Candlestick-based trading first gained popularity in the stock market, but it is now also useful in trading cryptocurrencies and foreign exchange. As a result, current cryptocurrency brokers use candlestick charts to increase the profitability of investing in crypto assets.
Introduction:
The price movement of the Hanging Man candlestick pattern is comparable to that of the Hammer, Doji, and Shooting Star formations. It does, however, indicate a potential negative trend direction and appears at the peak of an upward trend. Let’s now get into the specifics of the market’s Hanging Man pattern.
A bearish candlestick pattern called The Hanging Man forms at the peak of a bullish trend and serves as a bearish reversal pattern. This pattern appears after a protracted bullish run and signals that the trend may soon reverse since the bulls seem to be losing momentum. Even though this pattern does not signal a shift in trend, it sends a signal that the price has already reached a top.
The Hanging Man candlestick pattern on a price chart serves as a cautionary signal for buyers who want to hold the price for greater profit. For buyers, managing the trade by exiting the market at a profit, ensuring some gain, is helpful. On the other hand, it suggests a potential entry point for sellers, subject to additional confirmations.
What is the Hanging man pattern?
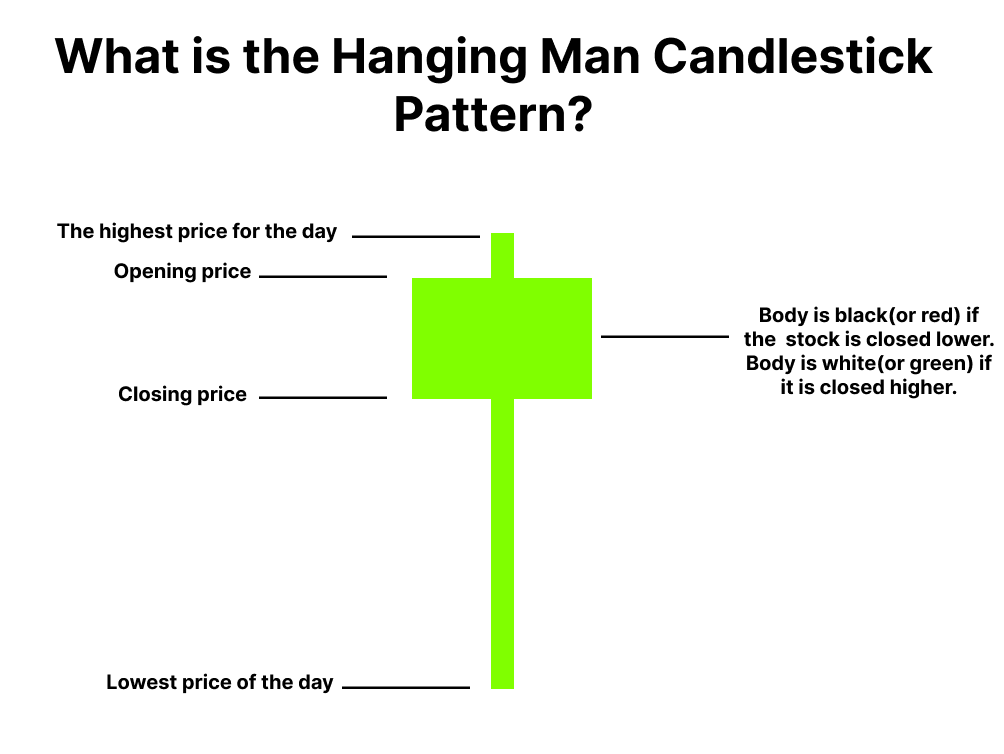
- If a pattern appears at the top end of a trend, it is called a Hanging man.
- The bearish hanging man is a single candlestick, and a top reversal pattern.
- A hanging man signals a market high. The hanging man is classified as a hanging man only if is preceded by an uptrend.
- Since the hanging man is seen after a high, the bearish hanging man pattern signals selling pressure.
The Hanging Man pattern can be used with both bullish and bearish bodies, but it is more effective with a bearish body. Buyers push the market up before the daily closing in a bearish pattern, and the bearish close indicates that the bears are in control.
The Hanging Man suggests potential bearish pressure in the price but does not offer a sell signal. The overbought state at the Hanging Man can be verified by traders using the RSI indicator. Nevertheless, traders can rely on it when two or more indicators show the same price direction.
What does hanging man tells us?
- A hanging man can be of any color and it does not really matter as long as it qualifies ‘the shadow to real body’ ratio.
- The prior trend for the hanging man should be an uptrend.
- Since the hanging man is seen after a high, the bearish hanging man pattern signals selling pressure.
The Hanging Man pattern can be used with both bullish and bearish bodies, but it is more effective with a bearish body. Buyers push the market up before the daily closing in a bearish pattern, and the bearish close indicates that the bears are in control.
The Hanging Man suggests potential bearish pressure in the price but does not offer a sell signal. The overbought state at the Hanging Man can be verified by traders using the RSI indicator. Nevertheless, traders can rely on it when two or more indicators show the same price direction.
How to Trade Hanging man pattern s with Examples?
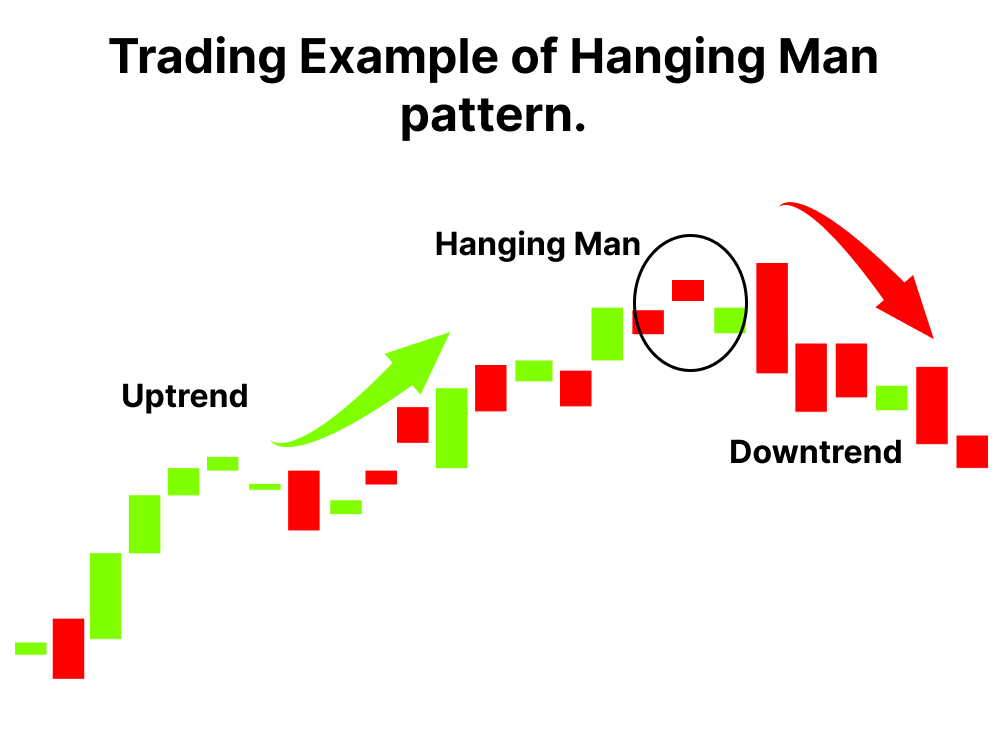
- The market is in an uptrend, hence the bulls are in absolute control
- The market is characterized by new highs and higher lows
- The day the hanging man pattern appears, the bears have managed to make an entry
- This is emphasized by a long lower shadow of the hanging man
- The entry of bears signifies that they are trying to break the strong hold of the bulls
Because of its close opening and closing prices and extended downside wick, The Hanging Man resembles a hammer. The wick must be at least twice as long as the body for the pattern to be effective.
Traders who use price action are accustomed to this kind of swing low pattern. But it also presents a new narrative about the market, which is crucial to comprehend. The Hanging Man is still a negative indicator even though it has a long bearish wick that resembles a hammer. The extreme bearish activity during the day that failed to hold until close is indicated by the bearish wick.
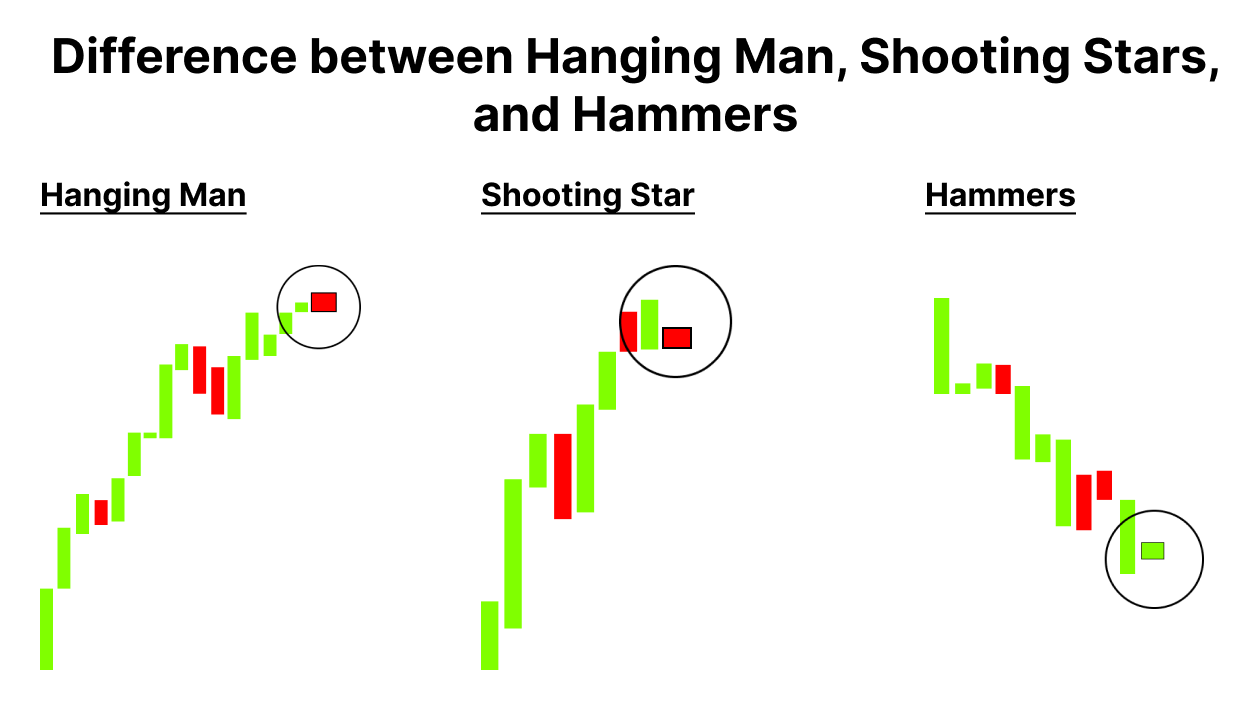
Difference between Hanging man-pattern shooting stars and hammers?
- These pattern helps traders in setting up directional trades.
- The interpretation of Hammer & Hanging Man changes based on where it appears on the chart.
- These are the famous reversal patterns.
- The hanging man pattern is bearish and the hammer pattern is relatively bullish.
- These patterns are characterized by a long lower shadow with a small upper body.
- If the bullish pattern appears at the bottom end of a downward rally, it is called the ‘Hammer’.
- If the bearish pattern appears at the top end of an uptrend rally, it is called the ‘Hanging man’.
- To qualify a candle as a pattern, the length of the lower shadow should be at least twice the length of the real body.
- This is called the ‘shadow to real body ratio’.
The shooting star candlestick, the hanging guy, and the hammer.
Although The Hammer and The Hanging Man have a similar appearance, they follow different trends. However, there is a significant difference between their structures: the Hanging Man has a long shadow below the body, whilst the Shooting Star has a long above shadow. Nevertheless, both the Hanging Man and the Shooting Star offer the same price direction.
At the peak of an upward trend, The Hanging Man and Shooting Star can be seen. At least twice as long as their bodies, both bodies have a lengthy wick. The trend is the key difference between the Hammer and the Hanging Man, which both provide a trend reversal signal.
Conclusion?
At the peak of an upward trend, a single candlestick pattern known as the Hanging Man formation heralds a probable change in trend direction. Although the Hammer and Shooting Star are comparable to this candlestick, there are several significant variances in price direction and shape. Once this pattern originates from a substantial resistance level and its daily low is broken, it is considered genuine.
To maximize the likelihood of a successful transaction, traders should continue to constantly monitor price action utilizing additional candlesticks. Additionally, effective trade management and strategic trading approaches are necessary to get a trustworthy result from any candlestick-based trading.


