Gerald Appel created the MACD indicator in the late 1970s. The MACD is regarded by traders as the most important indicator.
The relationship between two exponential moving averages (EMAs) of the price of a security is displayed by the trend-following momentum indicator known as moving average convergence/divergence (MACD, or MAC-D). Even though it was created in the 1970s, momentum traders still regard MACD as one of the most trustworthy indicators. The MACD meaning stands for Moving average convergence and divergence.
Introduction:
MACD stands for moving average convergence and divergence. As the name implies, the two moving averages’ convergence and divergence make up the majority of the MACD.
Convergence occurs when two moving averages move in opposition to one another, and divergence occurs when they move apart. A typical MACD is produced using a 12-day EMA and a 26-day EMA. The starting point for both EMAs is the closing prices. We deduct the 26 EMA from the 12-day EMA to calculate the convergence and divergence (CD) value. A typical label for a straight-line graph of this is the “MACD Line.”
What is Moving average Convergence divergence?
The best of both worlds is available with MACD: trend following and momentum. As the moving averages converge, intersect, and diverge, the MACD moves above and below the zero line. To generate signals, traders should watch for signal line crossovers, centrelines crossovers, and divergences.
For spotting overbought and oversold levels, MACD is not particularly helpful. MACD works best with daily periods, which typically have a length of 26/12/9 days.
When the MACD line crosses over the signal line (to purchase) or drops below it, technical signals are generated (to sell). By alerting traders to the strength of a directional advance and signalling the possibility of a price reversal, MACD can assist in determining whether an asset is overbought or oversold. When a new high in the price is not confirmed by a new high in the MACD, or vice versa, MACD can alert investors too bullish/bearish divergences, indicating a potential failure and reversal.
What is MACD Formula?
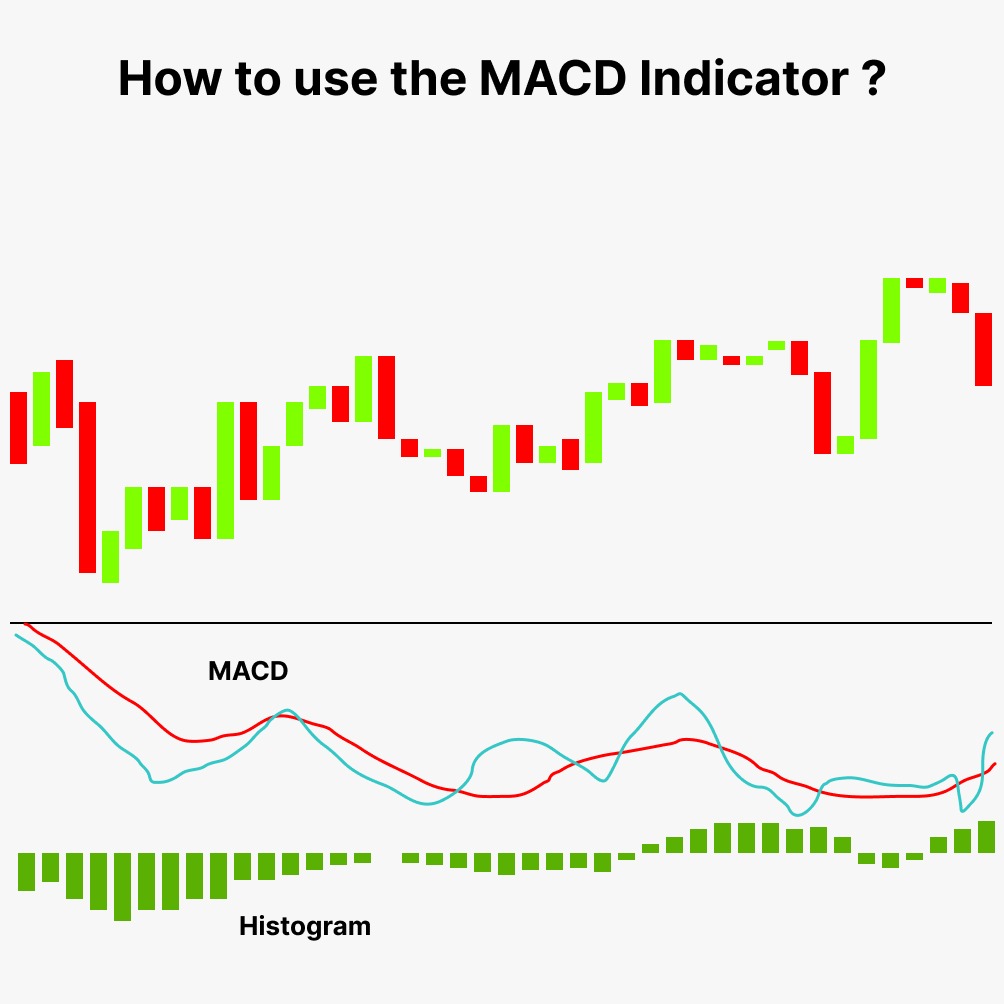
MACD Line (Blue): 12-day EMA – 26-day EMA
Signal Line (Red): 9-day EMA of MACD Line
Histogram: MACD Line – Signal Line
The 12-day Exponential Moving Average (EMA) less the 26-day EMA forms the MACD line.
These moving averages are computed using closing prices. The indicator is shown along with a 9-day EMA of the MACD line to serve as a signal line and detect turns. The MACD Histogram shows the discrepancy between the MACD and the signal line, which is the 9-day EMA. When the MACD line is above its signal line and when it is below its signal line, the histogram is positive.
The MACD is calculated by deducting the short-term EMA from the long-term EMA (26 periods) (12 periods). An EMA is a sort of moving average (MA) that gives the most recent data points more importance and weight.
The exponentially weighted moving average is another name for the exponential moving average. In comparison to a simple moving average (SMA), which gives equal weight to all observations across time, an exponentially weighted moving average responds more strongly to recent price movements. This is a primary reason to use EMA before SMA which is a simple moving average.
MACD vs RSI?
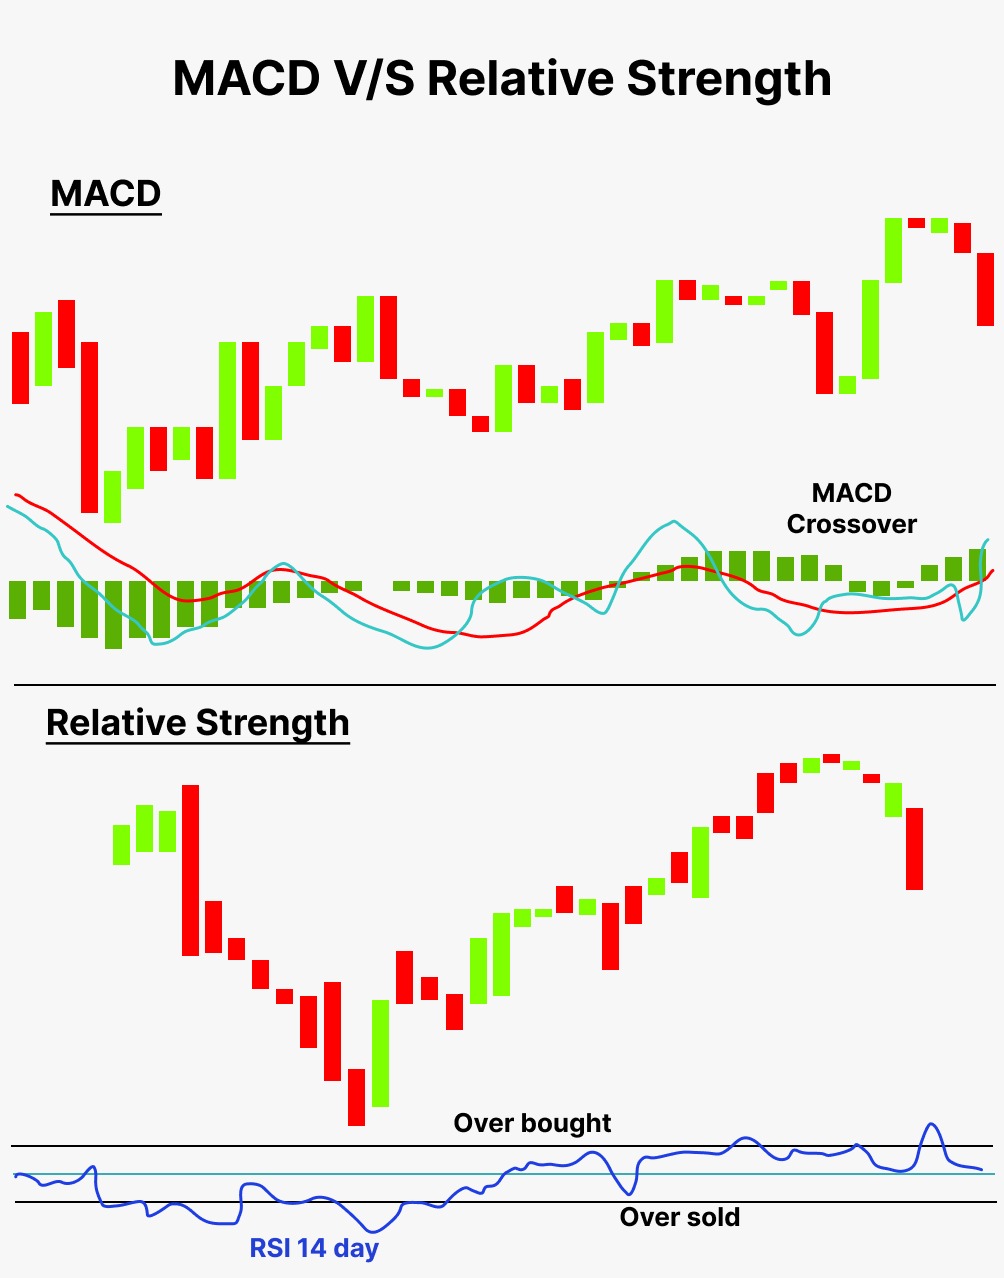
On the other hand, unlike the RSI and other oscillator studies, the MACD lines do not have definite overbought/oversold values. Instead, they operate relative to one another. This means that a trader or investor should pay attention to the level and direction of the MACD/signal lines in relation to earlier price moves in the security. In respect to recent price levels, the relative strength index (RSI) seeks to indicate whether a market is thought to be overbought or oversold. The RSI oscillator determines the typical price gains and losses over a specified time frame. The 14-period default time period has values that range from 0 to 100. An overbought condition is indicated by a value above 70, and an oversold condition is indicated by a reading below 30, both of which could indicate the formation of a top (a bottom is forming).
How to use MACD?
The black line is represented as the MACD line, while the line red in colour is representing the Signal line. The signals provided by MACD are a little delayed hence it is a lagging indicator.
A purchasing signal is indicated when the MACD line crosses over the Signal, and vice versa
In our price chart of TCS, The MACD is above the signal which denotes that buyers lately are more dominant and are trying to bring consolidation to the price level. However, since both the MACD and Signal are below 0, this indicates a bearish trend in the market and rejects our null hypothesis (H0) which states that TCS stock prices have been dominated by buyers over the past 3 months.
The potential entry signal for buying is only when both MACD and Signal are positive, ie, above the zero level.
Examples of MACD crossover?
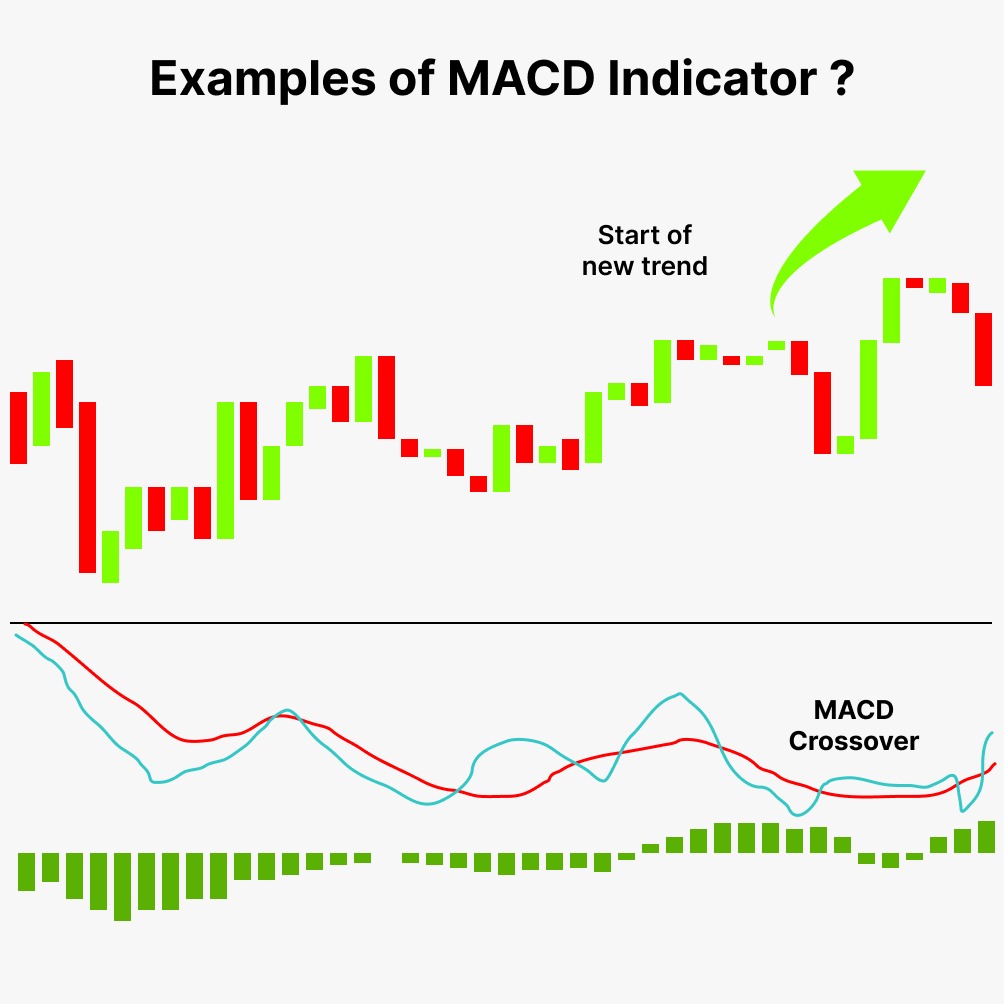
The next most typical MACD indications are centreline crossovers. When the MACD line crosses the zero line to become positive, a bullish centreline crossing occurs.
When the underlying security’s 12-day EMA crosses the 26-day EMA, this occurs.
When the MACD crosses the zero line and moves below it to become negative, a bearish centreline crossing occurs. When the 12-day EMA crosses below the 26-day EMA, this occurs.
Crossovers in signal lines are the most typical MACD signals. The MACD line’s 9-day EMA serves as the signal line.
When the “MACD Line” turns up and crosses over the “Signal Line,” it signals a bullish crossover.
When the “MACD Line” declines and crosses below the “Signal Line,” it signals a bearish crossover. Depending on the power of the move, crossovers can endure a few days or a few weeks.
The crossovers for the TCS price chart is thereby marked in red which generates signals for a trader
Conclusion
Because MACD is based on EMAs, which give more weight to recent data, it can respond fast to changes in the direction of the current price move. But that rapidity has its drawbacks as well. Crossovers of the MACD lines should be observed, but additional technical signals, such as the RSI or possibly a few candlesticks price charts, should be examined for confirmation. Furthermore, it contends that confirmation in future market movement should emerge before taking the signal because it is a lagging indicator. Because it combines trend and momentum in one indicator, the MACD indicator is unique.
Charts that are daily, weekly, or monthly can use this particular trend and momentum combination. The difference between the 12- and 26-period EMAs serves as the default value for MACD. A shorter short-term moving average and a longer long-term moving average may be used by chartists seeking additional sensitivity.
Weekly charts may benefit more from MACD (5,35,5) because it is more sensitive than MACD (12,26,9). For less sensitivity, chartists may think about stretching the moving averages. The centreline crossovers and signal line crossings will occur less frequently in a less sensitive MACD, but it will still fluctuate above/below zero. When it comes to spotting overbought and oversold levels, the MACD is not very effective.