
- A white candlestick that opens lower than the previous day’s finish and closes higher than the previous day’s opening is known as a bullish engulfing pattern. It can be recognized when a little black candlestick that represents a bearish trend is followed the next day by a large white candlestick that represents a bullish trend, with the body of the latter candlestick completely engulfing or overlapping the former.
- Introduction:
- The trader only required one candlestick in a single candlestick pattern to spot a trading opportunity. The trader requires two or sometimes three candlesticks to spot a trading opportunity when examining multiple candlestick patterns, though.
- This indicates that the trading opportunity develops across at least two trading sessions. It takes two trading sessions for the engulfing pattern to develop.
What is the Bullish engulfing Pattern?
- The bullish engulfing pattern is one of the most prominent two candlestick patterns in technical analysis. It occurs when a smaller bearish candle is completely overshadowed by a larger bullish candle, signaling a potential reversal in a downtrend. This engulfing pattern, also known as the engulfing candle pattern, is part of a broader group of multiple candlestick patterns used to predict market movements.
- In the case of a bullish engulfing, the larger engulfing candlestick highlights strong buying pressure, whereas the bearish engulfing pattern indicates a potential reversal to a downtrend, driven by selling pressure. These candlestick engulfing patterns are essential for traders aiming to interpret market sentiment and anticipate price reversals.
Among the types of engulfing candlestick patterns, the bullish and bearish engulfing candlestick patterns stand out for their reliability in analyzing trends. The engulfing candlestick pattern consists of a small candle followed by a larger one, symbolizing a significant shift in momentum. - Traders often rely on these patterns to navigate volatile markets, as understanding engulfing candles and their implications offers a clear advantage. Whether focusing on 2 candlestick patterns or exploring candlestick engulfing patterns, mastering these techniques allows for strategic decision-making. By combining insights from both bullish and bearish engulfing setups, investors gain a comprehensive view of market dynamics and potential opportunities.
- A small candle will appear on day 1 of an engulfing pattern, then on day 2, a somewhat lengthy candle will appear, seemingly engulfing the candle from day 1.
- The engulfing pattern is known as a “Bullish Engulfing” pattern if it appears at the bottom of a downtrend trend. The engulfing pattern is known as a “Bearish Engulfing” pattern if it comes during the peak of an uptrend.
- The bottom of the downtrend is where the bullish engulfing pattern, which consists of two candlestick patterns, first appears. This pattern, which is bullish as its name implies, encourages the trader to go long. The chart shows the two-day bullish engulfing pattern in a circle.
Understanding a Bullish engulfing pattern
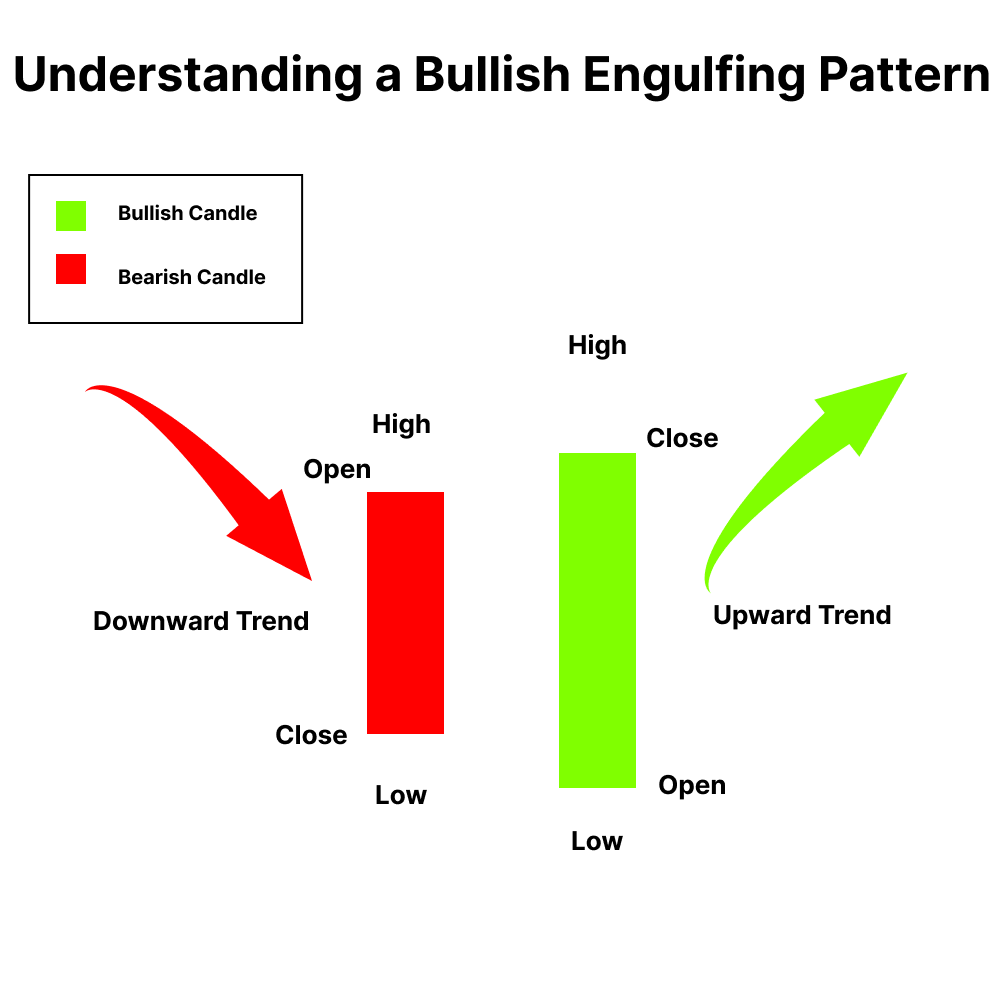
- Prices are steadily declining as the market is in a bearish trend.
- The market opens low and hits a new low on the first day of the pattern (P1). As a result, a red candle is created.
- The stock opens on the second day of the pattern (P2) near the P1 closing values and tries to set a new bottom. However, a sudden purchasing interest at this low point in the day causes prices to close higher than they did at the day’s opening. This price movement results in a blue candle.
- The price movement on P2 also implies that bulls attempted to break the bearish trend extremely abruptly and strongly, and they did so rather successfully. The lengthy blue candle on P2 demonstrates this.
- The quick action of the bull on P2 would not have been anticipated by the bears, so this action by the bull makes the bears a little uneasy.
- The trader should hunt for purchasing chances because the bullishness is anticipated to persist throughout the coming trading sessions, pushing the prices higher.
Example of How to trade a Bullish engulfing.
- When it appears at the bottom of a downtrend, the bullish engulfing candle shows reversal of a downtrend and suggests an increase in purchasing pressure. As more buyers enter the market and drive prices further higher, this pattern breaks the current trend. Two candles are used in the pattern, with the second green candle entirely enveloping the body of the first red candle. At the price level of 3000 INR, a Doji candle with a downward trend develops, and the next day, a green bullish engulfing candle with an upward trend reverses the trend.
Limitations of Using Engulfing Patterns
- Engulfing patterns can also make it challenging to determine the possible reward because candlesticks don’t offer a price goal. Instead, traders will need to employ alternative strategies, including trend analysis or indicators, to pick a price goal or decide when to exit a winning trade.
- Although they are not infallible, bullish engulfing patterns can be a potent indication, especially when combined with the present trend. Following a sharp decline in price, engulfing patterns are particularly helpful since they make it obvious when momentum is shifting upward. Even if the price is rising overall, turbulent price action reduces the impact of the engulfing pattern because it is a pretty common indicator.
- The enveloping candle or second candle could likewise be enormous. If they choose to trade the pattern, this could leave the trader with an extremely big stop loss. The trade’s potential gain could not outweigh the danger.
Conclusion
- Bullish engulfing patterns are more likely to signal reversals if they are preceded by four or more black candlesticks. A trend reversal is likely to be forming if a second white candlestick closes higher than the bullish engulfing candle, which is confirmed by the number of preceding black candlesticks the bullish engulfing candle engulfs.
- Ultimately, traders want to determine if a bullish engulfing pattern indicates a shift in attitude, which suggests a potential buying opportunity. Aggressive traders may decide to buy the bullish engulfing candle near the day’s finish if volume and price are rising, expecting the price to rise further the next day. More cautious traders might postpone their trades till the next day in exchange for more assurance that a trend reversal has started.


