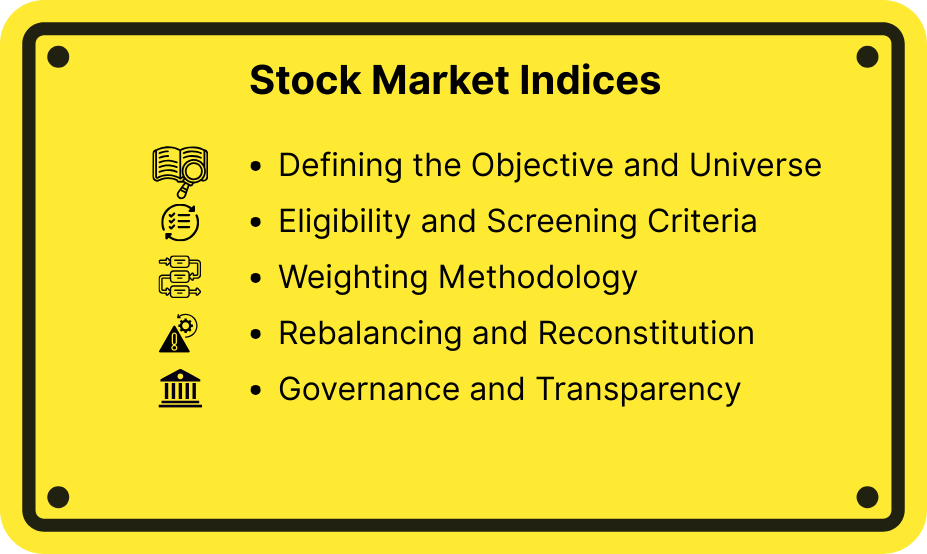
8.1 Stock Market Indices
In the vast architecture of financial markets, stock indices act as critical scaffolding. They not only provide a condensed narrative of market Behavior but also shape how traders interpret, respond, and position themselves. Understanding how indices work, and how to work with them is indispensable to serious market participants.
This chapter deconstructs the nature, relevance, evolution, and tactical use of stock market indices in a trader’s toolkit.
Nirav: Vedant, I keep seeing Nifty and Sensex flashing across news screens. Are they just headline numbers or do they actually mean something deeper?
Vedant: They’re much more than headlines. Stock market indices are like economic thermometers—they track selected stocks to show how a segment of the market is performing. Let’s unpack why they matter.
Stock Market Indices: What Are They and Why Do They Matter?
Think of a stock market index like a report card. A report card shows how a student is doing in subjects. An index like Nifty 50 or Sensex shows how a group of companies is doing in the market. If the index goes up it means the student is doing better. This indicates improvement. If it drops it means the student is doing worse. This signals performance. Investors use this “report card” to see how the market is doing.
A stock market index is an average of a few selected stocks. These stocks represent a part of the market. This part could be based on how big the companiesre what sector they are in or other filters. The index gives one number that shows how all these stocks are doing together.. It’s more than just a number. It shows how people feel about the market how money is moving and whats happening in the economy.
For example when the Nifty 50 goes up it means that many top Indian companies are doing well. This makes people optimistic. When the S&P 500 changes suddenly after a Fed announcement it shows how traders investors and others react to news about the economy.
Nirav: So how do they choose which stocks to include in an index?
Vedant: That’s a question. Choosing stocks for an index isn’t random. It involves selecting stocks deciding how much each stock counts and making sure it fits the indexs goal. Lets look at how it works.
8.2 Designing an Index

The two main stock market indices in India are the S&P BSE Sensex and the CNX Nifty. These indices are like thermometers for the stock market. They measure how well or poorly the market is doing at any given time. The S&P in Sensex comes from Standard & Poors. They are experts in creating indices. They work with the Bombay Stock Exchange to make the Sensex. The CNX Nifty is managed by a team that includes the National Stock Exchange and CRISIL.
So why do these indices matter?
They are like indicators of how a crowd’s feeling. If the index goes up it means investors are feeling confident. They think the economy will grow or companies will do well. If it drops it means investors are worried. They might be worried about the economy, company. Changes in policy. These changes show how many investors are changing their expectations. Watching the index is like reading what the market is thinking. Before creating an index its purpose must be clear. Is it meant to show how the whole market is doing?.
Does it focus on a specific sector or theme?
Once the goal is clear the team selects which stocks to include. This might include all companies listed on an exchange.. It might include only some companies that fit certain criteria like size or liquidity.
For example the Nifty 50 includes companies listed on the National Stock Exchange. It focuses on how big the companiesre how easily their stocks can be traded.
Nirav: There must be rules to decide which companies are included. Not every listed company is in the Nifty or Sensex.
Vedant: That’s right. Rules, like liquidity, market capitalization, sector representation and trading frequency are important. Lets look at these rules in detail.
8.3 Eligibility and Screening Criteria

This stage filters the universe by applying rules such as:
Free-Float Market Capitalization: Only includes publicly tradable shares, excluding promoter holdings. This ensures price movement reflects real market participation.
Liquidity Thresholds: Stocks must meet minimum turnover or trading frequency to ensure they’re investable and trackable.
Listing History: New IPOs may be excluded until they’ve traded for a certain duration—common in stability-focused indices.
Sectoral Balance: Some indices cap weight to prevent over concentration.
Nirav: I’ve noticed some stocks influence index movements more than others. Is that due to their size?
Vedant: That’s due to weighting. Different indices use market cap-weighting, equal-weighting or other methods. Time to explore how weights shape index behavior.
8.4 Weighting Methodology

Once constituents are selected, assigning weights determines their influence:
- Market Cap Weighted: Larger companies exert more pull on the index. This mirrors real-world market impact but can skew toward a few giants.
- Price Weighted: Higher-priced stocks have a greater say. Used in legacy indices like the Dow Jones.
- Equal Weighted: Every stock gets the same importance. Offers pure-play diversification, but is more volatile and less reflective of market cap reality.
- Factor-Based/Smart Beta: Custom weighting based on valuation metrics (P/E, P/B), earnings quality, or volatility. Popular in thematic indices.
Traders monitor weighting to gauge how a single stock’s movement could drive the entire index—vital in event-driven trading and hedging.
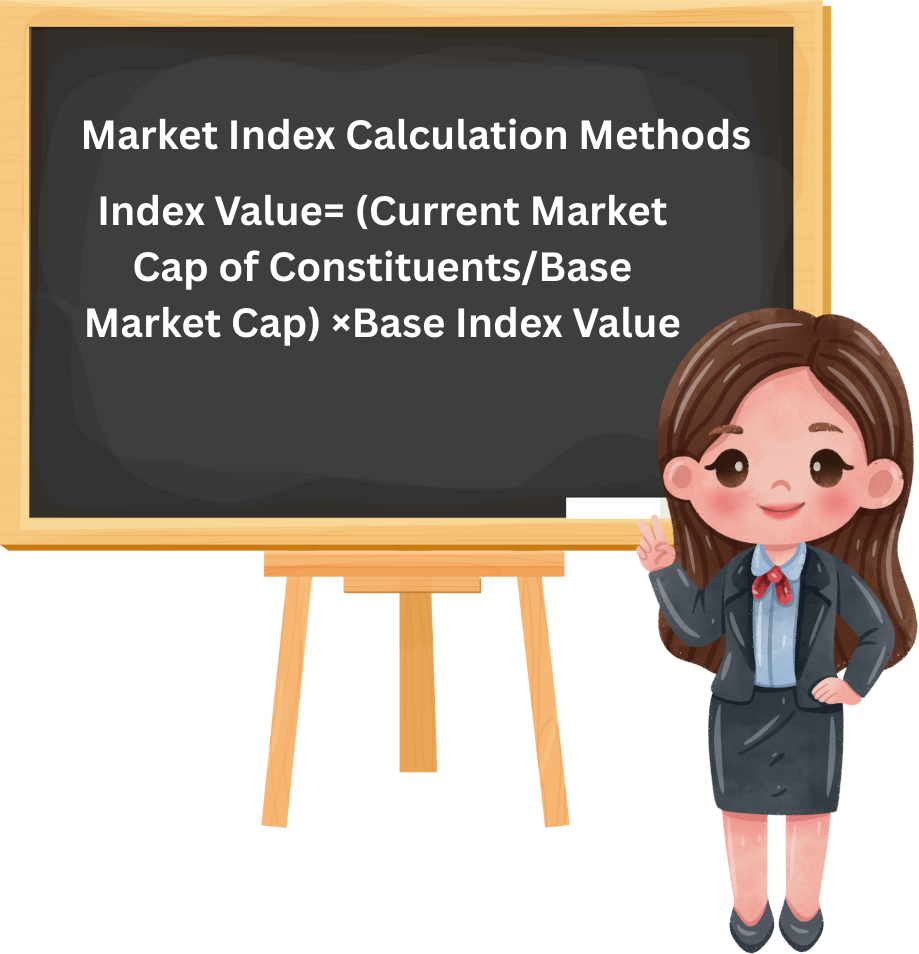
8.5 Market Index Calculation Methods
1.Market Capitalization Weighted Index (most common)
Used by indices like Nifty 50 and Sensex.
Formula:
Index Value= (Current Market Cap of Constituents/Base Market Cap) ×Base Index Value
- MarketCap = Total Outstanding Shares × Current Share Price
- Free-Float Market Cap: Only includes shares available for public trading (excludes promoter holdings, government stakes, etc.)
- Why Free-Float? It better reflects actual market movements and reduces manipulation risk.
Example (Free-Float Method)
Let us say we have 3 companies:
Company Shares Outstanding Free-Float
|
% |
Price |
Free-Float |
Market Cap |
|
A Ltd |
10,000 |
80% ₹200 |
₹16,00,000 |
|
B Ltd |
20,000 |
60% ₹300 |
₹36,00,000 |
|
C Ltd |
30,000 |
50% ₹400 |
₹60,00,000 |
Total Free-Float Market Cap = ₹1,12,00,000
If base market cap = ₹1,00,00,000 and base index value = 1000: Index Value= (1,12,00,000/1,00,00,000) ×1000=1120
Why It Matters
- Helps investors track market sentiment
- Used for benchmarking portfolio performance
- Drives passive investing via ETFs and Index Funds
Nirav: Markets are always changing companies are. Growing or declining. How do indices stay updated?
Vedant: They use rebalancing and reconstitution—these processes help keep the index current and accurate. Let’s see how it works and why it is important.
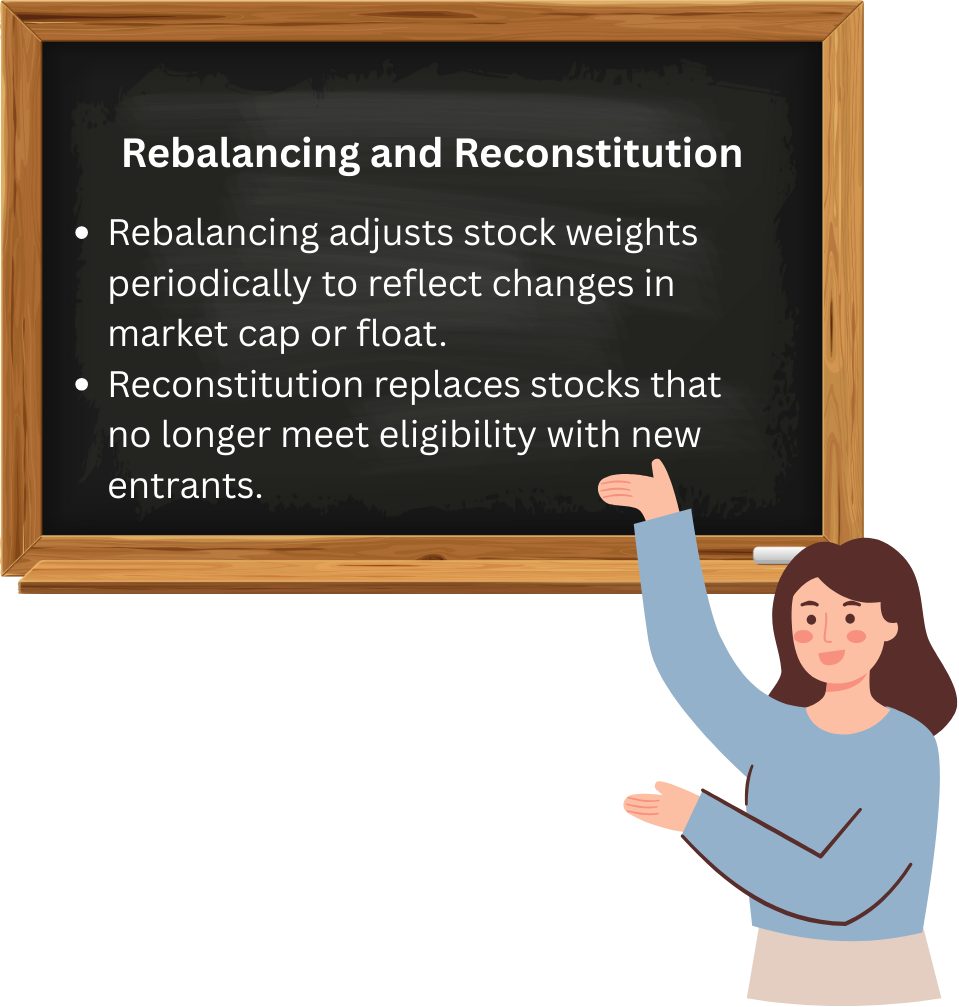
8.6 Rebalancing and Reconstitution
Markets keep changing. Indices must change too. Here’s why:
- Rebalancing is when we adjust the stock amounts periodically to show changes, in market value or available shares.
- Reconstitution is when we replace stocks that no longer qualify with ones.
Rebalancing can happen monthly, quarterly or every six months depending on how volatile the market’s the strategy. For example Nifty indices usually rebalance every six months with checks every six months.
Index changes—especially when stocks are added or removed—can cause price changes as big investors move their money to match the updated list. Traders often use this information to get a strategy called index front-running).
Nirav: It seems like there are a lot of decisions happening behind the scenes. Who makes sure indices aren’t rigged?
Vedant: That’s where rules, oversight groups and transparency come in—these things keep the index credible. Let’s go through the safeguards.
8.7 Governance and Transparency

Credible index design requires:
- Clearly documented methodology (publicly available rulebooks)
- Independent index committees that govern inclusion decisions
- Back-testing to validate index performance historically
- Handling of corporate actions like stock splits, dividends, mergers, etc., in a consistent and transparent way
The governance structure ensures that indices maintain integrity and can be trusted as benchmarks for funds, ETFs, and derivatives.
Nirav: I saw traders using Nifty Futures for short-term plays. Are indices tradeable?
Vedant: Through derivatives like futures and options. They’re tactical tools for hedging and speculation. Let’s explore this playground.
8.8 Behavioral Finance and Stock Market Indices: A Study of Crowd Psychology

- A Study of Crowd Psychology Indices Reflect Collective Emotion, Not Just Fundamentals
Following a trending diet because everyone’s doing it mirrors how traders chase index rallies—driven by herd behavior and emotion, not logic. When the trend reverses, both your energy and the market dip. Ads boasting “1 million successful dieters” reflect anchoring bias—just like round-number milestones in indices. Stock indices may be built on math, but they’re shaped by investor psychology. Behavioral biases like fear, greed, and recency distort judgment, leading to overreactions—like “relief rallies” after bad news simply because things didn’t get worse.
>Example: After the 2020 COVID crash, Nifty surged well before earnings recovery—this was sentiment leading price, not logic trailing valuation.
Herding and Momentum in Index Constituents
Index-heavy stocks like Reliance, HDFC Bank, or TCS often attract disproportionate investor flows during bull markets due to herding Behavior. When these stocks move, the index follows—not necessarily because of fundamentals, but because everyone believes they’re “safe bets.” This creates self-fulfilling momentum.
>A trader chasing Nifty because Reliance broke out isn’t necessarily buying the market; they’re buying consensus belief.
The problem?
When the herd exits, the fall is just as sharp—fuelled by the same psychology in reverse.
Anchoring Around Round Numbers
Indices exhibit strong anchoring bias near psychological levels—think Nifty 20,000 or Sensex 70,000. These are not mathematically significant, but they act like magnets for price action:
- Traders place stop-losses or targets near round numbers.
- News outlets amplify importance: “Nifty hits new milestone!”
- Options OI spikes around these levels, influencing expiry dynamics.
This anchors market sentiment and even options premiums—often creating synthetic resistance/support zones based more on psychology than market structure.
Overreaction and Underreaction Phenomena Behavioral biases often cause:
- Overreaction: A surprise inflation prints causes panic selling across all indices—even defensive ones—despite limited long-term impact.
- Underreaction: A large policy reform is dismissed because markets are “waiting for confirmation,” only to price it in months later with momentum-driven moves.
Indices aggregate these behaviors, especially during earnings seasons, policy events, or budget speeches where emotional swings amplify mispricing’s.
Sentiment Indicators and Contrarian Signals
Many traders use Put/Call Ratios, India VIX, and index OI build-up to read emotional sentiment. These are proxies for:
- Greed (overbought zones, excessive call buying)
- Fear (deep OTM puts, panic volume spikes)
- Complacency (low VIX despite macro risk)
Contrarian traders often enter positions when these indicators flash extremes. For example, if Nifty options show heavy short covering near ATHs with low VIX, it may signal euphoria—a warning that a pullback could be near.
Recency Bias and Trend Chasing
Humans tend to overweigh recent outcomes when forecasting the future. So, if Nifty has delivered 3 straight green candles, traders assume the trend will continue, even in absence of fresh triggers.
This explains:
- Late entry into rallies
- Fear of missing out (FOMO)
- Blow-off tops driven purely by momentum followers
This Behavior is profitable only if you’re early. For laggards, trend chasing at index peaks becomes a pain trade.
Loss Aversion and Risk Positioning
According to Behavioral finance, losses hurt more than gains feel good—often twice as much. In index terms:
- Traders hold on to losing positions hoping for a turnaround.
- Index short sellers cover too early at minor upticks due to fear.
- Investors sell profitable positions too soon, undercutting compounding.
This emotional volatility often leads to under-performance despite correct views—a psychological trap especially dangerous in leveraged Nifty/Bank Nifty trades.
Nifty 50 Index with weightage
Sr No Company Weightage*
|
Sr No |
Company |
Weightage* |
|
1 |
RELIANCE INDUSTRIES LTD |
9.54 % |
|
2 |
HDFC BANK LTD |
7.85 % |
|
3 |
BHARTI AIRTEL LTD |
5.86 % |
|
4 |
TATA CONSULTANCY SERVICES LTD |
5.61 % |
|
5 |
ICICI BANK LTD |
5.23 % |
|
6 |
STATE BANK OF INDIA |
3.92 % |
|
7 |
INFOSYS LTD |
3.09 % |
|
8 |
HINDUSTAN UNILEVER LTD |
2.99 % |
|
9 |
BAJAJ FINANCE LTD |
2.75 % |
|
10 |
ITC LTD |
2.65 % |
|
11 |
LARSEN & TOUBRO LTD |
2.60 % |
|
12 |
MARUTI SUZUKI INDIA LTD |
2.09 % |
|
13 |
MAHINDRA & MAHINDRA LTD |
2.08 % |
|
14 |
HCL TECHNOLOGIES LTD |
2.07 % |
|
15 |
SUN PHARMACEUTICAL INDUSTRIES LTD |
2.02 % |
|
16 |
KOTAK MAHINDRA BANK LTD |
2.02 % |
|
17 |
ULTRATECH CEMENT LTD |
1.86 % |
|
18 |
AXIS BANK LTD |
1.70 % |
|
19 |
NTPC LTD |
1.69 % |
|
20 |
TITAN COMPANY LTD |
1.59 % |
|
21 |
BAJAJ FINSERV LTD |
1.58 % |
|
22 |
ZOMATO LTD |
1.58 % |
|
23 |
OIL & NATURAL GAS CORPORATION LTD |
1.53 % |
|
24 |
BHARAT ELECTRONICS LTD |
1.44 % |
|
25 |
ADANI PORTS AND SPECIAL ECONOMIC ZONE LTD |
1.44 % |
|
26 |
POWER GRID CORPORATION OF INDIA LTD |
1.38 % |
|
27 |
ADANI ENTERPRISES LTD |
1.35 % |
|
28 |
WIPRO LTD |
1.33 % |
|
29 |
JSW STEEL LTD |
1.31 % |
|
30 |
TATA MOTORS LTD |
1.26 % |
|
31 |
ASIAN PAINTS LTD |
1.25 % |
|
32 |
COAL INDIA LTD |
1.22 % |
|
33 |
BAJAJ AUTO LTD |
1.18 % |
|
34 |
NESTLE INDIA LTD |
1.08 % |
|
35 |
JIO FINANCIAL SERVICES LTD |
1.07 % |
|
36 |
TATA STEEL LTD |
1.00 % |
|
37 |
TRENT LTD |
0.98 % |
|
38 |
GRASIM INDUSTRIES LTD |
0.97 % |
|
39 |
SBI LIFE INSURANCE COMPANY LTD |
0.95 % |
|
40 |
HDFC LIFE INSURANCE CO LTD |
0.87 % |
|
41 |
EICHER MOTORS LTD |
0.81 % |
|
42 |
HINDALCO INDUSTRIES LTD |
0.80 % |
|
43 |
TECH MAHINDRA LTD |
0.75 % |
|
44 |
CIPLA LTD |
0.65 % |
|
45 |
SHRIRAM FINANCE LTD |
0.60 % |
|
46 |
APOLLO HOSPITALS ENTERPRISE LTD |
0.58 % |
|
47 |
DR REDDYS LABORATORIES LTD |
0.54 % |
|
48 |
TATA CONSUMER PRODUCTS LTD |
0.53 % |
|
49 |
HERO MOTOCORP LTD |
0.48 % |
|
50 |
INDUSIND BANK LTD |
0.31 % |
Nirav: Vedant, I never realized how much psychology and strategy are packed into index trading. It is not about numbers it is about human behavior that we see on a screen.
Vedant: That is the point. Indices may seem like numbers but they show us how people feel, what they think and how they make decisions. They are where the facts meet the biases that people have.
Nirav: So when I see the Nifty going up or down I should not just look at the charts I need to ask why it is happening and who is behind it.
Vedant: Exactly. The moves of the index tell us stories, stories about institutions changing their investments traders reacting or how people feel about the market changing.. If we understand these stories we can make better decisions.
Nirav: This makes me think maybe trading indices is like reading a crowd do not just follow the noise. Learn how to listen to it.
Vedant: Well said. Whether you are a short term trader or a long term investor indices give us more than a way to invest in the market they give us a way to understand the psychology of the market.
Master them and you will get more than good returns you will get a better understanding of the market.
Nirav: Thanks for explaining this to me Vedant. Now I need to look at my strategies with a new perspective.
Vedant:. That is how you grow from trading just numbers to trading the stories behind them.