9.1 Comonly Used Jargons in Stock Market

Vedant: Hey Nirav I see you have been checking stock prices a lot lately. Are you getting into trading?
Nirav: Yes I am trying to learn. But I keep hearing words, like bull market, short selling, circuits it all feels confusing.
Vedant: That is totally normal. The stock market has its language. Once you understand these terms everything will start to make sense.
Nirav: So learning the language is the step?
Vedant: Exactly let us go over the used words in a simple way so you can understand what is really happening in the market.
- Bull Market. This is when the market is going up or is expected to go up.
A bull market is when the prices of stocks are rising or are expected to rise for a time. This usually means that investors are confident the economy is doing well and companies are making profits. During this time investors are optimistic and more people are investing in the market.
Example: There was a man named Ramesh who ran a tea stall near a bus stop. Every morning a group of men would gather there and talk about everything. One day a young man named Aarav started coming to the stall he was using his phone to trade stocks. The old men were skeptical they thought stocks were like gambling.. Week after week Aarav kept smiling he showed them how the Sensex was going up and how foreign investors were investing in Indian stocks. He explained some terms. All they heard was that the market was going up. Ramesh decided to invest ₹10,000 in a fund that Aarav recommended.
After a months Rameshs tea stall was doing very well he had made a profit of 35%. Aarav. Said, “this is a bull market even a cup of tea tastes better when the market is good.”
- Bear Market. This is when the market is going down or is expected to go
A bear market is when the prices of stocks are falling or are expected to fall for a time. This usually means that the economy is slowing down investors are worried and companies are not doing well. During this time investors are pessimistic and more people are selling their stocks.
Example: A good example of a bear market was in 2008 during the financial crisis. The stock markets around the world fell sharply the S&P 500 fell by over 50%. Investors were very worried. The economy was in a recession. In India the Sensex fell from 21,000 to 9,000. This was a difficult time for investors.
- Trend. This is the direction in which the market or a stock is moving.
A trend is the direction in which a stock or the market is moving. It can be going up down. Staying the same. Understanding trends is important for traders as it helps them make decisions.
Example: A good example of a trend is the IT stocks between 2016 and 2021. During this time the stocks of companies like Infosys, TCS and Wipro were going up consistently. This was because they were doing well and investors were confident. On the hand during the COVID-19 pandemic the market fell sharply this was a downtrend. And in 2022 the market was moving sideways this was a trend.
- Face Value. This is the value of a share.
Face value is the value of a share it is the value at which the company issued the share. This value is important for accounting and corporate actions like dividends and stock splits.
Example: Imagine a company issues 1,00,000 shares with a face value of ₹10 each. This means the companys share capital is ₹10 lakhs. Even if the stock is trading at ₹500 the face value remains ₹10. This face value is important when the company declares dividends or splits its stocks.
- 52-Week High/Low. This is the lowest price a stock has traded at in the past year.
The 52-week high and low are the highest and lowest prices at which a stock has traded in the year. These levels are important for investors and traders as they can indicate the direction of the market.
Example: As of June 2025 Aditya Birla Capital Ltd reached its 52-week high this means it reached the price it has traded at in the past year. On the hand Protean eGov Technologies Ltd reached its 52-week low this means it reached the lowest price it has traded at in the past year. These levels are important for traders and investors as they can indicate the direction of the market.
- All-Time High/Low. This is the lowest price a stock has ever reached.
An all-time high or low is the lowest price a stock has ever traded at. These levels are important for investors and traders as they can indicate the direction of the market.
Example: A good example of an all-time high is MRF Ltd, which reached a price of ₹1,51,445 per share. This is the price it has ever traded at. On the hand Bombay Oxygen Investments Ltd once traded at an all-time low of ₹2,505. These levels are important, for traders and investors as they can indicate the direction of the market.
- Upper/Lower Circuit. This is the price range a stock can move in a day.
The upper and lower circuit are the price range a stock can move in a day. This is set by the exchange to control volatility.
Upper and lower circuits are like boundaries that stock exchanges set every day to control changes in a stocks price. The upper circuit is the price a stock can go up to in one day of trading and the lower circuit is the lowest it can go down. If a stock reaches either of these limits trading may be stopped for a while to calm down people who are buying or selling too quickly. These rules are especially important for stocks that are not traded a lot or are affected by news because they help keep the market fair and protect people who invest from big changes in price.
For example something like this happened with the Adani Groups stock prices at the beginning of 2023. After a report came out that was not good for the company some of their stocks like Adani Total Gas and Adani Transmission kept going down to their allowed price for several days in a row. This meant that their prices fell much as they could for the day and trading was stopped for a little while to prevent people from selling too quickly.. When people started feeling better about the company later some of these stocks went up to their highest allowed price and trading was stopped again this time because people were buying too quickly.
These limits, which are usually set at 5%, 10% or 20% depending on the type of stock are made by stock exchanges like the NSE and BSE to control changes in price and protect people who invest from prices that do not make sense.
- Squaring Off means closing a trade that you already have like selling a stock that you bought earlier.
To square off means to close a trade that you have open either by selling a stock that you bought or buying back a stock that you sold. This is something that people who trade during the day do because they have to close all their trades before the market closes. If you forget to do it your broker will usually do it for you near the end of the day, 3:15 or 3:20 PM. This makes sure that you do not have any trades open overnight which could be risky.
- Intraday Trading is when you buy and sell stocks on the day.
Intraday trading is when you buy and sell stocks on the day trying to make money from the changes in price that happen during the day. It is different from investing for the term because you do not actually own the stocks. You just try to make money from the ups and downs in price. You have to be able to make decisions and be disciplined because even small changes in price can mean you win or lose money. Since you close all your trades at the end of the day you do not have to worry about what might happen but it can be riskier for people who are just starting out.
For example lets say Arjun, a trader sees that Tata Motors is doing well in the morning because of news about the company. He buys 200 shares at ₹785 thinking that the price will go up. By 1:30 PM the price goes up to ₹805. Arjun sells all his shares making a profit of ₹20 per share or ₹4,000 in total. Since he did not hold the stock overnight and closed his trade before the market closed this is an example of intraday trading.
- Delivery Trading is when you buy stocks and hold them for than a day.
Delivery trading is when you buy stocks and hold them for than a day and the stocks are added to your account. This is the way of investing, where you can hold stocks for days, months or years depending on what you want to achieve. When you do delivery trading you can get dividends, bonus shares and your stocks can increase in value over time. It is good for people who want to invest for the term and do not want to try to make money from the ups and downs in price that happen during the day.
For example lets say Meera thinks that the Indian renewable energy sector will do well in the term. She buys 50 shares of Tata Power at ₹320 each. Holds them in her account. Over the few months the company does well and the stock price goes up to ₹390. Meera sells her shares after six months making a profit of ₹70 per share. Since she held the shares for than a day and they were added to her account this is an example of delivery trading.
9.2 Commonly Used Jargons in Stock Market
- Short Selling is when you sell a stock that you do not own hoping to buy it later at a lower price.
Short selling is a way of trading where you sell stocks that you do not actually own hoping to buy them later at a lower price. You do this by borrowing the stocks from your broker and selling them on the market. If the price goes down as you thought you can buy the stocks back at the price return them to your broker and keep the difference as profit. But if the price goes up you can lose a lot of money. Short selling is riskier and usually done by experienced traders.
For example lets say Vikram thinks that the shares of XYZ Ltd are overvalued and will go down. He borrows 100 shares from his broker. Sells them on the market getting ₹80,000. A days later the price goes down to ₹720 and Vikram buys the shares back for ₹72,000. He returns the shares to his broker. Keeps the difference of ₹8,000 as profit. This is an example of selling, where you sell high and then buy low to make money.
- Long Position is when you buy a stock hoping that its price will go up.
Taking a position means buying a stock because you think its price will go up over time. This is the common way of investing, where you buy low and sell high. When you take a position you believe in the companys potential for growth and usually hold the stock for a while from days to years. You can make money from the increase in price. Also get dividends making it good for people who think the market or a specific stock will do well.
For example lets say Ananya thinks that Reliance Industries will do well because of its plans to expand into energy and digital services. She buys 100 shares at ₹2,500 each hoping that the price will go up over the few months. She holds the shares in her account. Monitors the companys progress and market trends. By October the stock price goes up to ₹2,950. Ananya sells all her shares making a profit of ₹45,000. Since she bought the stock hoping that its price would go up and held it until it did this is an example of a position.
- Stop Loss is a price at which you automatically sell a stock to limit your losses.
A stop loss is a way to manage risk that lets you set a price at which your trade will be automatically closed to prevent losses. For example if you buy a stock at ₹500 and set a stop loss at ₹470 your broker will sell the stock if it goes down to ₹470 limiting your loss to ₹30 per share. This is especially helpful in markets that are changing a lot because it prevents you from making decisions and losing more money than you intended.
For example lets say Neha buys 100 shares of Infosys at ₹1,500 each hoping that the price will go up. But she also wants to protect herself in case the market goes against her so she sets a stop loss at ₹1,450. If the stock price goes down to ₹1,450 her broker will automatically sell the shares limiting her loss to ₹50 per share. If the price never goes down to ₹1,450 the stop loss does not do anything. She keeps holding the stock.. If the market goes down sharply and hits ₹1,450 the stop loss is triggered and her trade is closed helping her avoid bigger losses.
- Support Level is a price at which a stock tends to stop going down because people want to buy it.
The support level is a price at which a stock tends to stop going down. Might start going up again because more people want to buy it. It is, like a floor that the price
Resistance level is the opposite of support. It is the price point where a stock tends to stop rising because of increased selling pressure. This is like a ceiling that the stock struggles to break through. When a stock approaches a resistance level traders may take profits causing the price to stall or reverse. However if the stock breaks above this resistance level with volume it can signal a bullish breakout and lead to further upward momentum.
For example a clear example of a resistance level was seen in Tata Consultancy Services (TCS) during mid-2021. The stock repeatedly approached the ₹3,900. ₹4,000 Range. Struggled to break above it. Each time it neared this zone selling pressure increased. Investors likely booked profits or anticipated a reversal. Causing the price to retreat. This created a ceiling on the chart marking it as a strong resistance level. After multiple attempts and a strong earnings report did TCS finally break through triggering a bullish breakout. Such resistance zones are closely watched by traders to time entries, exits or set stop-loss levels.
Volume is the number of shares traded during a period. It indicates interest and liquidity. Volume refers to the number of shares traded in a stock or across the market during a specific time frame. Be it a minute, a day or a month. It reflects the level of activity and investor interest in a security. High volume often indicates participation and liquidity making it easier to enter or exit positions without significantly impacting the price. Traders also use volume to confirm trends. For instance a price rise accompanied by volume is considered more reliable than one with low volume.
For example lets say on a trading day HDFC Bank sees 10 lakh shares bought and sold on the NSE. That means its trading volume for the day is 10 lakh shares. If the day the volume jumps to 25 lakh shares. Perhaps due to a major earnings announcement or news event. It signals heightened investor interest and stronger liquidity. Traders often use spikes in volume to confirm the strength of a price move. For instance if HDFC Banks stock rises sharply on volume it is considered a more reliable uptrend than a similar price move on low volume.
Volatility is the degree of price fluctuation in a stock or market. It measures how much and how quickly a stocks price fluctuates over time. A volatile stock experiences sharp price swings in either direction while a low-volatility stock moves more steadily. Volatility is often seen as a proxy for risk. Volatility means greater uncertainty but also greater potential for profit or loss. It can be influenced by market news earnings reports, geopolitical events or even investor sentiment and is a factor in pricing options and managing risk.
For example a vivid example of volatility was seen during the COVID-19 market crash in March 2020. Global stock markets, including Indias Nifty 50 and Sensex experienced price swings. Falling over 30% in just a few weeks. One day the Sensex would drop 2,000 points. The next it might rebound sharply reflecting extreme uncertainty and fear among investors. This kind of up-and-down movement is a textbook case of high volatility. It was not about the direction of the market. It was the speed and magnitude of the price changes that defined the volatility.
A Market Order is an order to buy or sell immediately at the available price. It is a type of trade instruction where an investor tells the broker to buy or sell a stock immediately at the available price. It prioritizes speed over price precision making it ideal when quick execution is more important than getting a rate. For example if you place a Market Order to buy a stock trading around ₹500 your order will be filled instantly. Though the final price may vary depending on liquidity and order book depth.
For example suppose Raj wants to buy 50 shares of Infosys, which is currently trading at around ₹1,500. He places a Market Order through his broker, which means he is willing to buy the shares at the available price right now. Without setting a specific price. The order gets executed instantly. The actual price he pays might vary slightly depending on the current bids in the market. For instance he might end up buying 20 shares at ₹1,501. The remaining 30 at ₹1,503 depending on available sellers. The key point is: speed over price precision.
Market Orders are ideal when execution speed matters more than getting a price. Like in fast-moving or highly liquid stocks.
A Limit Order is an order to buy or sell at a price or better. It allows an investor to set a price at which they want to buy or sell a stock. The order will only be executed if the market reaches that price or better. For instance if you place a buy Limit Order at ₹480 for a stock currently trading at ₹500 the trade will only go through if the price drops to ₹480 or lower. This gives you price control but no guarantee of execution in fast-moving or illiquid markets.
For example suppose Aisha wants to buy shares of Tata Steel currently trading at ₹150. However she believes the stock is slightly overvalued and wants to enter if the price drops. So she places a buy Limit Order at ₹145. This means her order will only execute if the stock price falls to ₹145 or lower. If the price never drops to that level the order remains unfilled. On the side if she already owns the stock and wants to sell it only if it rises she could place a sell Limit Order at ₹160 which will execute only if the price reaches ₹160 or higher. Limit Orders give traders price control. Not execution certainty. Perfect for those who prioritize value over speed.
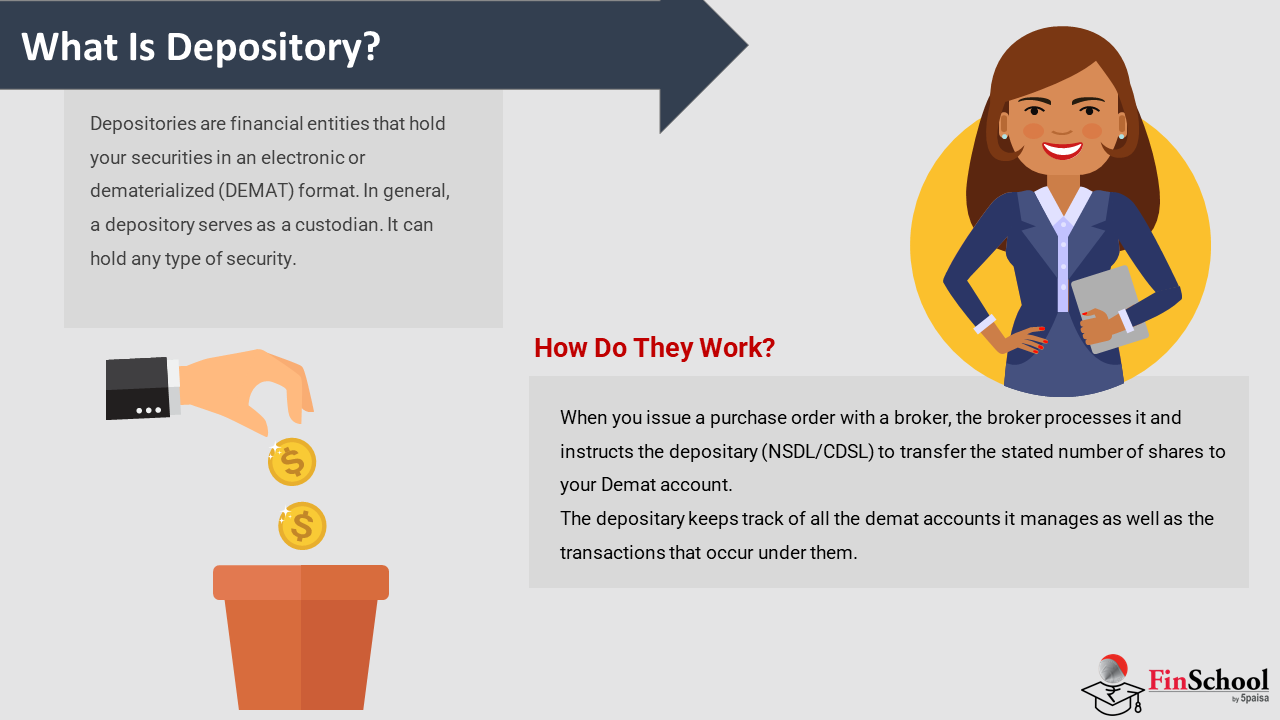
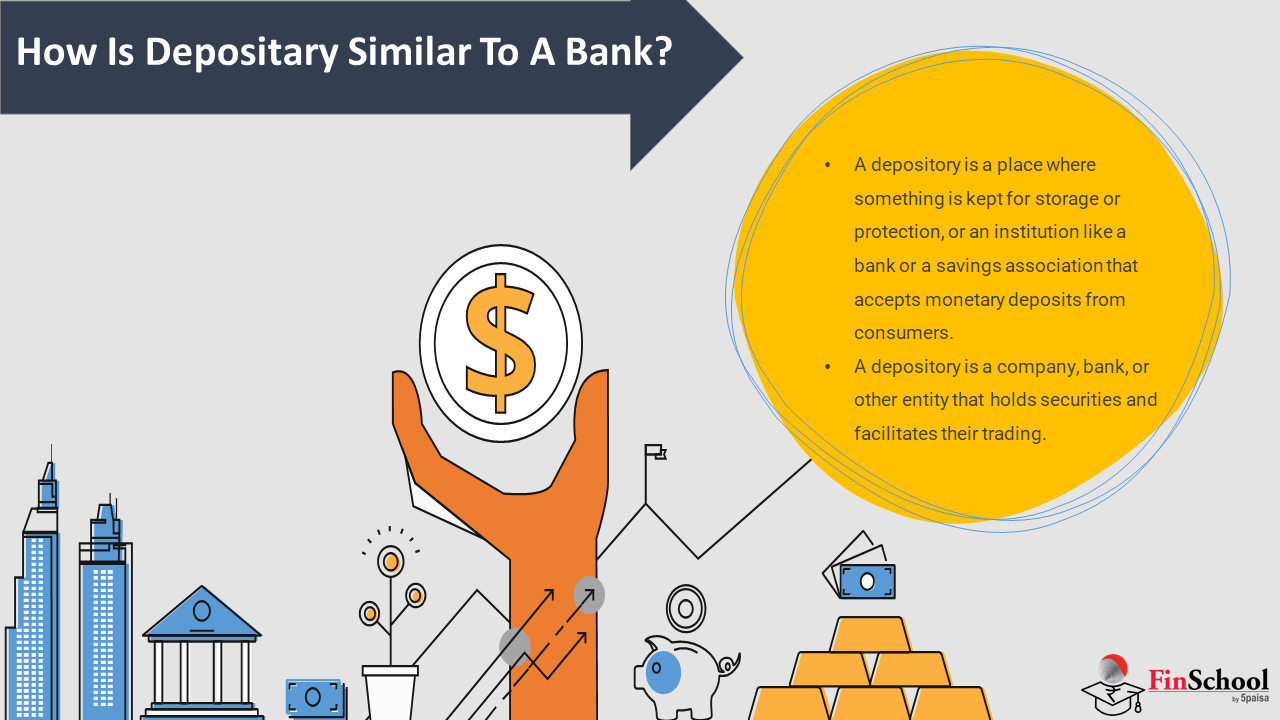
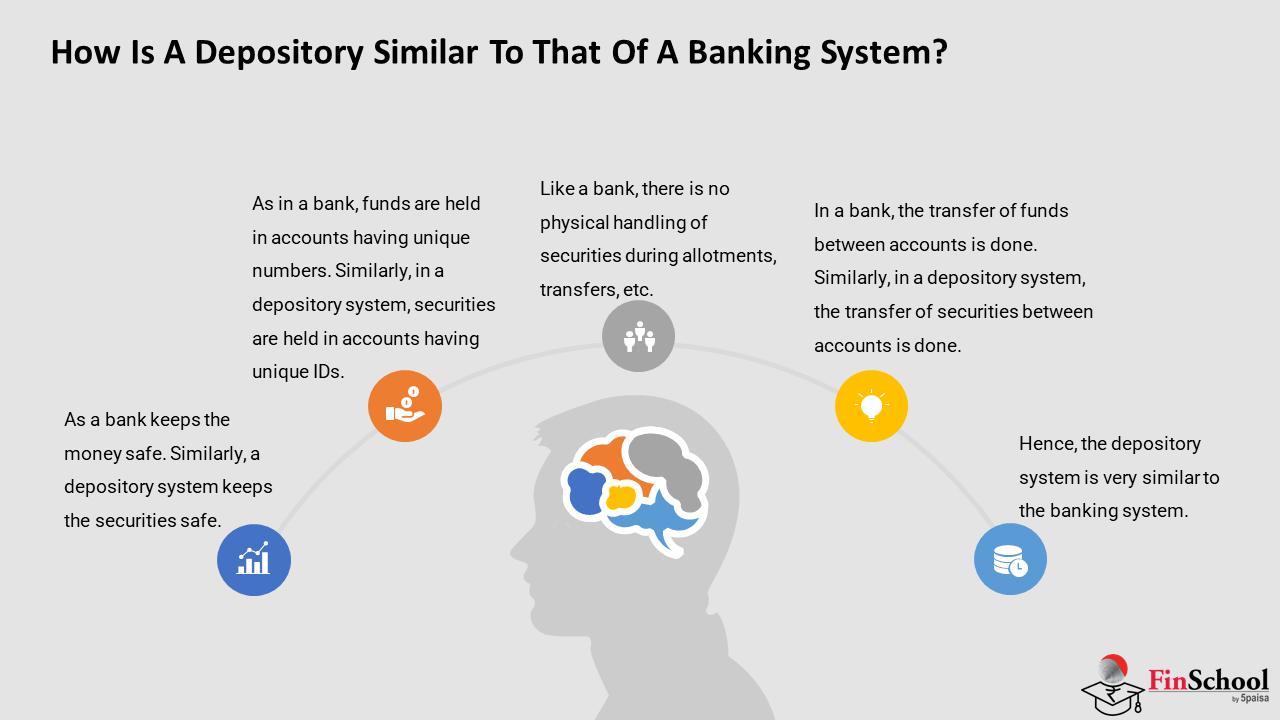
A Demat Account is an account that holds your shares in form like a digital locker. It is an account that holds your shares and securities in digital form eliminating the need for physical share certificates. It acts like an online locker allowing you to buy, sell and store stocks, mutual funds, bonds and ETFs seamlessly. Regulated by depositories like NSDL and CDSL in India a Demat Account is essential for investing and is linked to your trading and bank accounts for smooth transactions and corporate benefits like dividends and bonuses.
For example Ravi wants to invest in shares of Infosys. He opens a Demat Account with a broker, like 5paisa. On Monday he buys 100 shares of Infosys through his trading account. Of receiving physical share certificates the shares are credited electronically to his Demat Account by the next day (T+1 settlement). Over time he also receives dividends directly into his linked bank account and any bonus shares or stock splits are automatically updated in his Demat holdings. When he decides to sell the shares the transaction is processed digitally. The shares are debited from his Demat Account. Like a digital locker the Demat Account securely holds all his investments. Stocks, mutual funds, bonds. In one place making investing seamless and paperless