A technical chart pattern called a bearish engulfing pattern alerts traders to impending price declines. The pattern consists of a smaller up candle (white or green), which is eclipsed or “engulfed” by a larger down candlestick (black or red). The pattern may be significant since it indicates that sellers have surpassed buyers and are actively driving the price lower (down candle) than purchasers were able to do (up candle).
Introduction:
At the conclusion of some rising price movements, a bearish engulfing pattern can be noticed. A larger second candle signalling a move toward lower prices overtakes or engulfs the first candle showing rising momentum to signify it. When the engulfing candle’s open price is substantially higher than the first candle’s close and when its close is substantially lower than its open, the pattern is more reliable. It is stronger to see a down candle that is significantly larger than an up candle than vice versa.
What is the Bearish engulfing Pattern?
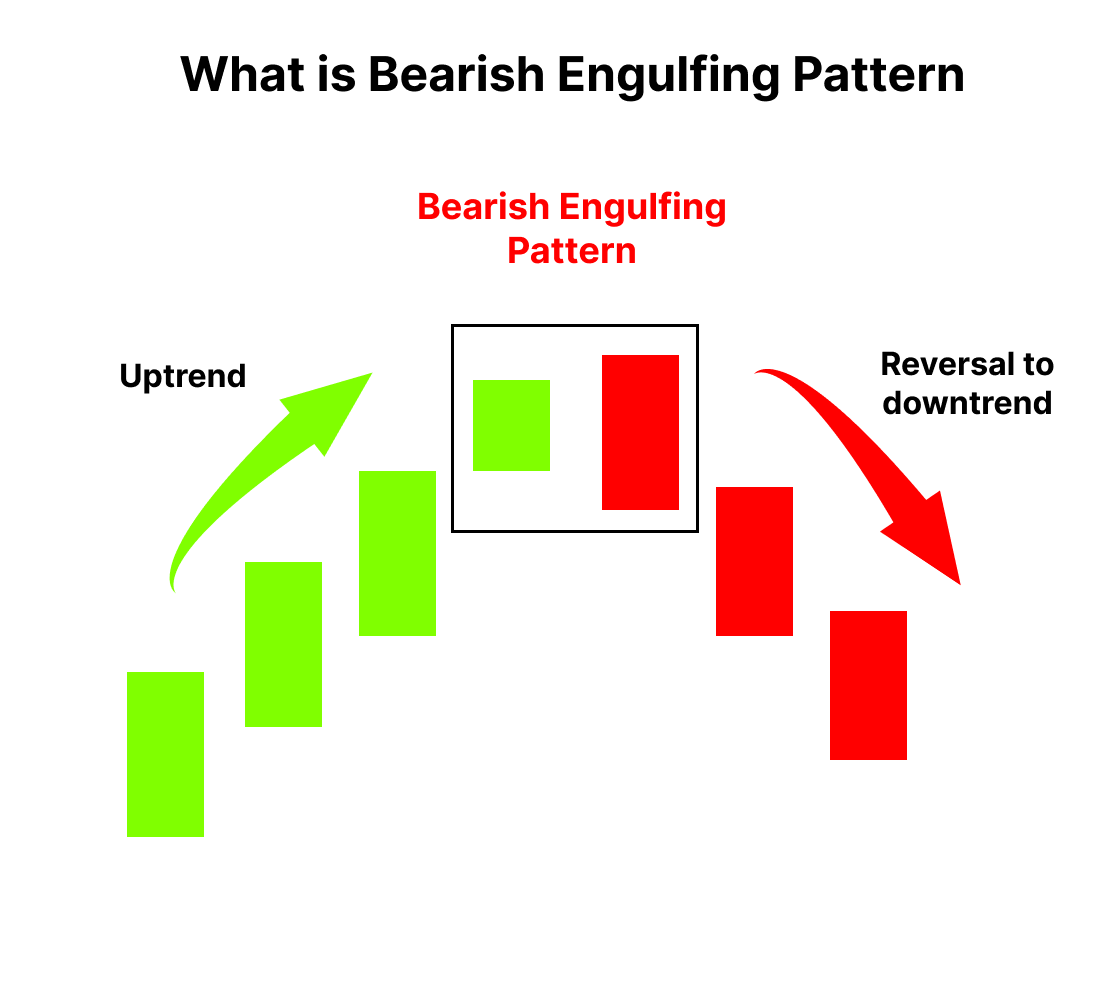
A pair of candles that appear at the peak of the trend constitute the bearish engulfing pattern; so, it is bearish.. Even if one must consider it from a shorting standpoint, the mental process is still quite similar to that of the bullish engulfing pattern.
When it comes after a clear upward movement, the pattern is also more dependable. Many engulfing patterns will develop in choppy or range-bound price action, but they are unlikely to lead to significant price changes because of the choppy or range-bound nature of the general price trend.
Typically, traders wait for the second candle to close before moving on the pattern. They then act on the third candle. Once a bearish engulfing pattern appears, one can take several actions, such as selling a long position or possibly opening a short one.
How to Identify Bearish engulfing Patterns?
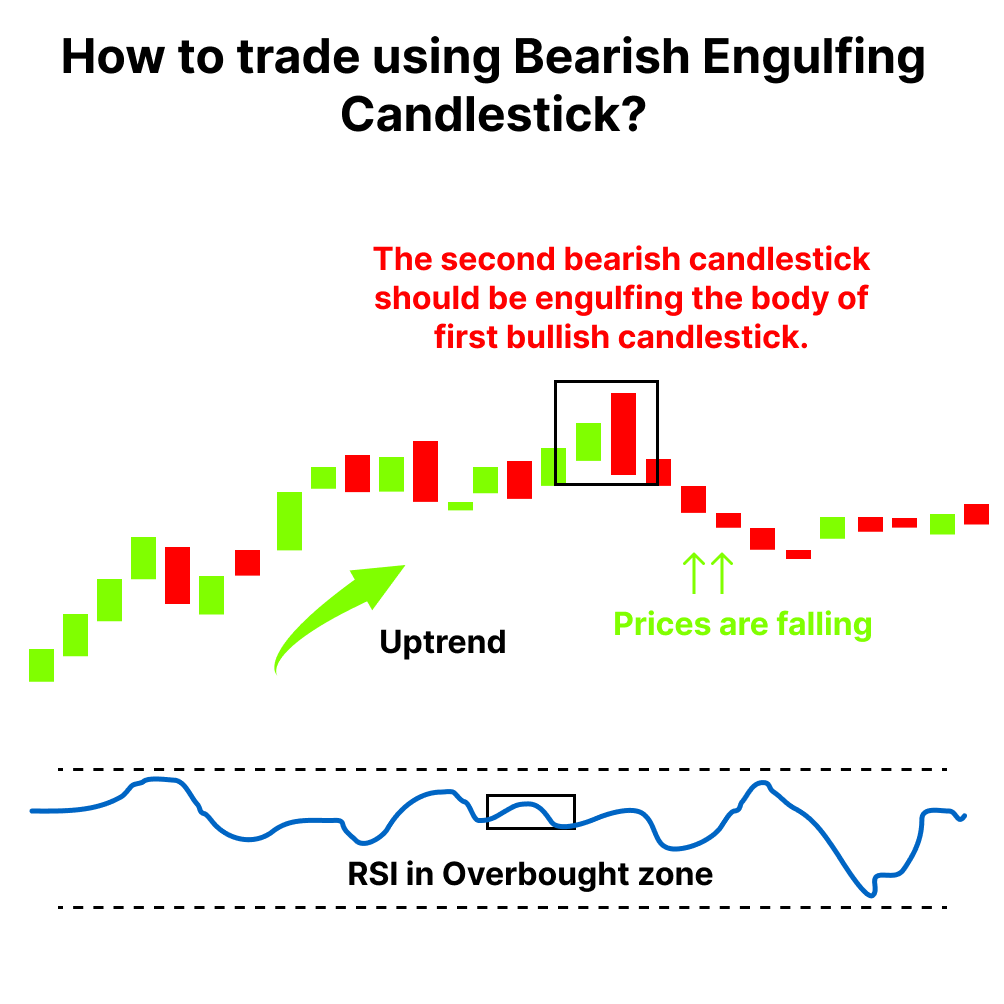
- Prices are rising steadily as the market is in an uptrend
- The market opens up and creates a fresh up on the first day of the pattern (P1). As a result, a green candle is created.
- The stock opens on the second day of the pattern (P2) near the P1 closing values and tries to set a new bottom. The prices do, however, close lower than they opened the previous day since there is more selling interest at this low point of the day. This price movement results in a red candle.
- The price movement on P2 also implies that bears attempted to break the bullish trend quite abruptly and strongly, and they were largely successful in doing so. The lengthy red candle on P2 proves this.
- The bear’s abrupt action on P2 would have caught the bulls off guard, so it kind of shocks them and makes them a little uneasy.
- The trader should hunt for selling chances because the bearishness is anticipated to persist throughout the coming trading sessions, bringing down prices.
Example of How to trade a Bearish engulfing.
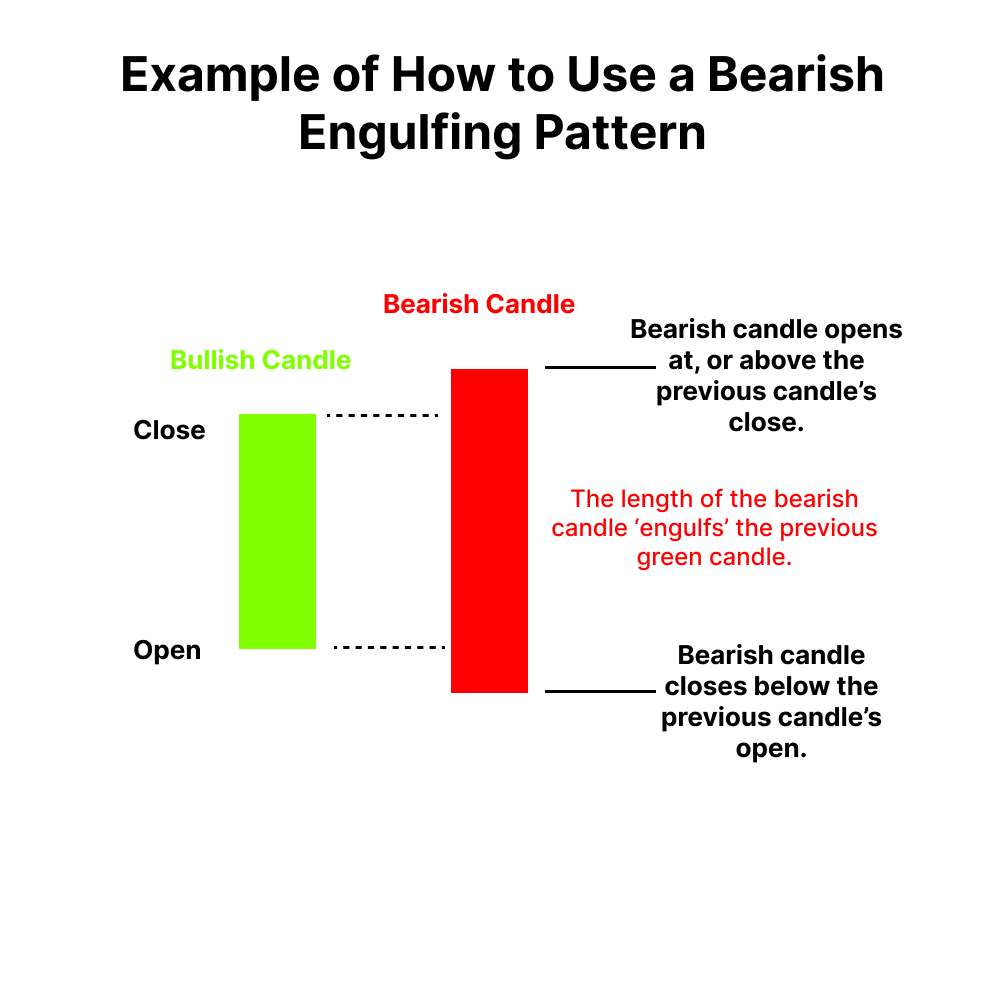
Interpretation: Engulfing Bearish pattern is a reversal pattern usually found at the end of a given uptrend and consists of two candles. During the first day, this candlestick pattern uses a small body. It is then followed by a day where the candle body fully overtakes the body from the day before it and closes in the trend’s opposite direction. Although similar to the outside reversal chart pattern, it is not essential for this pattern to fully overtake the range (high to low), rather only the open and the close. We can observe two Engulfing Bearish patterns in the chart and both the time the 2nd candle fully engulfed the previous candle and creates a trend opposite direction.
Limitations of Using Engulfing Patterns
Following a sharp price increase, engulfing patterns are particularly helpful since they make it obvious when momentum is shifting downward. Even if the price is rising overall, turbulent price action reduces the impact of the engulfing pattern because it is a pretty common indicator.
The enveloping candle or second candle could likewise be enormous. If they choose to trade the pattern, this could leave the trader with an extremely big stop loss. The trade’s potential gain could not outweigh the danger.
Conclusion
Following a downward price movement, a bullish engulfing pattern appears and predicts future price increases. In the two-candle design, the first candle is a down candle. A larger up candle with a real body that completely engulfs the smaller down candle makes up the second candle.
At the conclusion of some rising price movements, a bearish engulfing pattern can be noticed. A larger second candle signalling a move toward lower prices overtakes or engulfs the first candle showing rising momentum to signify it. When the engulfing candle’s open price is substantially higher than the first candle’s close and when its close is substantially lower than its open, the pattern is more reliable. A day following the development of the bearish engulfing pattern, a doji was formed along with a bearish engulfing pattern near the peak of the upward advance.