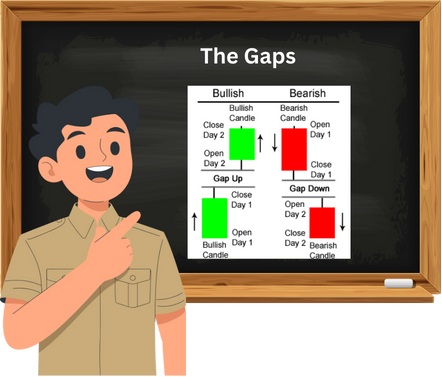
10.1 The Gaps
In this chapter we will discuss the remaining two candlestick pattern i.e Morning Star and Evening star candlestick pattern. But before we begin with this , we need to understand two common price behaviors –gap up opening and gap down opening.
A gap occurs when the stock opens different from the previous day close. This creates a visible gap between two candlesticks on daily chart. If the stock opens higher than its previous close it is called gap up and if it opens lower its a gap down.
Well , these gaps aren’t random. They often reflect strong overnight reactions to news which can be either positive or negative, earnings or global events. Traders who couldn’t act after market hours rush in the next morning, which causes the prices to jump or drop sharply at the open.
It is very important to understand the gaps because patterns like morning star and evening star often begins with one. They help us spot potential reversals and shifts in market sentiment especially when combined with candlestick formations.
Gap Up opening
A Gap up Opening occurs when a stock opens higher than the previous day close creating a visible gap between the two candlestick on daily chart. This typically reflects bullish sentiments that builds up after market hours due to factors like positive news , strong global cues or institutional buying and signals that traders are willing to pay a premium to enter positions early, often anticipating upward momentum right from the start of the trading sessions.
For example observe the two charts below


If you observe both the charts above, on 9th May 2025 Nifty 50 Index closed at 24008.00 and the next working day was 12th May 2025 Nifty 50 Index opened at 24,420.10. So Why there was a price difference?
The gap up opening on 12th May 2025, where Nifty 50 opened at 24,420.10 after closing at 24,008.00 on 9th May, was driven by a surge in positive sentiment over the weekend. Here’s what contributed to that price jump:
- Geopolitical Relief: On May 10th, India and Pakistan agreed to a ceasefirefollowing heightened tensions due to an April 22 terror attack in Pahalgam. This news significantly reduced uncertainty in the region.
- Investor Optimism: The halt in cross-border firing and announcement of DGMO-level talks created a sense of stability. Investors responded by positioning for a bullish open on Monday.
- Global Market Support: Asian and European markets were trading higher, and GIFT Nifty futures surged by 400–450 points, signaling a strong start for Indian equities.ones can trigger gap openings.
It also reinforces the idea that gaps often reflect overnight sentiment shifts, not just technical setups.
Gap down opening
It is very similar to Gap up opening. In case of gap down opening bears are more enthusiastic. They are eager to sell lower than the previous days close because they are willing to get rid of the stock somehow because of the negative news. Lets understand with an example
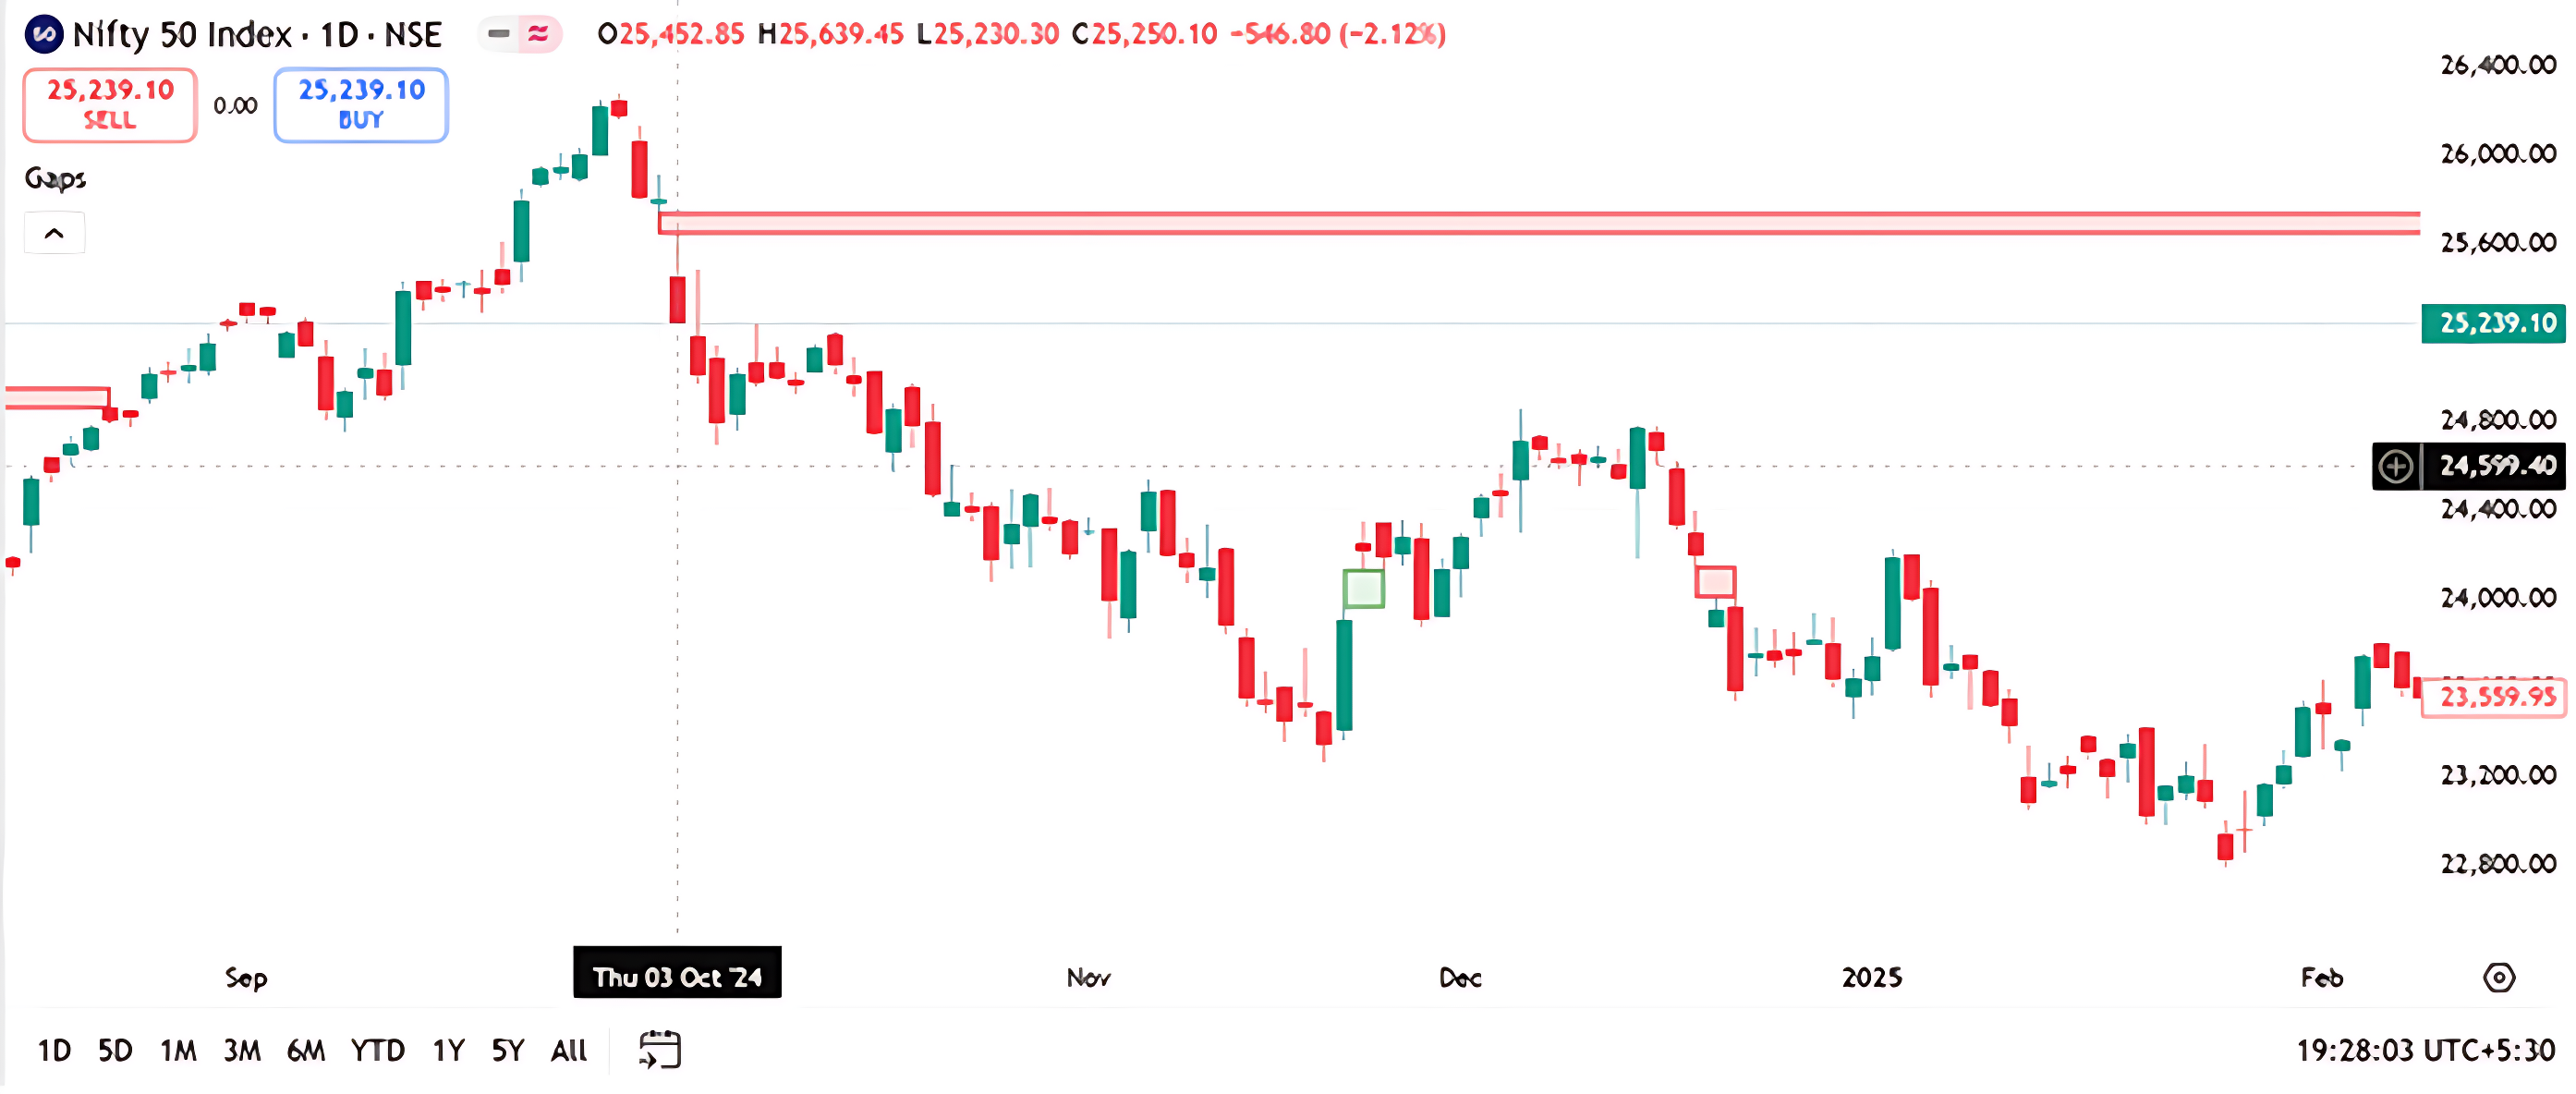

Just observe both the charts. On 3rd October 2024 the Nifty 50 closed at 25,250.10 and the very next day i.e on 4th October 2024 the Nifty 50 opened at 25181.90 which is below the closing price of previous day. You can see here a visible gap between the closing and opening prices. Now lets understand why there was a gap on these days.
Here’s what triggered the move:
- Geopolitical Tensions:Rising conflict between Iran and Israel created global uncertainty, prompting risk-off behavior across markets. This was a major sentiment dampener for Indian equities.
- Massive Wealth Erosion:The Indian stock market saw a ₹10 lakh crore wipeout in investor wealth during that week, with Nifty correcting nearly 1,000 points from its
- Aggressive FII Selling: Foreign Institutional Investors (FIIs) sold nearly $2 billion worth of Indian equities, intensifying the downward pressure
Some Activity For You

The chart shows a visible gap down in price around May 2022, followed by a recovery in the weeks ahead.
Question: If you’re a trader and you observe this gap followed by rising volume and price recovery, what could be a thoughtful next step?
- A) Assume the gap will never be filled
- B) Monitor for a potential gap-fill and bullish continuation
- C) Enter a short position immediately
- D) Ignore the gap—it has no significance
Correct Answer: B) Monitor for a potential gap-fill and bullish continuation Why: Gaps often act as support/resistance zones. If price begins to recover with volume, it may attempt to fill the gap, offering a potential bullish setup.
10.2 Morning Star

The Morning Star Candlestick Pattern is a bullish reversal pattern which appears typically at the end of a downtrend and signals the beginning of an upward move. But it is slighlty different. Here it consists of three candles a long bearish candle on day 1 which shows strong selling pressure, followed by small-bodied candle doji/spinning top which indicates indecision or pause on Day 2 and finally a long bullish candle that closes well in to the body of the first candle confirming a shift in momentum. This pattern often forms after a gap down opening and its strength increases as it accompanies by high volume suggesting that buyers are stepping in with more conviction.
Morning Star Trade Setup
Entry Strategy: A trader may start a long position on Day 3, preferably at approximately 3:20 PM, once they verify that Days 1, 2, and 3 collectively create a valid Morning Star pattern.
Typically, it’s unnecessary to wait for a confirmation on the fourth day, since the pattern indicates a strong likelihood of reversal.
Checklist for Validating Patterns:
Day 1 should be a red (bearish) candle, indicating significant bearish momentum.
Day 2 is expected to start with a gap down and create either a Doji or a spinning top, signifying uncertainty in the market.
Day 3 is expected to begin with a gap up, and by 3:20 PM, the present market price should exceed the opening price of Day 1, validating bullish momentum.
Stop-Loss Positioning: Place the stop-loss at the lowest point of the candles within the pattern (Day 1, Day 2, and Day 3) to effectively control risk.
Here in the above chart the pattern begins with the market in a firm downtrend where you can observe bears are dominating, and prices are consistently making new lows. On Day 1, this bearish momentum continues, forming a long red candle that signals aggressive selling. Then comes Day 2, which opens with a gap down, reinforcing the bearish grip. But surprisingly, the trading activity during the day creates indecision as the candle that forms is spinning top in our example. This pause in selling momentum introduces uncertainty, bears expected another strong down day, but the market hesitated.
This hesitation sets the stage for a shift. On Day 3 , the market opens with a gap up, catching the bears off guard. A strong green candle forms, and by the end of the day, it closes well above the opening of P1’s red candle. This move signals that buyers have stepped in with conviction, reversing the earlier losses. If on Day 2 hadn’t been spinning top, the combination of P1 and P3 would resemble a bullish engulfing pattern.
The third candle is the real turning point. The gap up itself shakes bearish confidence, and the sustained buying throughout the day confirms that sentiment has flipped. Traders now expect this bullish momentum to continue, making it a potential buying opportunity for the sessions ahead.
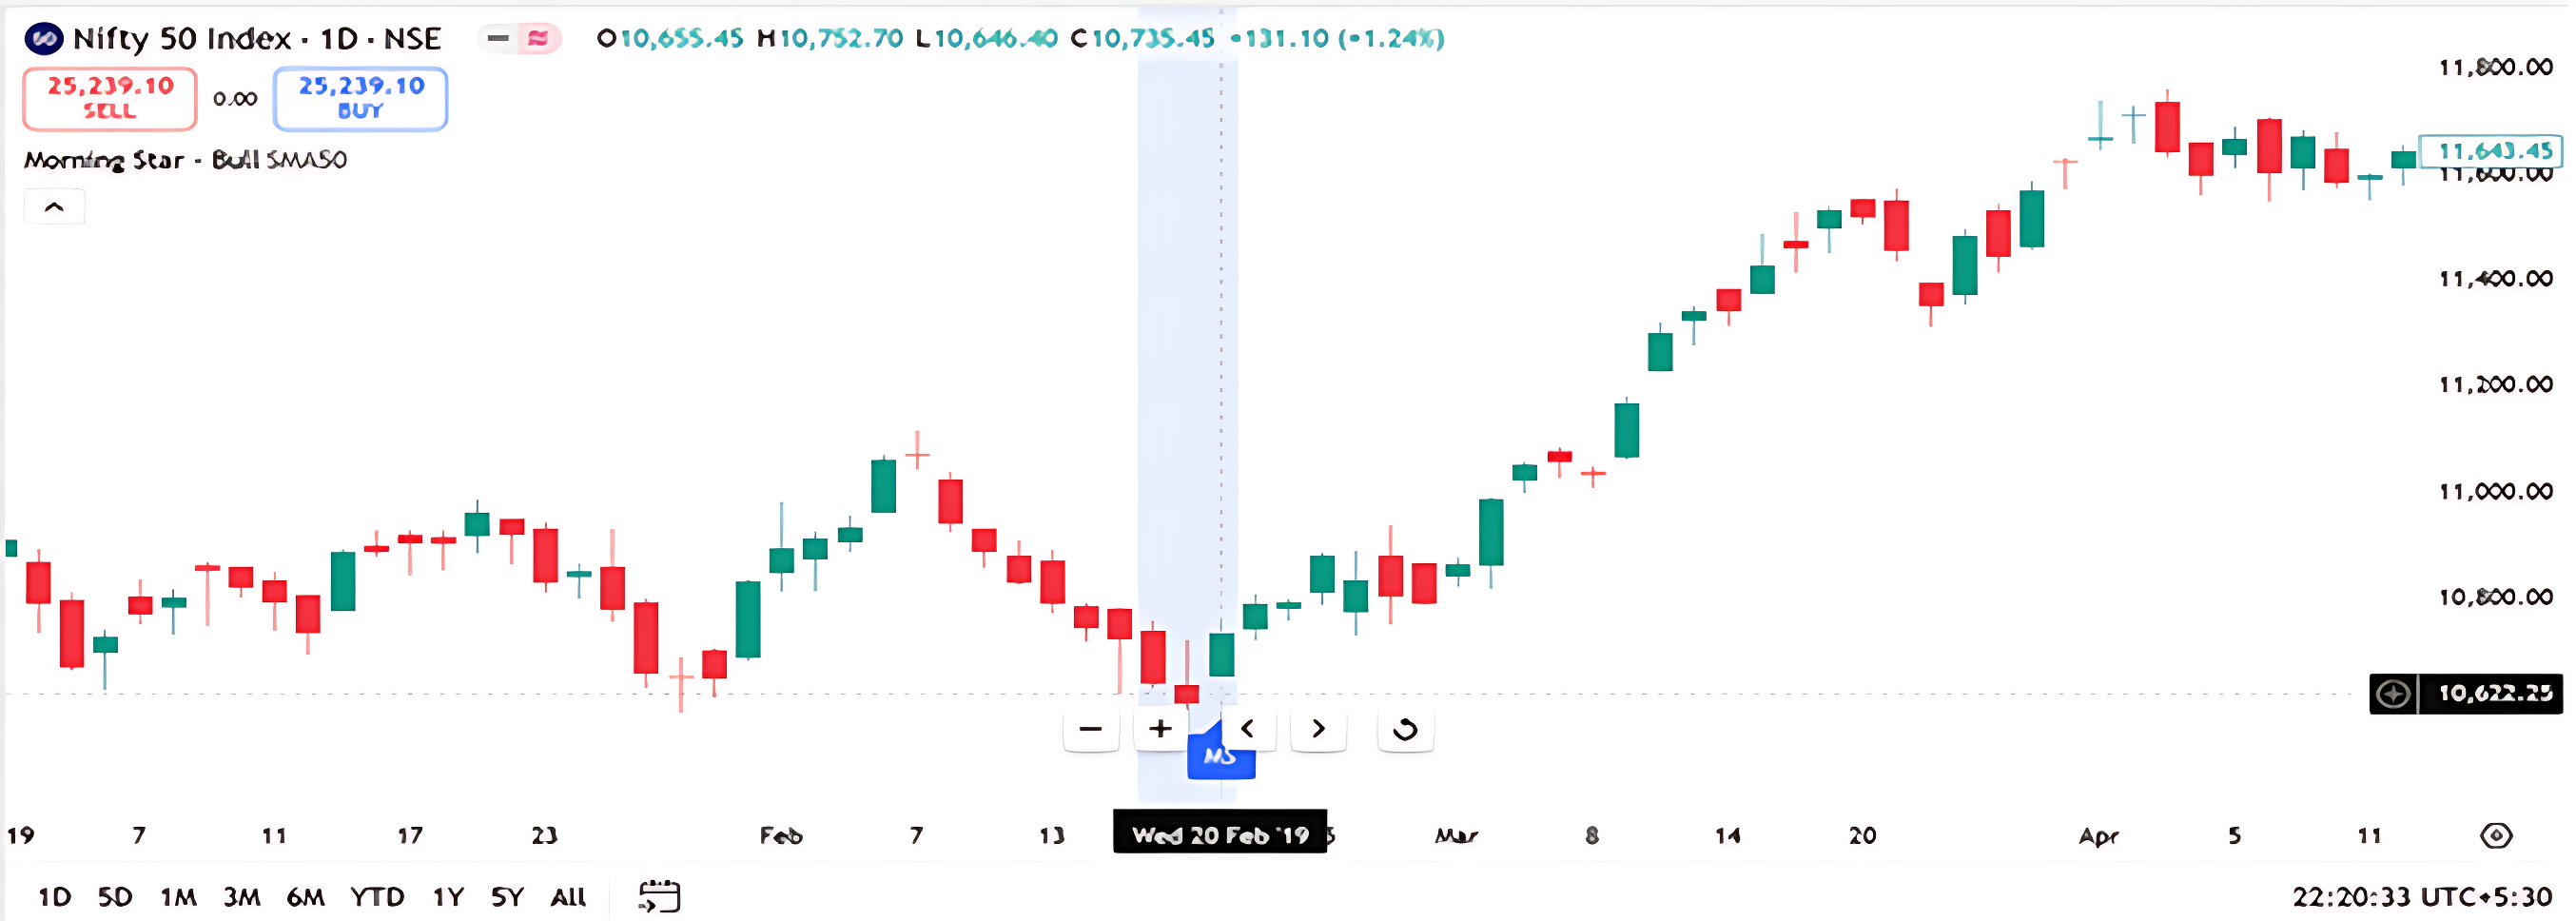
In our above example see the chart below for Day 1

The OHLC Data for Day 1 is
Open : 10738.65
High : 10759.90
Low : 10628.40
Close : 10640.95
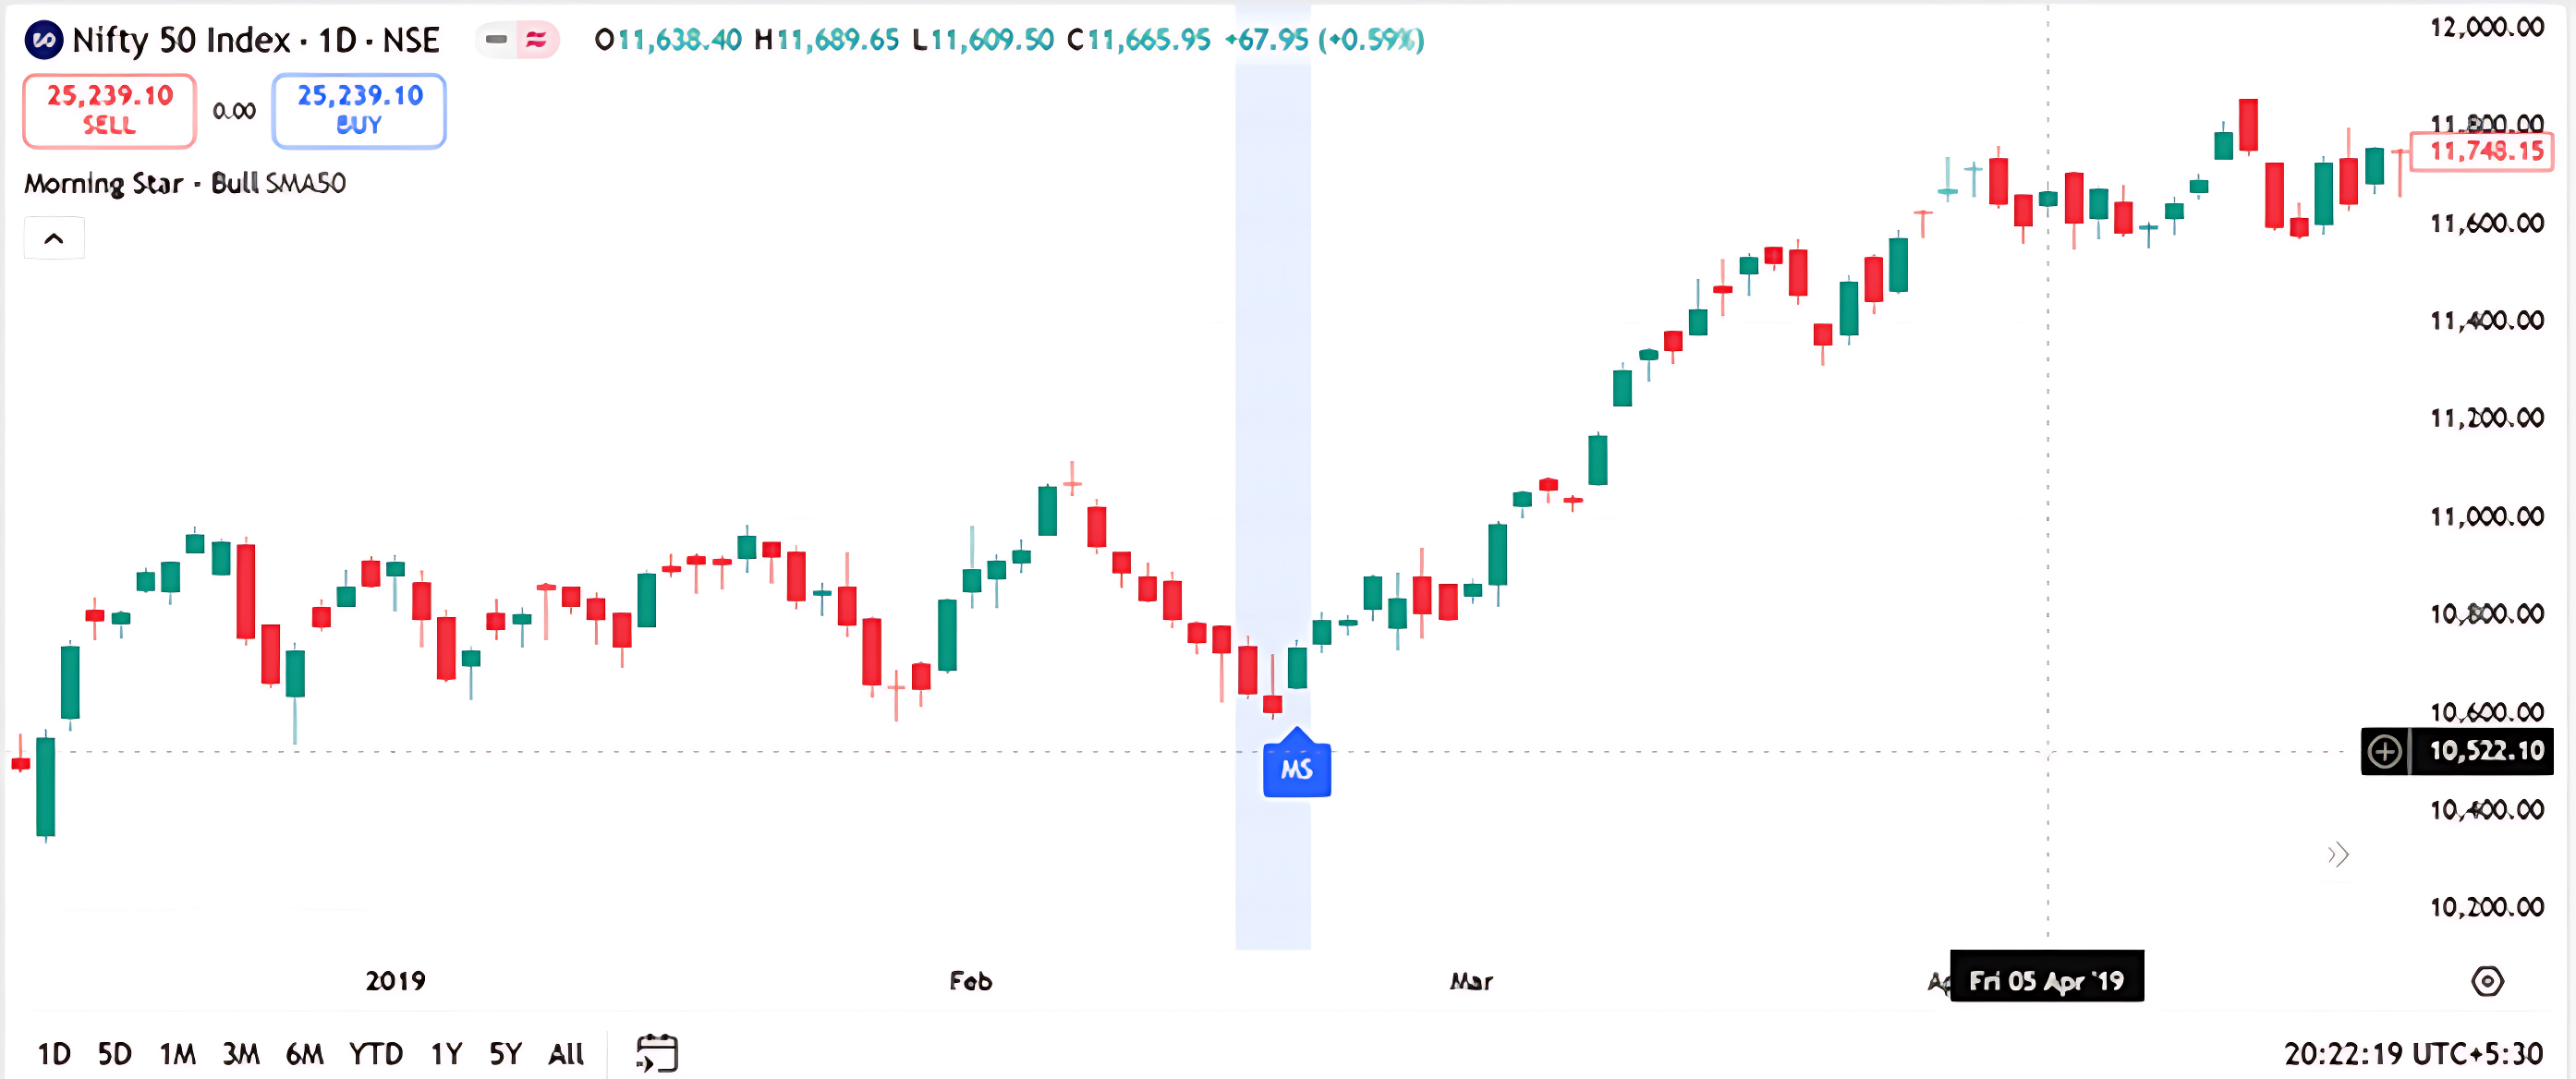
Now observe the Day 3 Chart below
The OHLC DATA for Day 3 is
Open : 10655.45
High : 10752.70
Low : 10646.40
Close:10735.45
Now from both the charts you can see that because the market opened higher on the third day, buyers kept buying throughout the day and pushed the price up enough to recover all the losses from the first day. Because the close on the third day is equal to the opening on Day 1.
Unlike single or two-candle patterns, the morning star gives both risk taker and risk avers traders the confidence to enter a trade on the third day itself. There’s usually no need to wait for a fourth-day confirmation, as the pattern itself signals a strong potential reversal.
Here’s how Arjun and Aakash will enter a long trade setup based on the morning star pattern:
- Entry Point:Plan to enter the trade at the close of Day3, ideally around 3:20 PM, once you’re confident that Day1, Day2, and Day3 together form a valid morning star.
- Pattern Validation Checklist:
- Day1 must be a red candle, showing strong bearish momentum.
- Day2 should open with a gap down and form either a doji or a spinning top, indicating market indecision.
- Day 3 should open with a gap up, and by 3:20 PM, the current market price should be above the opening price of Day1—this confirms bullish strength.
- Stop Loss Placement:Use the lowest low among the three candles (Day1, Day2, and Day3) as your stop loss level to manage risk effectively.
Activity Time

A Morning Star candlestick pattern appears on the chart in late November 2022. This bullish reversal pattern typically forms after a downtrend and consists of a long red candle, a small-bodied candle (indecision), and a long green candle.
Question: If you’re a trader and you spot this Morning Star pattern after a decline, what would be a cautious next step?
- A) Enter a short position
- B) Wait for confirmation of bullish momentum
- C) Exit all positions immediately
- D) Ignore the pattern—it’s unreliable
Correct Answer: B) Wait for confirmation of bullish momentum Why: A Morning Star suggests a potential reversal, but confirmation from the next candle (e.g., another green candle or volume increase) helps validate the signal before acting.
10.3 Evening Star Candlestick Pattern
Evening Star Candlestick Pattern is the last candlestick pattern in this chapter. The evening star is a bearish reversal candlestick pattern that typically appears at the end of an uptrend, signaling that the upward momentum may be coming to an end.
It consists of three candles that unfold in sequence:
- The first is a long green (bullish) candle showing strong buying activity which forms on Day1;
- The second opens with a gap up but forms a small-bodied candle, either a Doji or a spinning top, indicating indecision and a possible slowdown in bullish strength which forms on Day2;
- The third candle which forms on Day 3 opens with a gap down and forms a long red (bearish) candle that closes well below the midpoint of the first candle, confirming that sellers have taken control.
This shift from strong buying to hesitation and then decisive selling reflects a change in market sentiment, making the evening star a reliable signal for traders to consider exiting long positions or initiating short trades.
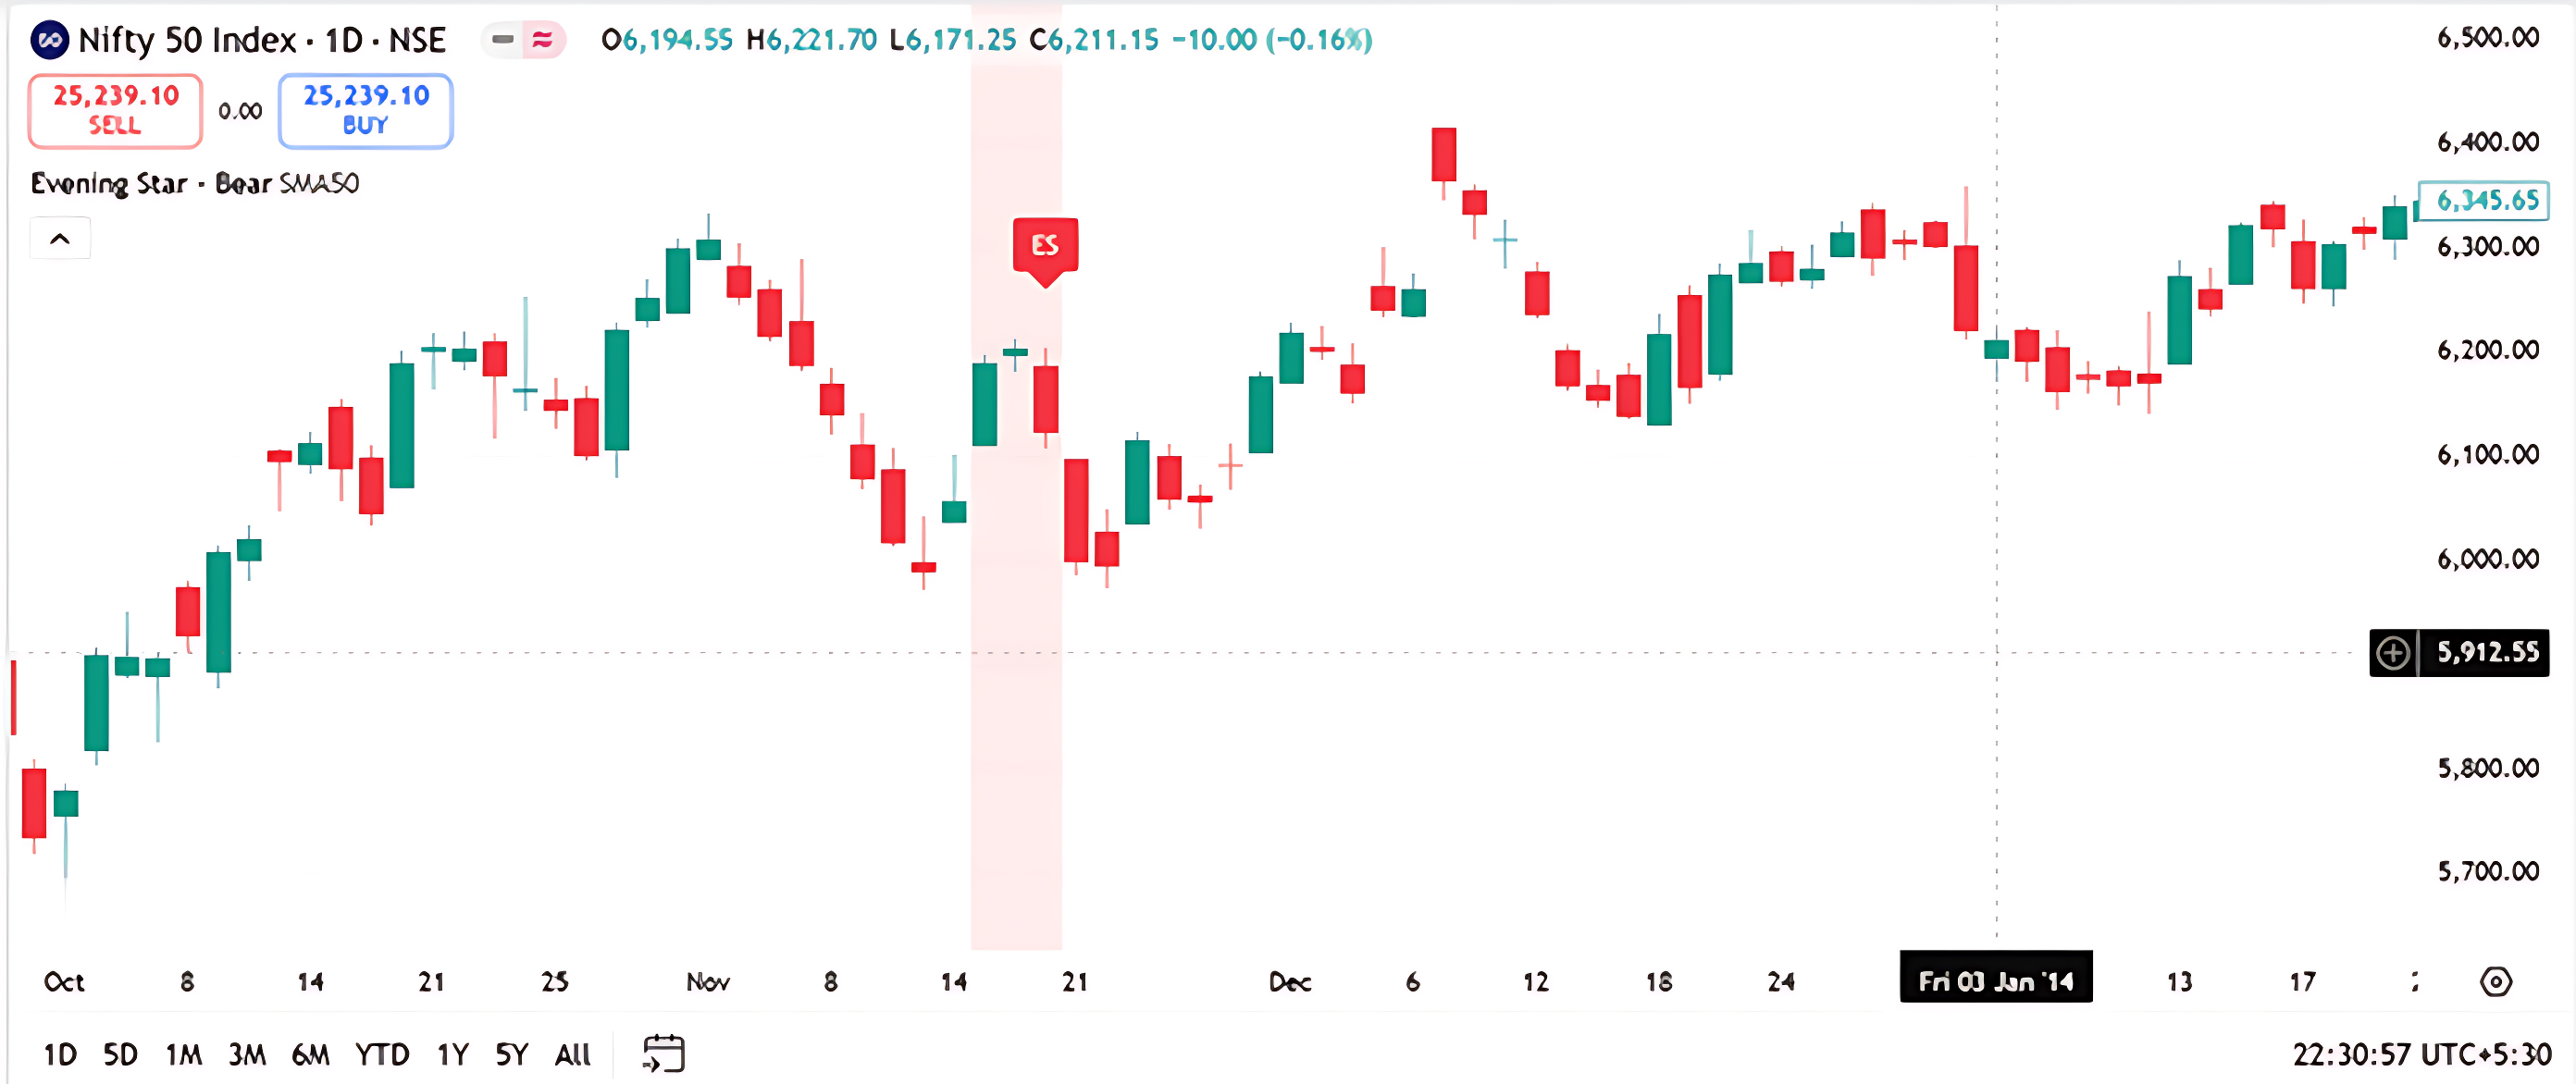
Let us understand this with the help of example . Below chart shows Day 1 bullish candle OHLC Details
Day 1 I.e. on 18th November 2013 OHLC Data

Open: 6111.05
High:6196.80
Low: 6110.40
Close: 6189
Day 2 : I.e on 19th November 2013 OHLC Data

Open : 6197.25
High:6212.40
Low:6180.20
Close:6203.35
Day 3 : I.e on 20th November 2013 OHLC Data
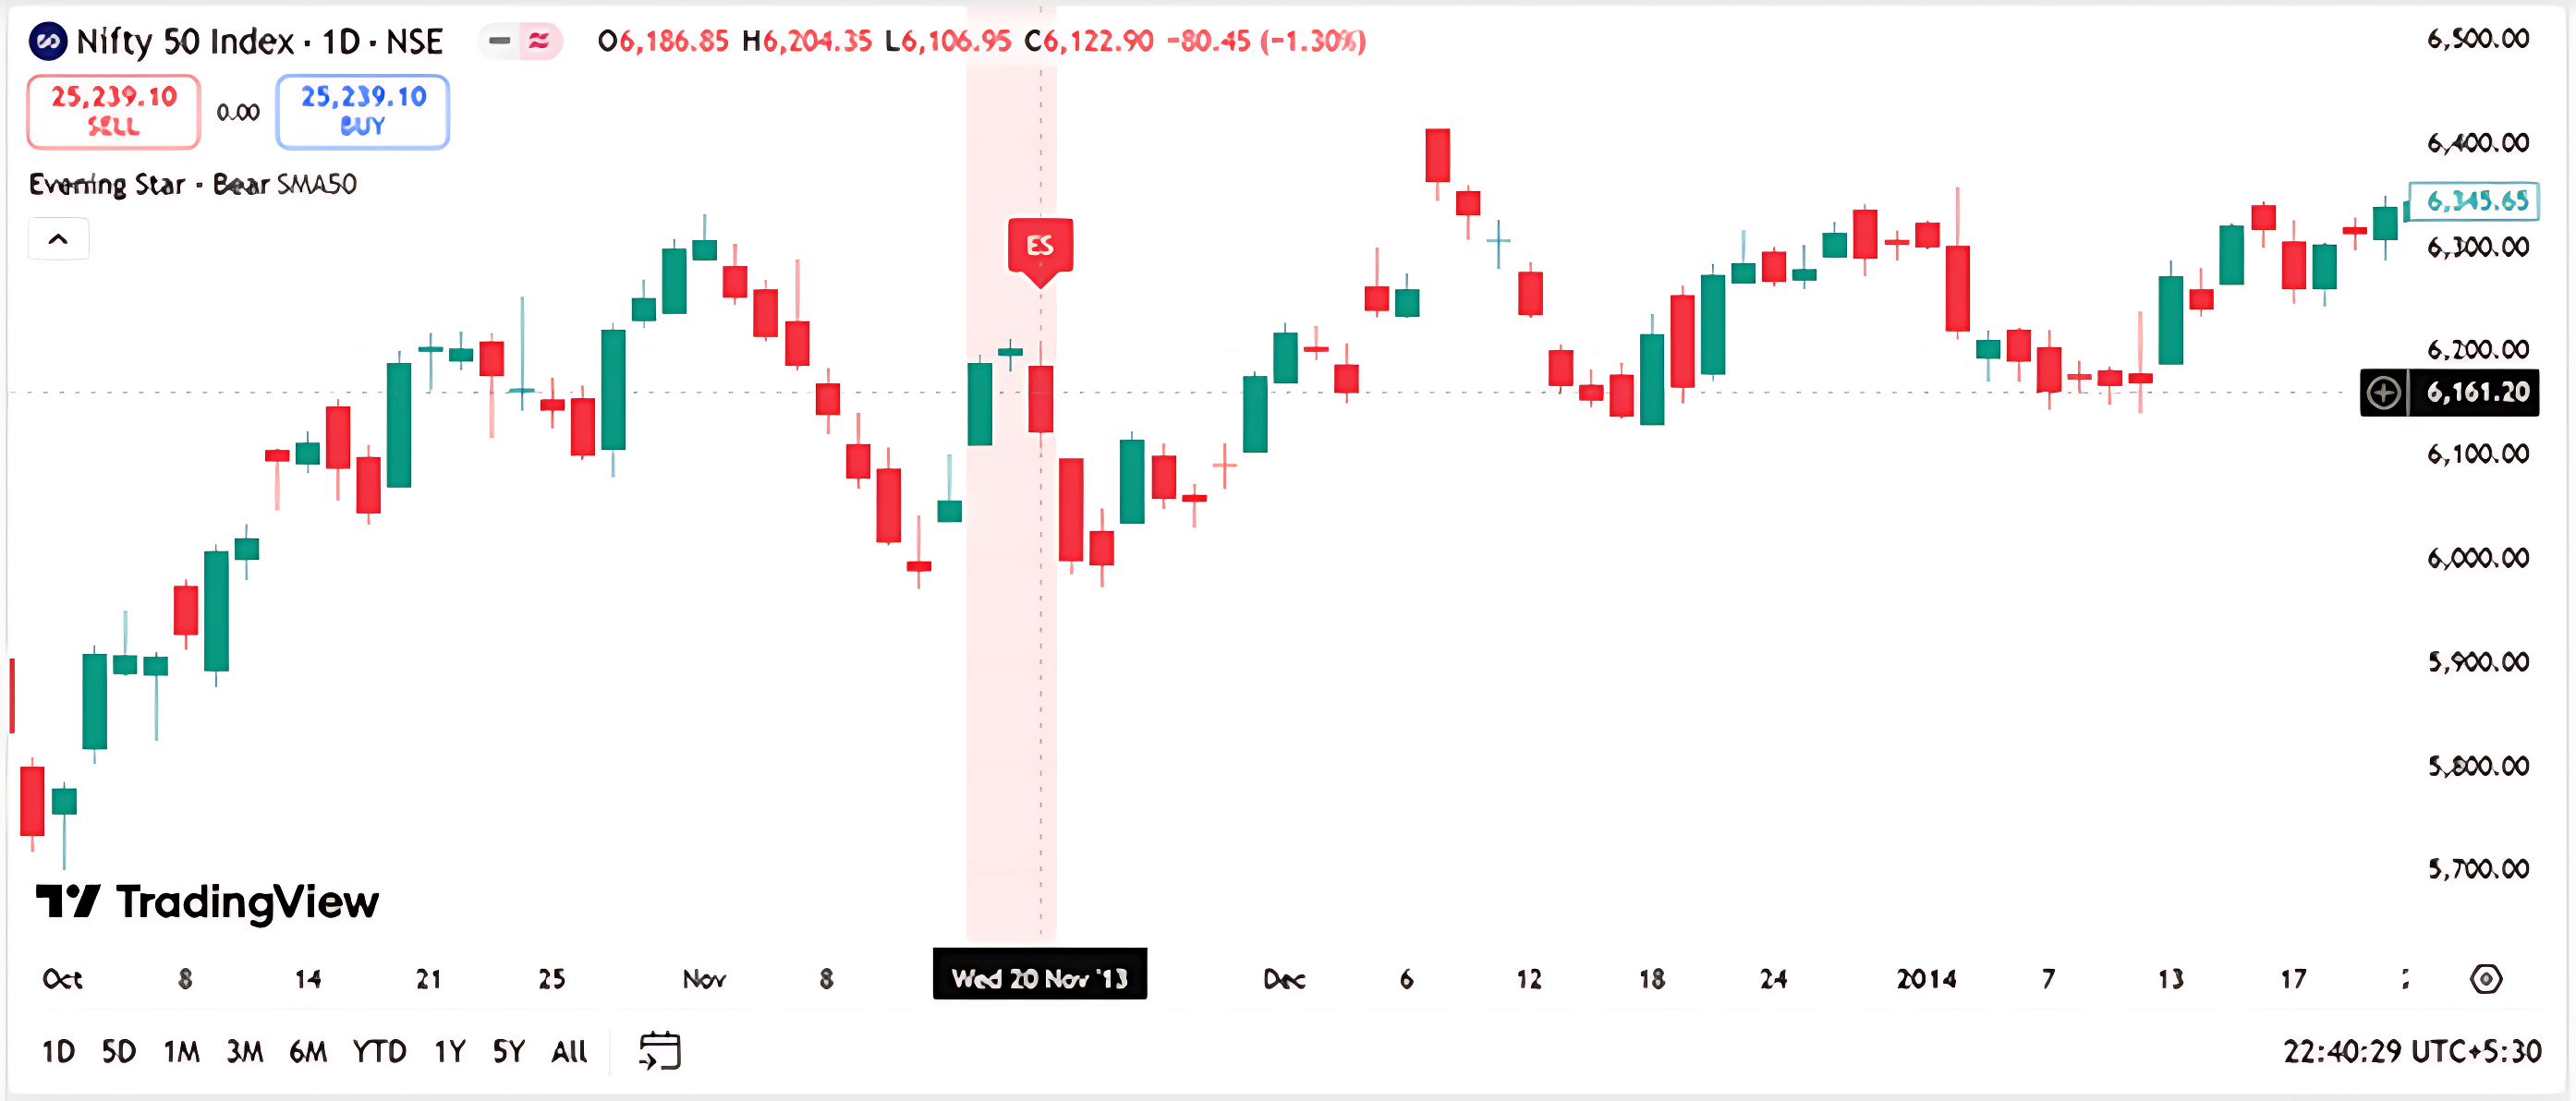
Open : 6186.85
High: 6204.35
Low: 6106.95
Close:6122.90
Now if you observe all the three charts on Day 1 a strong bullish candle is formed where buyers were in control. The market opened low and closed at high indicating bullish momentum. But on Day 2 the market opens with gap up from previous close (Day 2 Open : 6197.25 Day 1 Close : 6189) which initially suggests continued bullishness. However, the candle closes near its low, forming a small-bodied candle likely a spinning top and this indicates indecision. This is a key signal buyers are losing strength. On Day 3, the market opens with a gap down from Day 2’s close (Day 3 opening : 6186.85 Day 2 close : 6203.35) and forms a long red candle which shows sellers have taken control.
Evening Star Trade Setup
Entry Strategy :Initiate a short trade on Day 3, ideally around 3:20 PM, after confirming that Day 1 to Day 3 form a valid Evening Star pattern.
Pattern Validation Checklist
- Day1 should be a green (bullish) candle, indicating strong buying momentum.
- Day 2 must open with a gap up and form either a Doji or a spinning top, showing market indecision.
- Day 3 should open with a gap down and form a red (bearish) candle. By 3:20 PM, the current market price should be lower than the opening price of Day 1, confirming bearish control.
Trade Timing
- Both risk-takers and risk-averse traders can enter the trade on Day 3 itself, without waiting for a fourth-day confirmation.
Stop Loss Placement
- Set the stop loss at the highest high among Day 1, Day 2, and Day 3 to manage risk effectively.
Activity For You
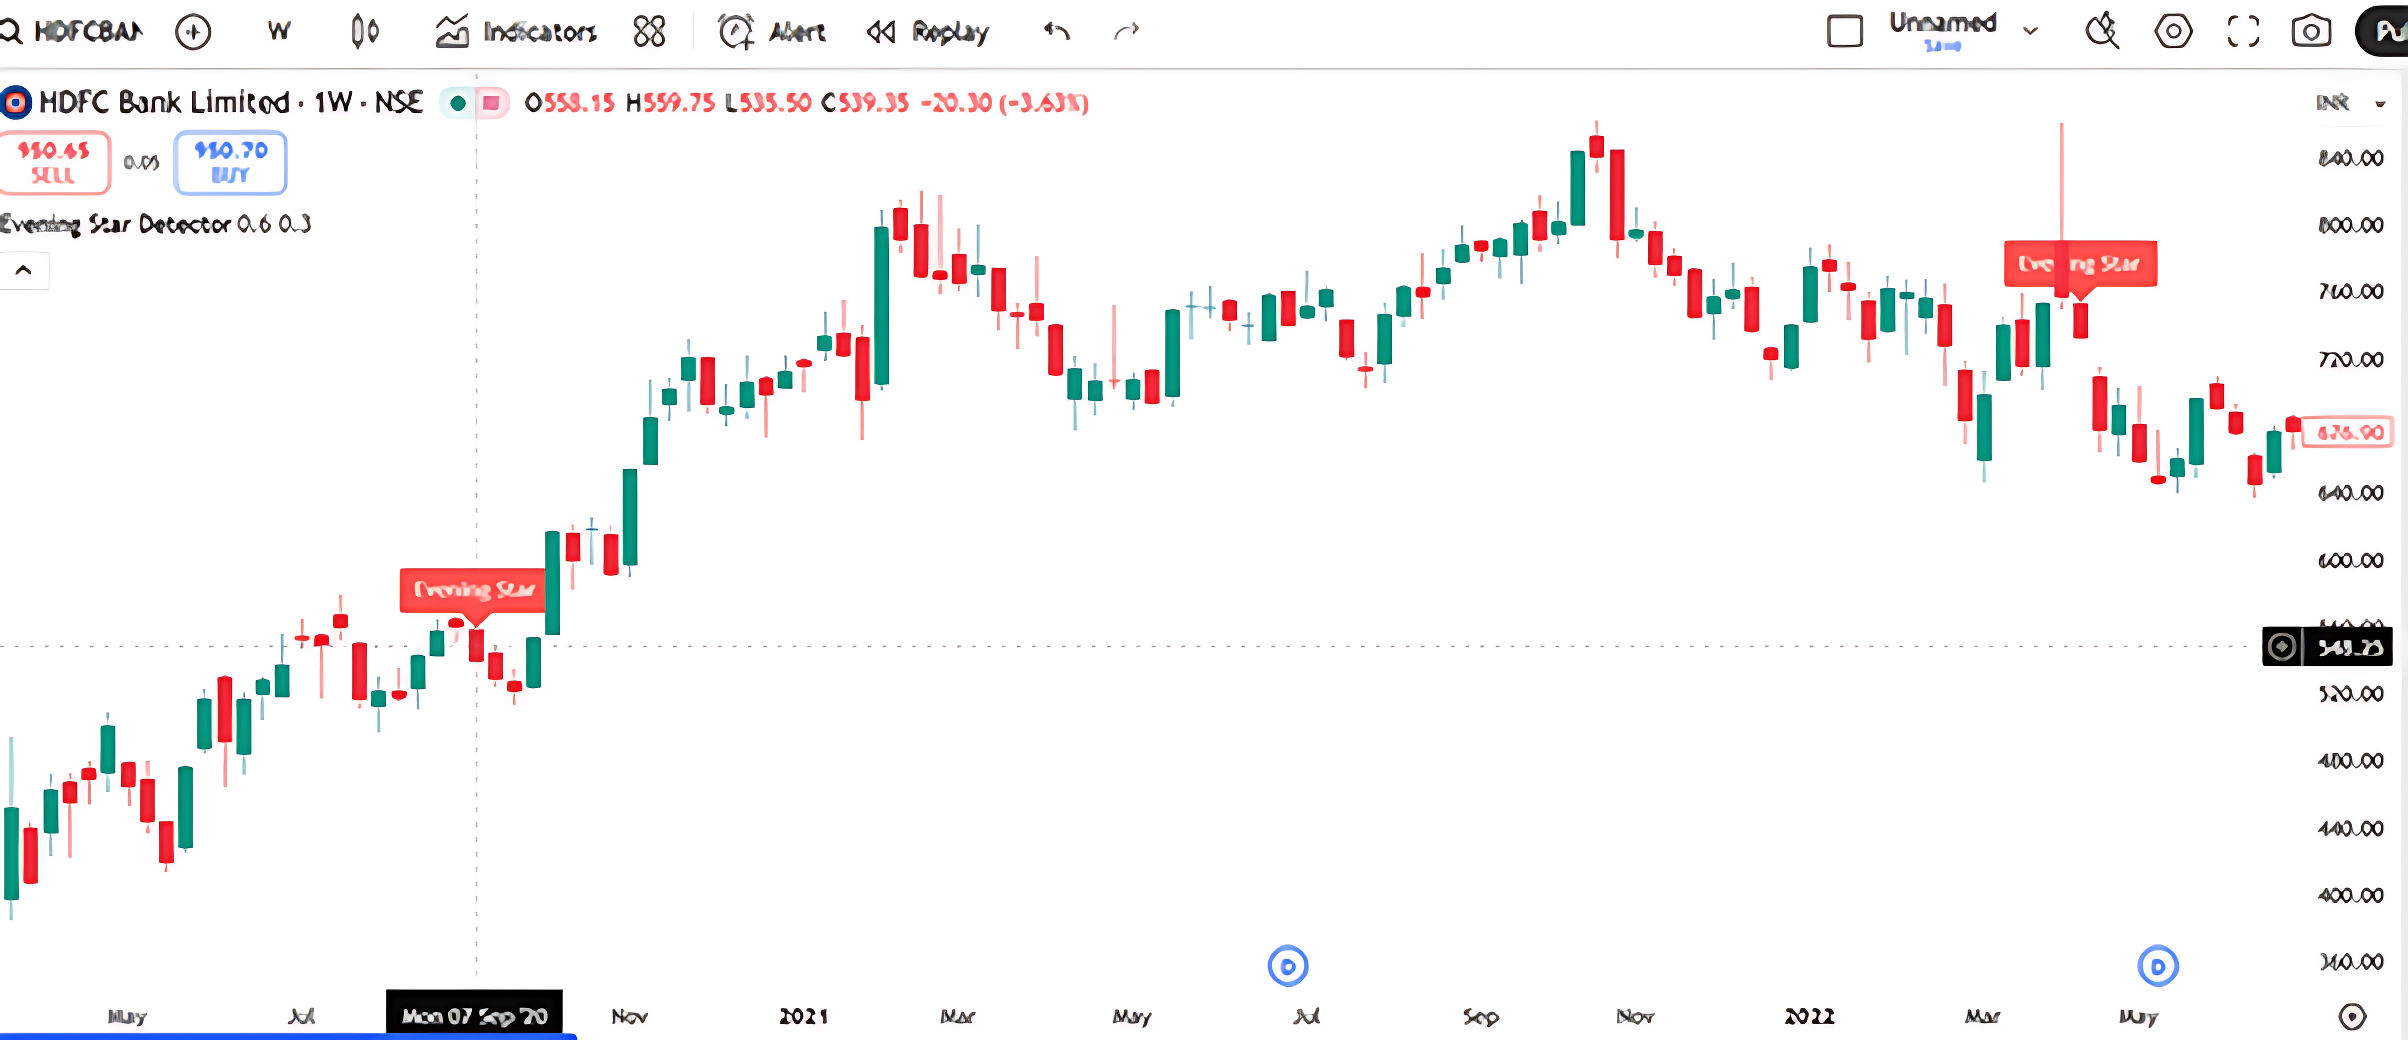
An Evening Star pattern appears on the chart twice—once in October 2020 and again in March 2022. This bearish reversal pattern typically forms after an uptrend and consists of a large green candle, a small-bodied candle (indecision), and a large red candle.
Question: If you’re a trader and you spot this pattern near a recent high, what would be a cautious next step?
- A) Enter a long position
- B) Wait for bullish confirmation
- C) Consider reducing long exposure or preparing for a reversal
- D) Ignore the signal—it’s unreliable
Correct Answer: C) Consider reducing long exposure or preparing for a reversal Why: The Evening Star is a strong bearish signal indicating potential trend reversal. It’s wise to manage risk and wait for further confirmation before making bullish trades.
10.4 Entry, Exit and Stop Loss Summary for Candlestick Trades
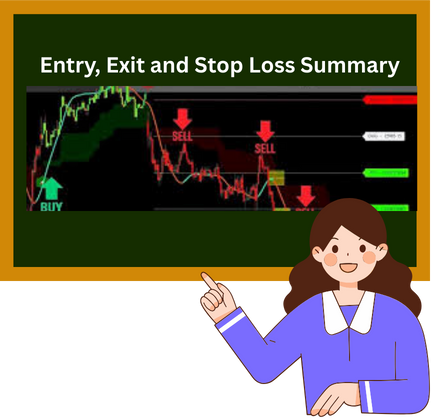
- The two types of traders who use candlestick patterns for trading are risk-averse and risk-takers, and they have different methods for determining when to enter a trade.
- Those who take risks like to move fast. Once they have verified that the pattern satisfies all necessary requirements, they enter the trade on the last day of the pattern, usually at approximately 3:20 PM. They don’t wait for additional confirmation if the setup is legitimate.
- Conversely, traders who are risk averse wait an additional day to validate the signal. They watch for a blue candle the next day for a bullish setup. They anticipate a red candle for a bearish setup. Although it may cause slightly delayed entries, this extra step helps reduce false signals.
- Generally speaking, the stronger the signal, the more candles are used to form the pattern (such as in three-day setups); therefore, it is usually acceptable to enter on the final day.
- The rule for placing a stop loss is straightforward:
- Set the stop loss for a long (buy) trade at the pattern’s lowest low for each candle.
- Set the stop loss for a short (sell) trade at the pattern’s highest high.
10.5 What’s Next?

As we conclude our journey through the foundational concepts of technical analysis, it’s clear that price action, candlestick patterns, and chart structures offer powerful insights into market psychology.We have explored how candlestick formations like the Morning Star and Evening Star reflect shifts in sentiment.By using patterns that recur over time and across asset classes, these tools enable traders to visually interpret market behavior and make well-informed decisions.
Candlestick patterns are useful for understanding market behavior, but they don’t always explain why momentum is increasing or decreasing. Technical indicators are useful in this situation. A trend’s strength, direction, and possible turning points can be determined by traders using indicators, which are mathematical computations based on price, volume, or volatility. They serve as auxiliary tools, deepening our analysis and assisting in the validation or sifting of the signals we see on the chart.
We’ll understand technical indicators in the upcoming chapters, starting with some of the most popular ones like moving averages, RSI, and MACD. We will be able to measure market conditions, pinpoint overbought or oversold areas, and improve our entry and exit tactics with the aid of these indicators. We will be more capable of confidently and clearly navigating the market’s complexities if we use indicators as our analytical compass and candlestick patterns as our visual guide.
10.6 Key TaKeaways

- Understanding Gaps: Gaps occur when a stock’s opening price is different from its previous day’s closing price, creating a visible space between the two candlesticks on a daily chart.
- Gap Up Opening: This happens when a stock opens higher than its previous close, often reflecting bullish sentiment due to positive news, strong global cues, or institutional buying.
- Gap Down Opening: This is the opposite of a gap up, where the stock opens lower than its previous close, often driven by negative news or a desire by traders to get rid of the stock.
- Morning Star Pattern: The Morning Star is a three-candle bullish reversal pattern that typically appears at the end of a downtrend and signals the beginning of an upward move.
- Morning Star Candle Sequence: The pattern consists of a long bearish candle on Day 1, a small-bodied candle (Doji or spinning top) on Day 2, and a long bullish candle on Day 3 that closes well within the body of the first candle.
- Morning Star Confirmation: The pattern often begins with a gap down on Day 2 and is confirmed by a gap up on Day 3, which catches bears off guard and signals that buyers have stepped in with conviction.
- Evening Star Pattern: This is a bearish reversal pattern that typically appears at the end of an uptrend, signaling that upward momentum may be ending.
- Evening Star Candle Sequence: It consists of a long bullish candle on Day 1, a small-bodied candle (Doji or spinning top) on Day 2 that opens with a gap up, and a long bearish candle on Day 3 that opens with a gap down and closes well below the midpoint of the first candle.
- Trader Entry Strategies: For three-candle patterns like the Morning Star and Evening Star, both risk-takers and risk-averse traders can enter a trade on the third day itself, as the pattern itself signals a strong potential reversal and there is usually no need to wait for a fourth-day confirmation.
- Stop-Loss Placement: For a long (buy) trade, the stop-loss is placed at the lowest low among the candles in the pattern. For a short (sell) trade, the stop-loss is set at the highest high of the pattern.