
What is Hammer Candlestick Pattern?
Hammer Candlestick Pattern is a bullish reversal pattern often used in technical analysis to identify potential trend reversals in financial markets. It typically appears after a downtrend and signals that the market may be “ Hammering out” a bottom before reversing upward. The Hammer candlestick pattern is widely used by traders to spot buying opportunities, but its essential to combine it with other technical analysis for better accuracy. Let us understand this concept in detail.
Definition of Hammer Candlestick Pattern
Hammer candlestick pattern is a significant pattern in technical analysis which is vital for predicting potential price reversal in the markets. It appears as single candlestick pattern appearing at the bottom of a downtrend and it signals a potential bullish reversal.
Market Psychology behind Hammer Candlestick pattern
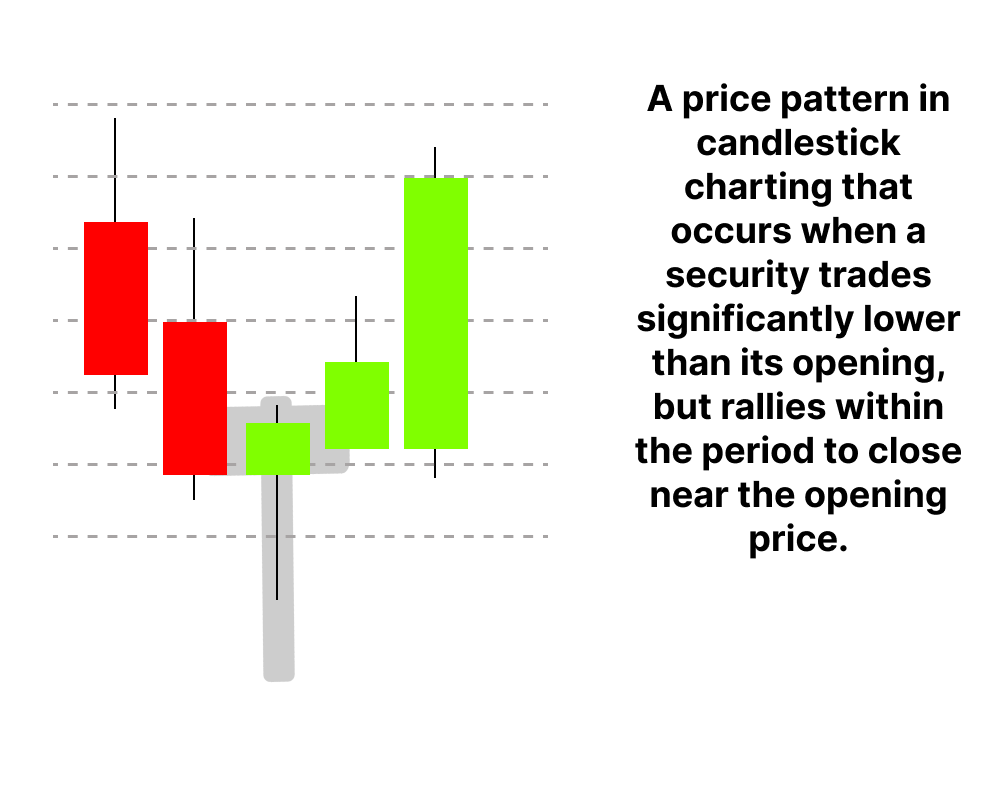
The hammer candlestick pattern reflects a a very important shift in market psychology especially during a downtrend. Here is the psychological narrative behind it
- Initail Selling Pressure : At the beginning of the session, sellers dominate pushing the price significantly lower. This reflects bearish sentiments and a belief that assets value will continue to decline.
- Buyers Entry : As the price starts to drop buyers perceive it as an opportunity to purchase at a lower price. This buying pressure begins to counteract the selling momentum.
- Intra-Session Reversal: Buyers gain control and push the prices back up creating a long lower shadow. This indicates a struggle between bullish and bearish forces
- Bullish Strategies : By the end of the session, the price closes near or above the opening level signaling that buyers have regained control. This shift in sentiment hints at a potential reversal.
- Market Sentiment Shift : The hammer pattern showcases a transition from bearish to bullish sentiment, suggesting that the downtrend may be losing steam and a reversal could be imminent.
Key characteristics of Hammer candlestick pattern
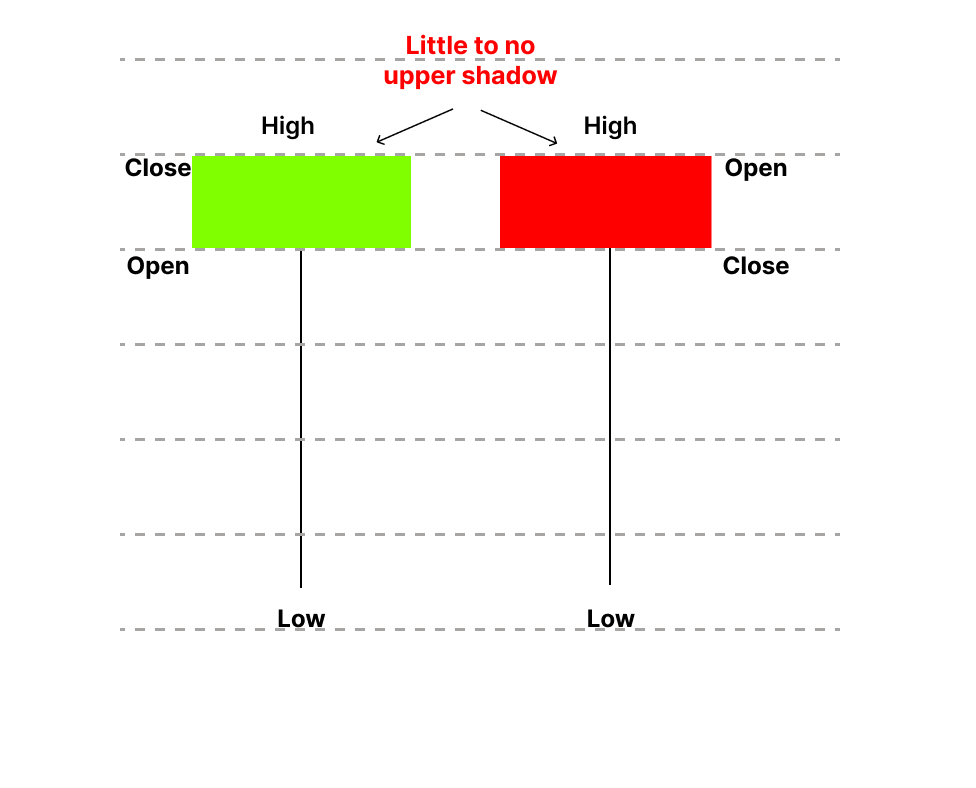
Small Real Body
The real body of the hammer is relatively small and situated near the top of the candlestick. This indicates that the opening and closing price are close to each other. This signals indecision among the traders. However the position of the body near the top shows that buyers ultimately took control at the end of the session.
Long Lower Shadow
The hall mark of the hammer pattern is its long lower shadow. It is at least twice the size of the real body. This shadow represents the lowest point that the price reached during the session. It shows that sellers initially exerted significant pressure. Driving prices lower. But eventually buyers stepped in and drove the prices back up reflecting strong buying momentum.
Little or no Upper shadow
The absence of an upper shadow implies that buyers maintained control until the session closed. This strengthens the bullish sentiment and suggests a potential reversal of the downtrend.
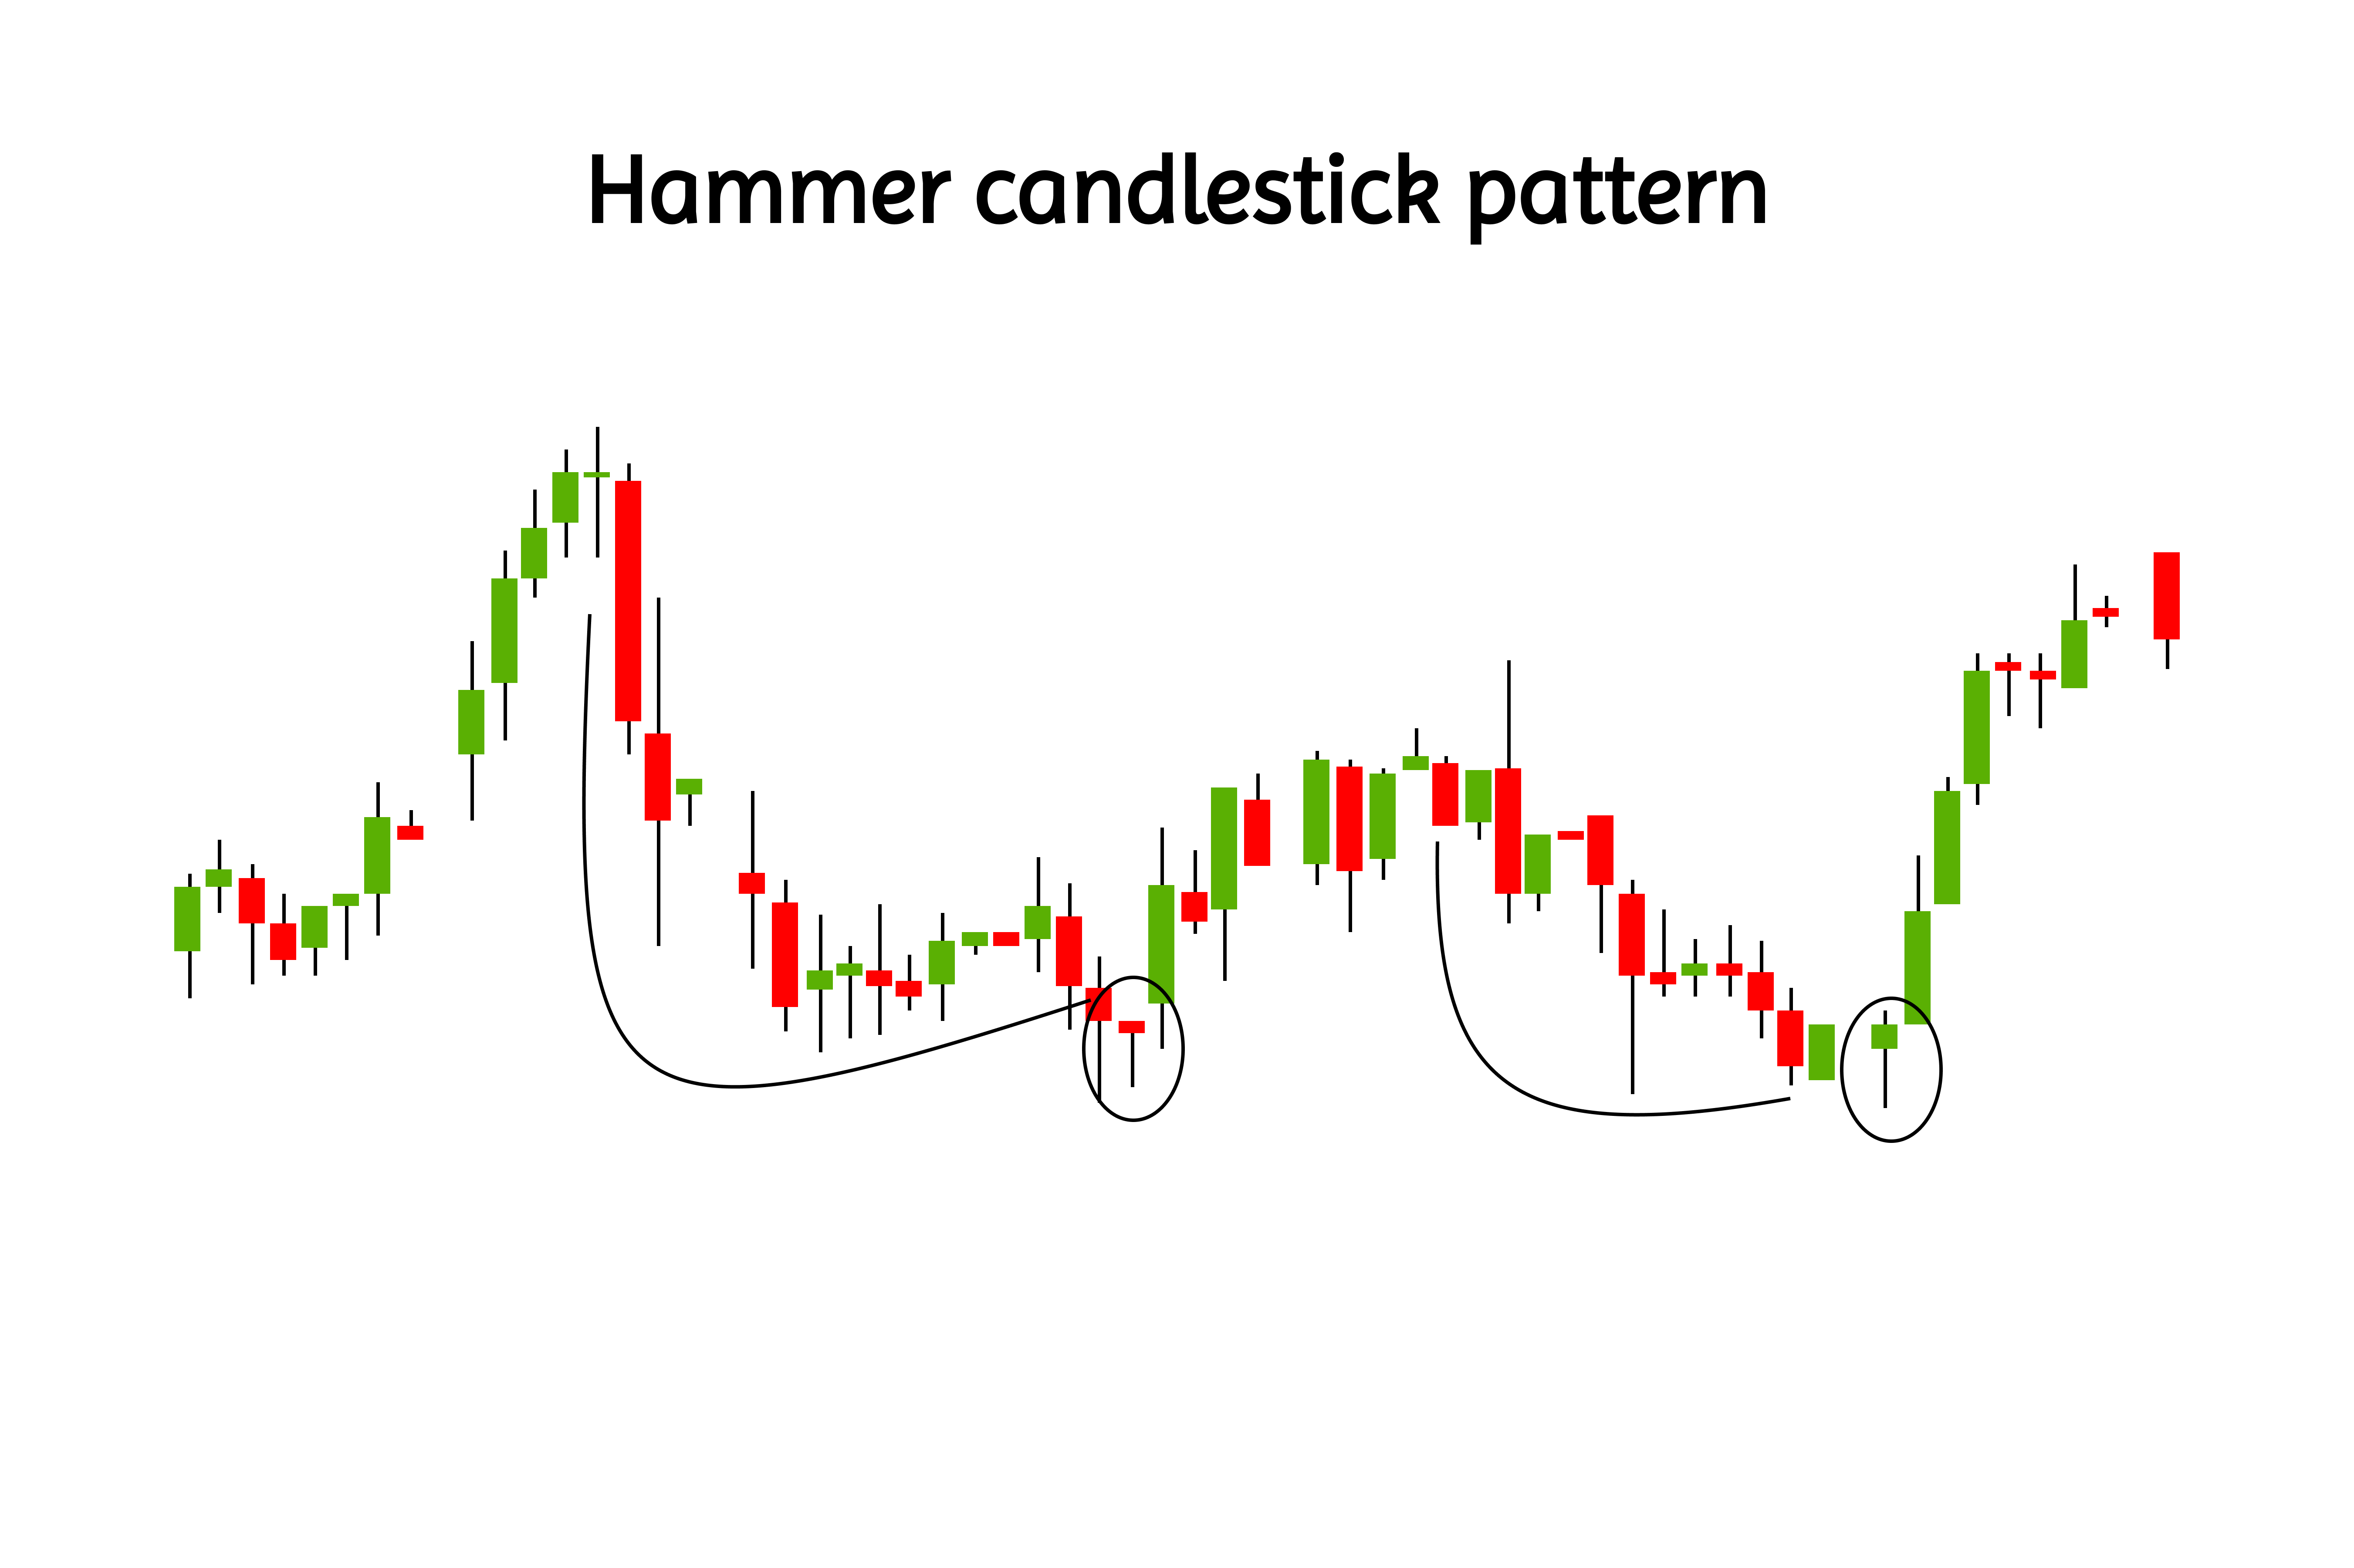
Appearance after the downtrend
The hammer pattern typically forms after a sustained downtrend. This is significant because it signals the exhaustion of bearish force. This is means there is a possibility of reversal. Traders interpret the hammer as a sign that selling pressure is weakening and that buyers are regaining confidence and there are chances of a potential uptrend.
Bullish Hammer v/s Hanging Man Pattern
Bullish Hammer and the Hanging Man pattern candlestick pattern may look very similar but they are different depending on their placements in the trend. Lets understand each one in detail
Bullish Hammer candlestick pattern

Bullish Hammer appears after a downtrend and signals a potential reversal to the upside. It indicates that the sellers initially dominated the session driving prices lower, but buyers stepped in and regained control by the close. This suggests weakening bearish momentum and growing bullish sentiment. It is A bullish reversal pattern inviting traders to consider buying positions after confirmation. Bullish Hammer looks for an upward price movement in the following session to validate the reversal.
Hanging Man
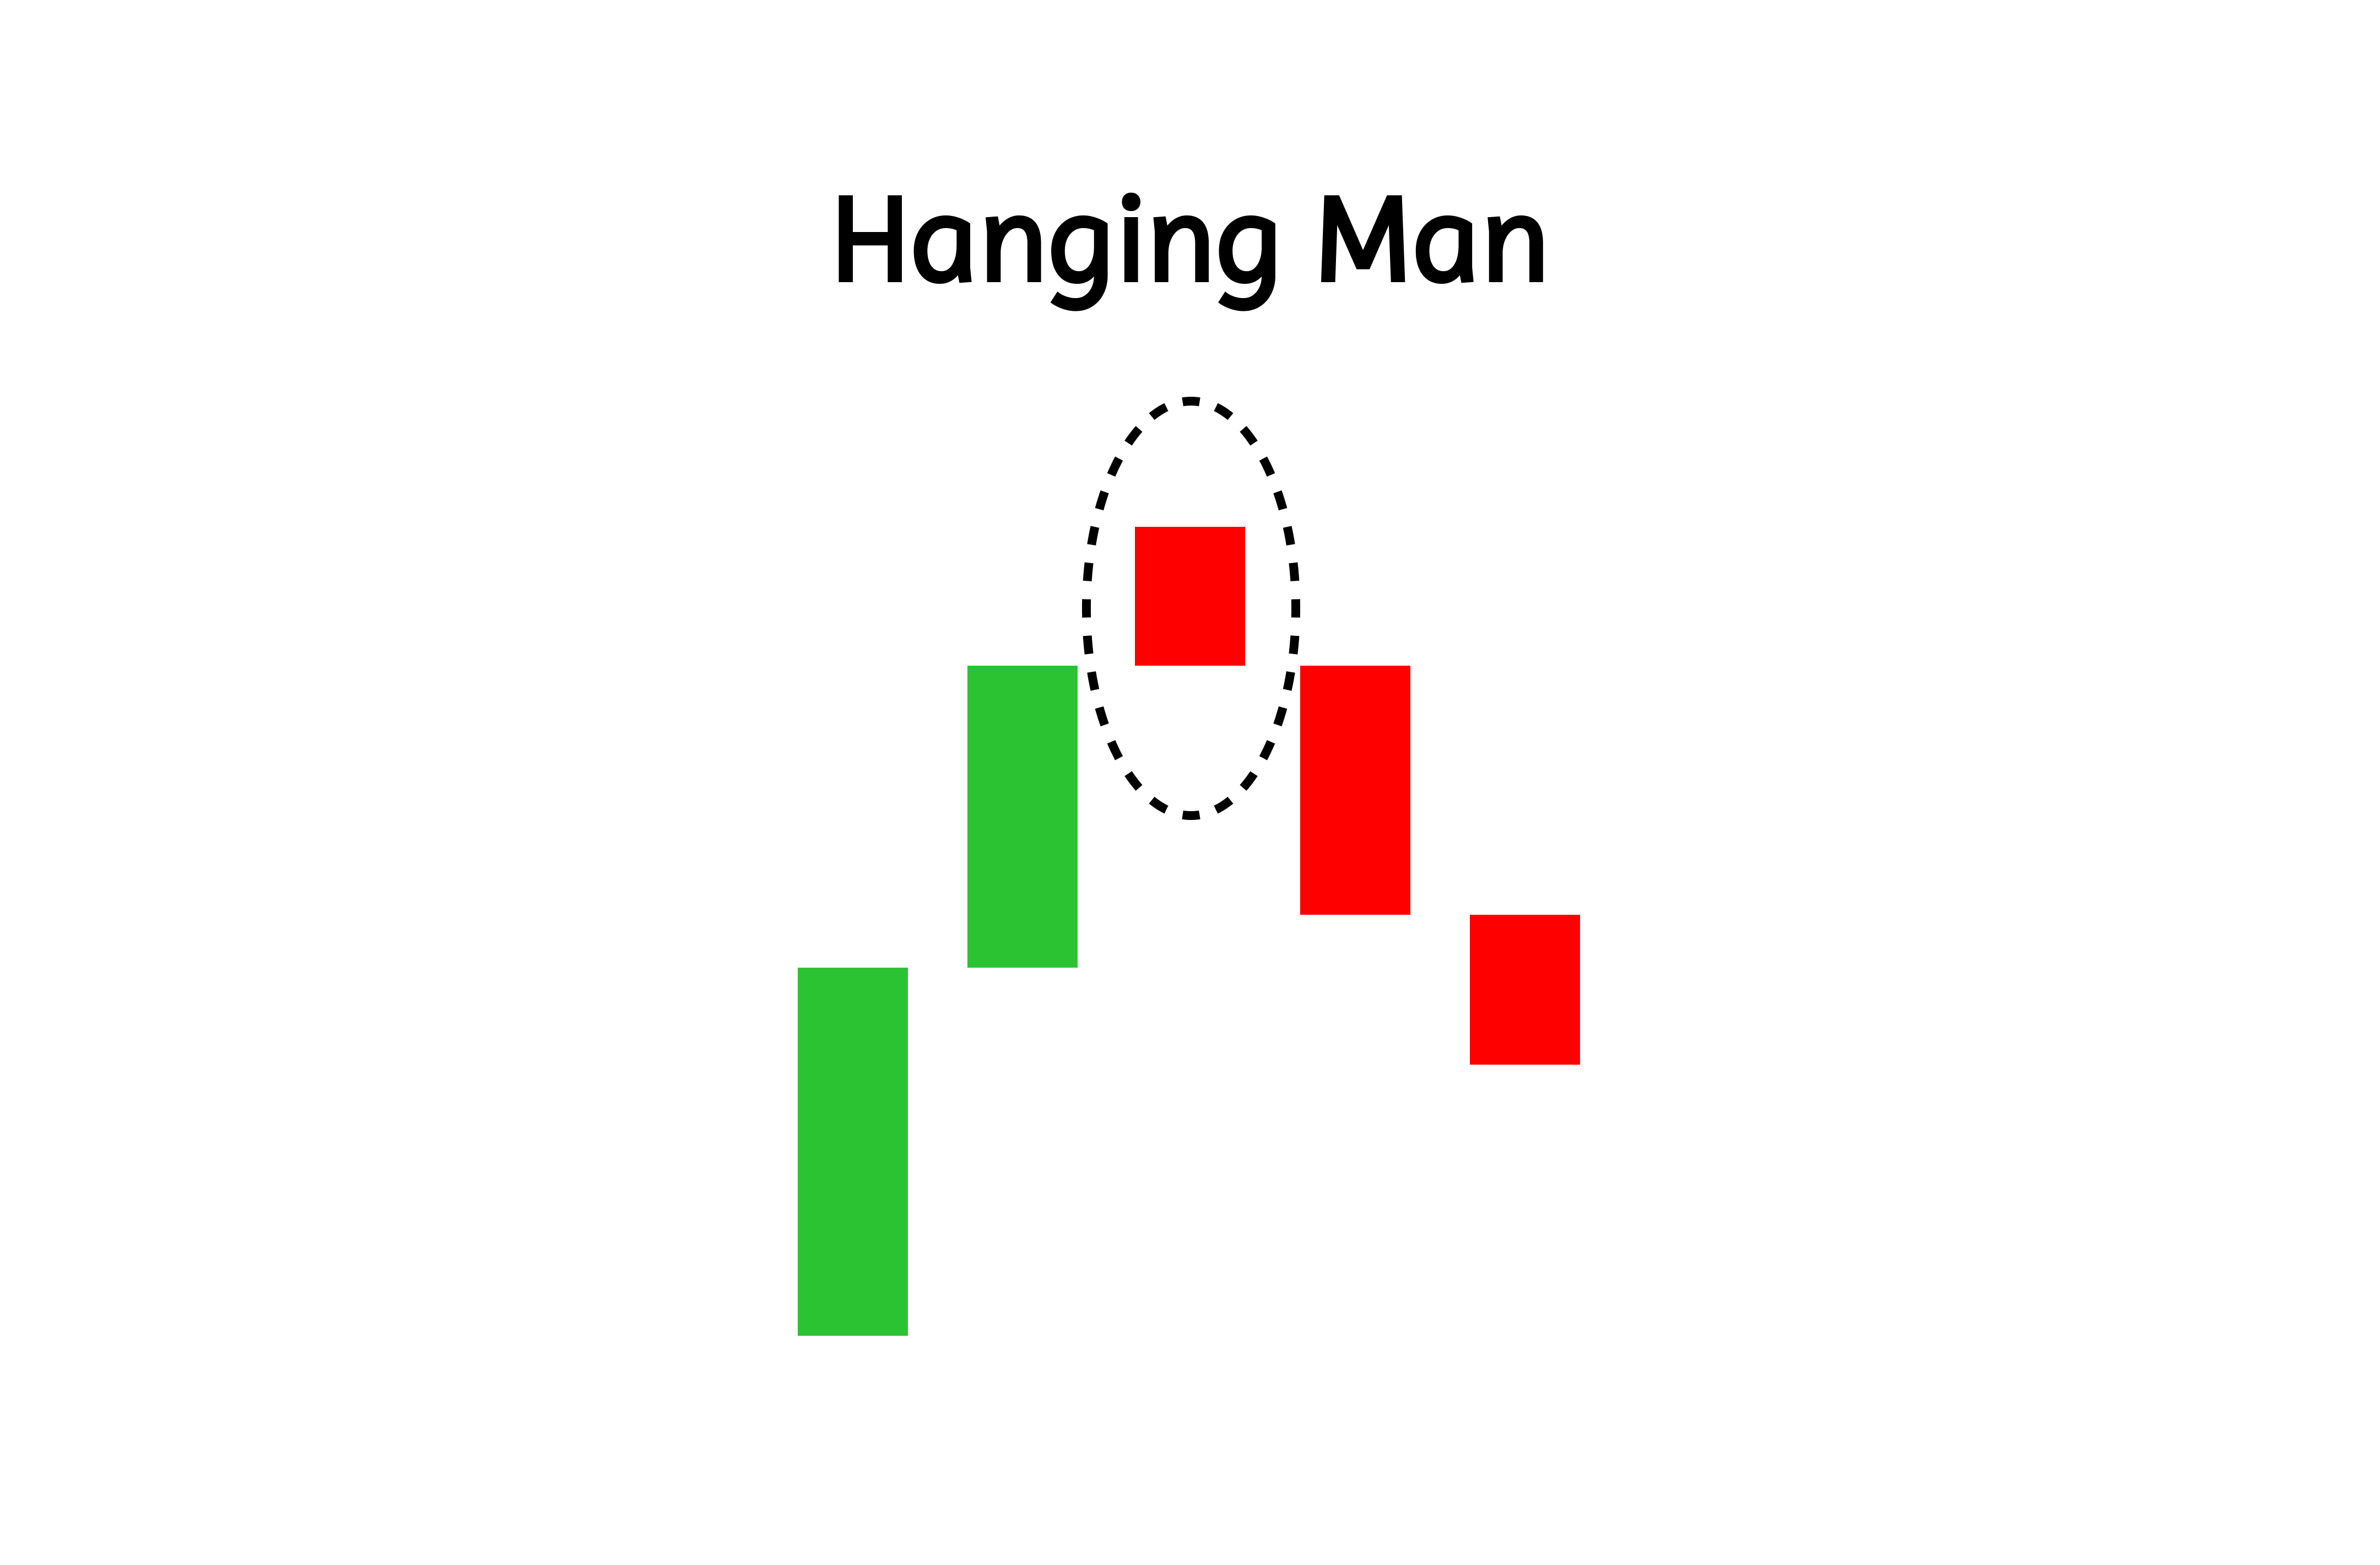
Hanging Man candlestick pattern appears after an uptrend and signals a potential reversal to the downside. It reflects that buyers initially pushed the prices high during the session but sellers gained control and drove the prices downward before the close. This suggests a potential bearish sentiment. It is a bearish reversal pattern warning traders to consider exiting long positions or prepare a downturn. It looks for downward price movement in the next session to confirm the bearish trend.
Similarities between Bullish Hammer candlestick pattern and Hanging Man pattern
Both patterns have small real bodies near the top and long lower shadows with little or to no upper shadow. Their visual structure is almost identical. Both require confirmation in subsequent sessions.
Key difference
Their location in the trend indicates its meaning
Hammer is bullish after a downtrend. Whereas hanging man is bearish after an uptrend.
Feature | Bullish Hammer | Hanging Man |
Trend Placement | Appears after a downtrend | Appears after an uptrend |
Market Sentiment | Signals a potential bullish reversal | Signals a potential bearish reversal |
Psychology | Buyers regain control after initial selling | Sellers regain control after initial buying |
Confirmation Needed | Requires a bullish confirmation (e.g., higher close in the next session) | Requires a bearish confirmation (e.g., lower close in the next session) |
Visual Appearance | Small real body near the top, long lower shadow, little/no upper shadow | Same visual appearance as the Bullish Hammer |
Real world example of Hammer candlestick pattern
The image is a stock chart for Infosys Ltd, displaying price movements and trading volume from January 6, 2025, to March 31, 2025. It includes candlestick patterns, which traders use to analyze market trends.
A hammer candlestick pattern forms when a candlestick has a small body near the top and a long lower shadow. This pattern typically appears after a downtrend and signals a potential reversal. The long lower shadow shows that sellers pushed the price down significantly, but buyers managed to push it back up near the opening price, indicating increasing buying pressure.
In the image, the candlestick for 3rd March, 2025, has the following details:
- Open: 1,695.00
- High: 1,699.00
- Low: 1,670.00
- Close: 1,688.30
- Volume: 6.8M
This candlestick has a small body and a long lower shadow, which is characteristic of a hammer pattern. The pattern suggests that the price may reverse and start increasing after the downtrend observed in the chart.
How to Trade Hammer Candlestick Pattern
1. Identify Hammer candlestick pattern
The hammer is a bullish reversal candlestick pattern that appears after a downtrend. It has a small body near the top of the candle ,a long lower shadow and little to no upper shadow. This signals that sellers pushed the price down, but buyers regained control before the candle closed.
2. Confirm the Pattern Before Trading
Before entering a trade, look for confirmation. This usually comes in the form of a bullish candle that closes above the high of the hammer. Increased trading volume on the confirmation candle strengthens the pattern’s reliability. Traders may also use indicators like the Relative Strength Index (RSI) to confirm buying momentum.
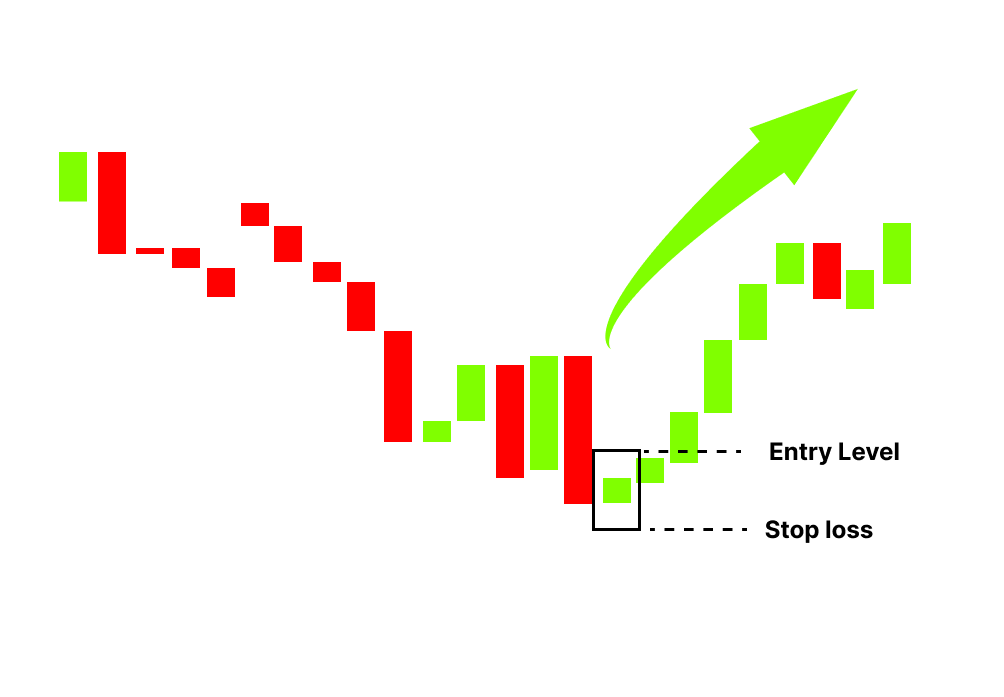
3. Enter the Trade
There are two common entry points:
- Aggressive traders:Enter at the close of the confirmation candle if it closes above the hammer’s high.
- Conservative traders:Wait until the market opens the next day to enter the trade.
4. Set a Stop-Loss
To manage risk, place a stop-loss just below the hammer’s low. If the price drops below this level, it means the pattern has failed, and it’s best to exit the trade quickly.
5. Determine Profit Targets
Traders use various strategies to set profit targets, including:
- Nearby resistance levels(where selling pressure may emerge)
- Moving averages(to assess trends)
- Fibonacci retracements(to measure potential price moves)
- Pivot points(common areas of price reversal)
Before placing a trade, ensure that the market has enough room for the price to rise, achieving a favorable risk-reward ratio.
Conclusion
The pattern suggests that although buyers ultimately regained control and drove the price back to its initial level, which symbolizes the bull gaining strength, sellers may have attempted to drive the price lower. The pattern points to a potential price reversal to the upside. The candlestick that follows the hammer indicator should confirm the upward price movement. The rising confirmation candle is usually bought by traders looking for a hammer signal. It can be beneficial to place our stop loss below the bottom of the hammer pattern because it will safeguard us in case the downward pressure reappears, and the upward advance traders were anticipating doesn’t take place.
Read More About Trading Using Technical Indicators


