The spinning top provides insightful data regarding the state of the market at the moment.
A candlestick pattern known as a spinning top features a short true body that is vertically positioned in the middle of extended upper and lower shadows. The candlestick pattern signifies uncertainty over the asset’s future course. In other words, neither buyers nor sellers could prevail.
Introduction:
When buyers and sellers push the price up and down, respectively, for a predetermined amount of time, but finally the closing price ends up being extremely near to the open, a candlestick pattern is formed. If the candle that follows confirms, spinning tops can indicate a potential price reversal after a significant price increase or decrease.
Confirmation makes the spinning top’s message more understandable. The following candle provides confirmation. The candle that follows a spinning top should show a decline in price if a trader thinks the spinning top following an upswing could lead to a reversal to the negative. If not, the reversal is not confirmed, and the trader must wait for a new signal to enter the market. If the spinning top appears within a range, it means there is still a lot of uncertainty, and the range is likely to last. If the subsequent candle confirms, it will remain in the established sideways channel.
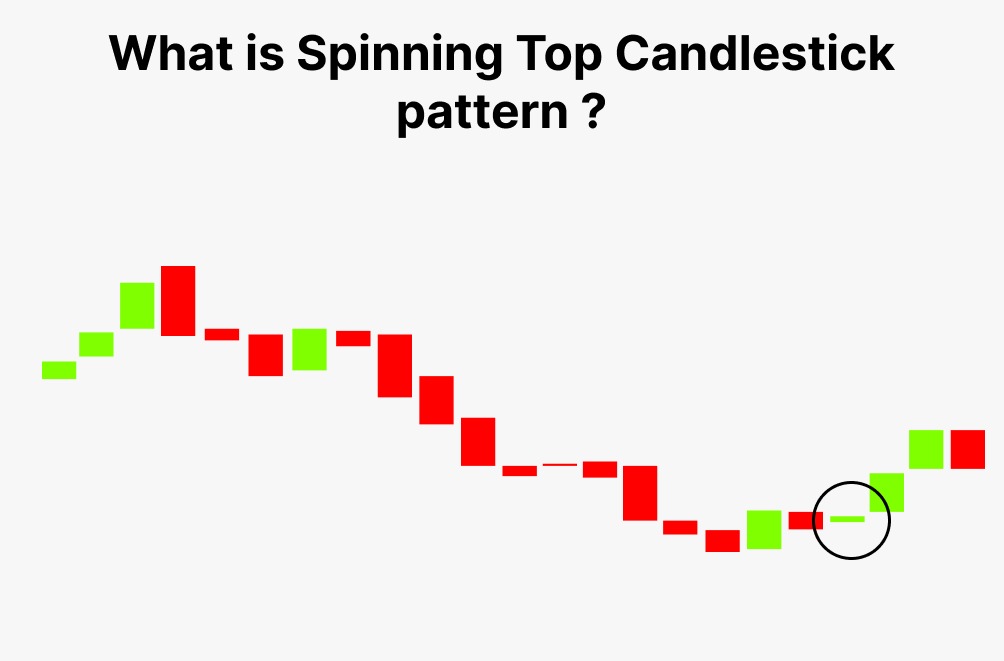
What is the Spinning top candlestick Pattern?
The close and open prices on a spinning top are never far apart, regardless of whether the close is above or below the open.
Spinning tops can occasionally indicate a substantial shift in the trend. At the peak of an uptrend, a spinning top may indicate that bulls are losing control and the trend may be about to change. The bodies of the candles are tiny.
Lower and upper shadows are nearly equal. The spinning top appears to be a candle with a small genuine body on the outside, but there were quite a few dramatic things that happened during the day.
Formation of Spinning top Candlestick Pattern
The open price and close price are relatively near, as indicated by the little real body.
The candle’s colour doesn’t really matter because the open and closing price points are close to one another. The fact that the open price and close price are close to one another is what matters most.
- Small real body
- The upper shadow
- The lower shadow
The fact that the upper shadow is present indicates that the bulls did try to push the market higher. They did not, however, actually succeed in their quest. The real body—rather than actually being a short candle—would have been a long blue candle if the bulls had been truly successful. Consequently, this might be viewed as a failed attempt by the bulls to push the markets higher.
Similar to what occurred with the bears. The fact that the lower shadow is present indicates that the bears did try to drive the market lower. They were unsuccessful, though. The real body would have been a long red candle as opposed to a small candle if the bears had been successful. Consequently, this might be viewed as a failed attempt by the bearish to drive the markets down.
How to Trade Spinning top Patterns with Examples?
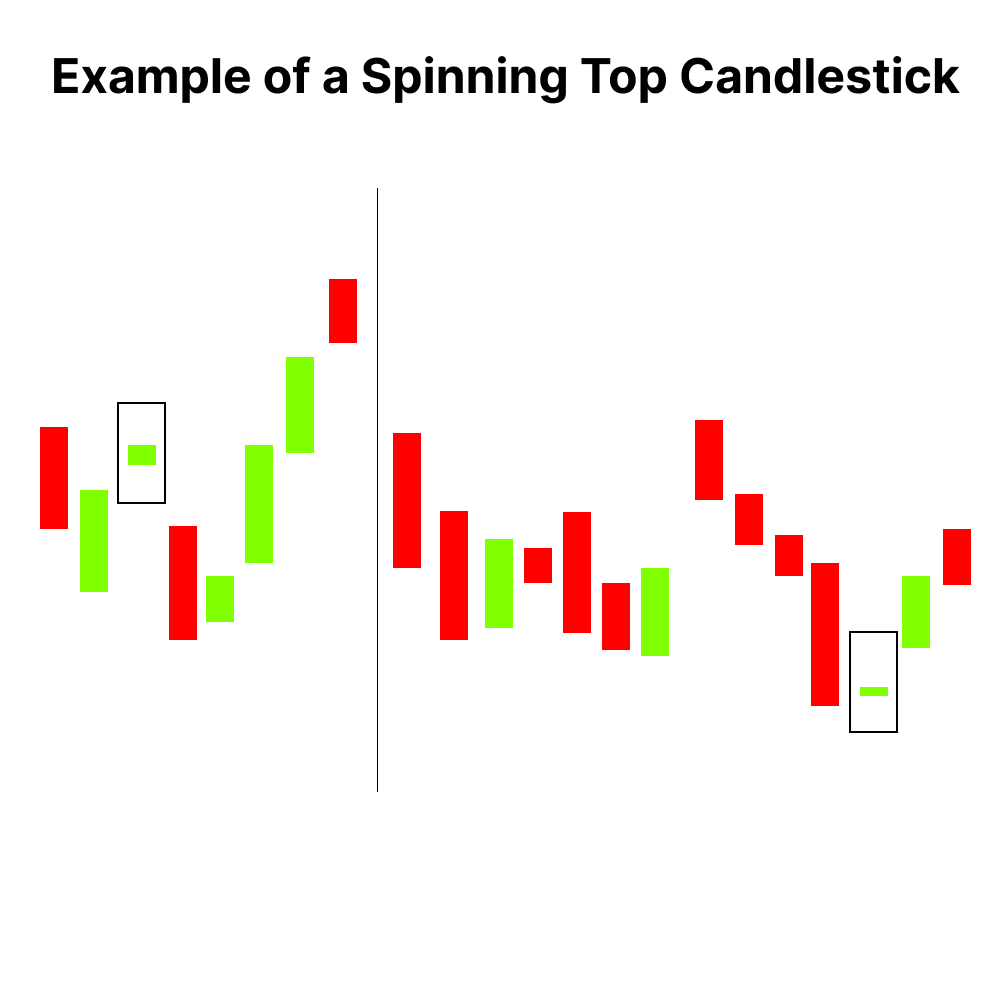
Interpretation: A spinning top tells traders that there is uncertainty in the market because there wasn’t much of a change between the opening and closing prices. This can either mean that more neutral movements are ahead, or a price reversal is about to occur. If the spinning top is seen at the bottom of a downtrend, it could mean that a bullish reversal might happen. Conversely, if it occurs at the top of an uptrend, it could signal a bearish reversal. At the 3320 INR price level, there is a spinning top and there is uncertainty in the sideways market.
Difference between a spinning top and Doji?
Dojis and spinning tops both stand for uncertainty. Dojis are smaller, with smaller upper and lower shadows as well as smaller true bodies. Long upper and lower shadows can be seen on the rotating top. Both patterns are common and can be used to signal a reversal following a significant price move. Candlesticks of both types rely significantly on confirmation. Instead of the spinning top or doji itself, a big move that occurs following it provides additional information about the next probable price direction.
Bullish Spinning Top Candlestick Pattern

The bullish spinning top candlestick pattern is a type of candlestick pattern commonly observed in technical analysis of financial markets. Here’s an explanation:
Appearance:A spinning top candlestick has a small real body (the difference between the opening and closing prices) and long upper and lower shadows (wicks), which indicate significant price movement in both directions during the trading session The color of the body can be either bullish (green or white, meaning the closing price is higher than the opening price) or bearish (red or black, meaning the closing price is lower than the opening price).
Interpretation:
When this pattern appears in a downtrend and the candlestick is bullish, it can signal a potential reversal to an uptrend.The small real body and long shadows suggest indecision among market participants—neither buyers nor sellers have full control. However, since the candle closes higher than it opens, there’s a slight bias towards bullish sentiment
Spinning Bottom candlestick pattern
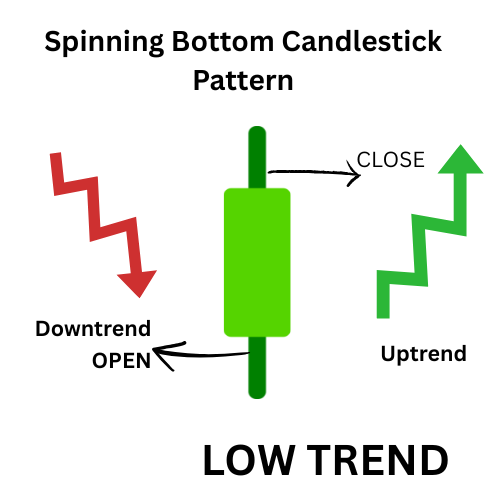
Spinning bottom candlestick pattern is a type of candlestick chart used in technical analysis, particularly in trading, to understand price action. It is similar to the spinning top candlestick but signifies indecision at the bottom of a trend, often a possible reversal or continuation signal.
Key features include:
- Small Body: Indicates minimal price movement between the opening and closing prices during that period.
- Long Shadows: Both upper and lower shadows are long, showing significant volatility as prices moved strongly in both directions but settled near the opening price.
- Context: When this pattern appears at the bottom of a downtrend, it might suggest that selling pressure is weakening, or that buyers and sellers are reaching equilibrium.
Conclusion
Imagining the spinning top in its entirety, including the true body, upper shadow, and bottom shadow. The bulls tried in vain to push the market higher. The bears’ attempts to drive the markets lower were unsuccessful. The little actual body is evidence that neither the bulls nor the bears were able to exert any influence on the market.
Spinning Tops are therefore a sign of a market with dominant ambiguity and indecision. A spinning top has little value if we see it alone. Because neither the bulls nor the bears were able to affect the markets, it simply indicates hesitation.
But when we look at the spinning top in relation to the trend in the chart, it sends out a really strong signal that we can use to decide how to position ourselves in the markets.