
8.1 What is Scalping?

Scalping is a short term trading strategy where traders aim to make quick, small profits from tiny price movements usually many times a day.
Features of Scalping Strategies
- In scalping strategies the time frame is ultra short (few seconds to few minutes)
- The target profit is very small in case of options strategies (e.g. 0.1% to 0.5% per trade)
- It is has huge risk if not controlled. Small mistakes add up fast in case of Scalping
- Many trades are carried out per day
|
Pros |
Cons |
|
Many trading opportunities |
Emotionally exhausting |
|
Works in any market condition |
Requires super-fast execution |
|
Small losses, if managed |
High transaction costs (brokerage, slippage) |
|
No overnight risk |
Demands focus and discipline |
Scalping Indicators
- Moving Averages
- Relative Strength Index
To access Scalping Strategies in FnO 360 Platform click on this link
8.2 Scalping Indicators
Scalping is a short-term trading strategy that aims to capture small profits from multiple trades throughout the day. Scalpers open and close trades quickly, often within minutes or even seconds, to take advantage of small price movements in the market
A. Moving Averages as an Indicator of Scalping
Using Moving Averages (MAs) in option scalping can help traders identify trends and potential entry and exit points for their trades. Here’s how you can incorporate MAs into your option scalping strategy:
Types of Moving Averages
- Simple Moving Average (SMA)
- Calculates the average of a selected range of prices, usually closing prices, by the number of periods in that range.
- Example: A 10-day SMA of closing prices.
- Exponential Moving Average (EMA)
- Gives more weight to recent prices, making it more responsive to new information.
- Example: A 7-day EMA for short-term scalping.
How to Use Moving Averages in Option Scalping
- Identify Trends: Use MAs to identify the direction of the trend. An uptrend is indicated when the price is above the MA, and a downtrend is indicated when the price is below the MA.
- Entry Signals: Look for crossover signals where a shorter-term MA crosses a longer-term MA. For example, a bullish signal occurs when the 7-day EMA crosses above the 14-day EMA.
- Exit Signals: Use MAs to determine potential exit points. For example, if the price crosses below the MA, it may be a signal to exit the trade.
- Support and Resistance: MAs can act as dynamic support and resistance levels. The price often bounces off these levels, providing opportunities for scalping.
Pros and Cons
Pros:
- Trend Identification: Helps identify the direction of the trend.
- Dynamic Support and Resistance: Provides dynamic levels for potential entry and exit points.
Cons:
- Lagging Indicator: Based on past prices, so it may lag behind current price movements.
- False Signals: Can generate false signals in choppy or sideways markets.
B. Relative Strength Index as an Indicator of Scalping
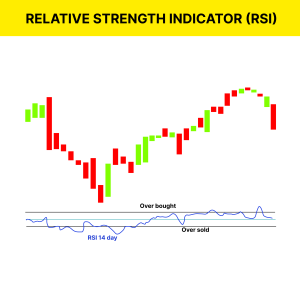
The Relative Strength Index (RSI) is a popular momentum oscillator used in technical analysis to measure the speed and change of price movements. When applied to scalping strategies, which involve making multiple small trades throughout the day to profit from minor price movements, RSI becomes a valuable tool for identifying short-term overbought or oversold conditions.
- When applied to scalping, traders often adjust the default RSI setting from a 14-period to a shorter period, such as 7 or 9, to increase its responsiveness.
- They also use RSI on lower time-frames like the 1-minute or 3-minute charts to capture more frequent signals. In practice, a scalper might look to enter a long position when the RSI crosses above 30, indicating a potential shift from an oversold condition to upward momentum.
- Conversely, a short position might be triggered when the RSI falls below 70, signaling a possible downward reversal from an overbought state. For more aggressive entries, some traders prefer using tighter bands like 20 and 80.
- To enhance accuracy and avoid false signals, RSI is best used in conjunction with other technical tools such as candlestick patterns, support and resistance levels, or moving averages. Scalpers also watch for RSI divergence, where the price makes a new high or low, but the RSI does not confirm it—this often indicates a potential reversal, offering a prime opportunity for a quick scalp trade.
- However, it’s important to note that RSI performs better in ranging markets, as it may give misleading signals in strong trending environments.
- Ultimately, consistent success in RSI-based scalping requires proper risk management, real-time focus, and thorough back-testing of the chosen settings and strategy.
How to Use RSI in Options Scalping:
When scalping options, the goal is to catch small but quick moves in option premiums. RSI can signal when the underlying asset is either overbought or oversold, hinting at a possible reversal or a bounce, which can translate into rapid premium changes in options.
Instead of applying RSI directly to the option itself, traders generally apply RSI to the underlying stock or index, since options prices are derived from it. For instance, if the underlying (say, Nifty) shows RSI dropping below 30 and then crossing back above, it may suggest an upcoming bounce — this could be a trigger to scalp Call options. On the flip side, if RSI crosses below 70 after being overbought, it may hint at weakness, and scalpers might look to enter Put options.
In highly volatile markets, traders might use shorter RSI settings (like 7 or 9-period) on 1-minute or 3-minute charts for quicker signals. Some also combine RSI with VWAP, price action levels, or volume spikes to increase the probability of a successful scalp. The key is to aim for quick profits — often in seconds or a few minutes — before time decay eats into option premiums.
Pros of RSI in Options Scalping
- Quick Signal Generation: RSI on low timeframe gives fast overbought/oversold signals, ideal for short-term trades.
- Momentum Insight: It helps identify when momentum is about to shift, which is crucial for entering at the right moment in options.
- Simple and Visual: RSI is easy to read and doesn’t require complex interpretation.
- Effective in Sideways Markets: Options often lose value during consolidation, and RSI helps pick small up/down bounces to capitalize on.
Cons of Using RSI in Options Scalping:
- Lag in Strong Trends: RSI can give early reversal signals that don’t play out, especially in trending markets — leading to losing scalps.
- Doesn’t Reflect Option Greeks: RSI doesn’t account for time decay (theta), implied volatility (vega), or delta, which are critical in options pricing.
- False Signals: In high volatility environments, RSI can jump around and give choppy signals, leading to whipsaws.
- Low Premium Movement: Sometimes, even if RSI gives a perfect signal on the underlying, the option premium may not move enough due to low delta or high theta.
8.1 What is Scalping?
Scalping is a short term trading strategy where traders aim to make quick, small profits from tiny price movements usually many times a day.
Features of Scalping Strategies
- In scalping strategies the time frame is ultra short (few seconds to few minutes)
- The target profit is very small in case of options strategies (e.g. 0.1% to 0.5% per trade)
- It is has huge risk if not controlled. Small mistakes add up fast in case of Scalping
- Many trades are carried out per day
|
Pros |
Cons |
|
Many trading opportunities |
Emotionally exhausting |
|
Works in any market condition |
Requires super-fast execution |
|
Small losses, if managed |
High transaction costs (brokerage, slippage) |
|
No overnight risk |
Demands focus and discipline |
Scalping Indicators
- Moving Averages
- Relative Strength Index
To access Scalping Strategies in FnO 360 Platform click on this link
8.2 Scalping Indicators
Scalping is a short-term trading strategy that aims to capture small profits from multiple trades throughout the day. Scalpers open and close trades quickly, often within minutes or even seconds, to take advantage of small price movements in the market
A. Moving Averages as an Indicator of Scalping
Using Moving Averages (MAs) in option scalping can help traders identify trends and potential entry and exit points for their trades. Here’s how you can incorporate MAs into your option scalping strategy:
Types of Moving Averages
- Simple Moving Average (SMA)
- Calculates the average of a selected range of prices, usually closing prices, by the number of periods in that range.
- Example: A 10-day SMA of closing prices.
- Exponential Moving Average (EMA)
- Gives more weight to recent prices, making it more responsive to new information.
- Example: A 7-day EMA for short-term scalping.
How to Use Moving Averages in Option Scalping
- Identify Trends: Use MAs to identify the direction of the trend. An uptrend is indicated when the price is above the MA, and a downtrend is indicated when the price is below the MA.
- Entry Signals: Look for crossover signals where a shorter-term MA crosses a longer-term MA. For example, a bullish signal occurs when the 7-day EMA crosses above the 14-day EMA.
- Exit Signals: Use MAs to determine potential exit points. For example, if the price crosses below the MA, it may be a signal to exit the trade.
- Support and Resistance: MAs can act as dynamic support and resistance levels. The price often bounces off these levels, providing opportunities for scalping.
Pros and Cons
Pros:
- Trend Identification: Helps identify the direction of the trend.
- Dynamic Support and Resistance: Provides dynamic levels for potential entry and exit points.
Cons:
- Lagging Indicator: Based on past prices, so it may lag behind current price movements.
- False Signals: Can generate false signals in choppy or sideways markets.
B. Relative Strength Index as an Indicator of Scalping
The Relative Strength Index (RSI) is a popular momentum oscillator used in technical analysis to measure the speed and change of price movements. When applied to scalping strategies, which involve making multiple small trades throughout the day to profit from minor price movements, RSI becomes a valuable tool for identifying short-term overbought or oversold conditions.
- When applied to scalping, traders often adjust the default RSI setting from a 14-period to a shorter period, such as 7 or 9, to increase its responsiveness.
- They also use RSI on lower time-frames like the 1-minute or 3-minute charts to capture more frequent signals. In practice, a scalper might look to enter a long position when the RSI crosses above 30, indicating a potential shift from an oversold condition to upward momentum.
- Conversely, a short position might be triggered when the RSI falls below 70, signaling a possible downward reversal from an overbought state. For more aggressive entries, some traders prefer using tighter bands like 20 and 80.
- To enhance accuracy and avoid false signals, RSI is best used in conjunction with other technical tools such as candlestick patterns, support and resistance levels, or moving averages. Scalpers also watch for RSI divergence, where the price makes a new high or low, but the RSI does not confirm it—this often indicates a potential reversal, offering a prime opportunity for a quick scalp trade.
- However, it’s important to note that RSI performs better in ranging markets, as it may give misleading signals in strong trending environments.
- Ultimately, consistent success in RSI-based scalping requires proper risk management, real-time focus, and thorough back-testing of the chosen settings and strategy.
How to Use RSI in Options Scalping:
When scalping options, the goal is to catch small but quick moves in option premiums. RSI can signal when the underlying asset is either overbought or oversold, hinting at a possible reversal or a bounce, which can translate into rapid premium changes in options.
Instead of applying RSI directly to the option itself, traders generally apply RSI to the underlying stock or index, since options prices are derived from it. For instance, if the underlying (say, Nifty) shows RSI dropping below 30 and then crossing back above, it may suggest an upcoming bounce — this could be a trigger to scalp Call options. On the flip side, if RSI crosses below 70 after being overbought, it may hint at weakness, and scalpers might look to enter Put options.
In highly volatile markets, traders might use shorter RSI settings (like 7 or 9-period) on 1-minute or 3-minute charts for quicker signals. Some also combine RSI with VWAP, price action levels, or volume spikes to increase the probability of a successful scalp. The key is to aim for quick profits — often in seconds or a few minutes — before time decay eats into option premiums.
Pros of RSI in Options Scalping
- Quick Signal Generation: RSI on low timeframe gives fast overbought/oversold signals, ideal for short-term trades.
- Momentum Insight: It helps identify when momentum is about to shift, which is crucial for entering at the right moment in options.
- Simple and Visual: RSI is easy to read and doesn’t require complex interpretation.
- Effective in Sideways Markets: Options often lose value during consolidation, and RSI helps pick small up/down bounces to capitalize on.
Cons of Using RSI in Options Scalping:
- Lag in Strong Trends: RSI can give early reversal signals that don’t play out, especially in trending markets — leading to losing scalps.
- Doesn’t Reflect Option Greeks: RSI doesn’t account for time decay (theta), implied volatility (vega), or delta, which are critical in options pricing.
- False Signals: In high volatility environments, RSI can jump around and give choppy signals, leading to whipsaws.
- Low Premium Movement: Sometimes, even if RSI gives a perfect signal on the underlying, the option premium may not move enough due to low delta or high theta.


