
4.1 Concept of Risk

Risk and Expected Return in Investment Decisions
When investors evaluate opportunities, two central factors dominate the decision-making process: risk and expected return. Risk refers to the uncertainty or variability in returns, while expected return represents the reward anticipated from the investment. Balancing these two is the essence of portfolio management.
Understanding Risk
Risk can be described as the degree to which actual returns deviate from expected returns. Statistically, this variability is measured using tools such as variance, standard deviation, or the coefficient of range. The higher the dispersion, the greater the risk.
Several factors influence the level of risk in an investment:
- Maturity Period
- Longer maturity instruments (like 20-year corporate bonds) carry higher risk because of exposure to interest rate changes and inflation.
- Short-term deposits (like 1-year fixed deposits) are relatively safer.
- Creditworthiness of Issuer
- Government bonds issued by the Reserve Bank of India are considered safe due to sovereign backing.
- Corporate bonds from companies with lower credit ratings (e.g., BB or below) carry higher default risk.
- Nature of Instrument
- Government securities and bank fixed deposits are low-risk.
- Corporate debentures are moderately risky.
- Equity shares are the riskiest, as shareholders bear residual risk in case of bankruptcy.
- Liquidity
- Investments that can be quickly sold without significant loss (like blue-chip stocks listed on NSE) are less risky.
- Real estate, though potentially rewarding, is less liquid and therefore riskier.
- Economic and Industry Factors
- A slowdown in the IT sector impacts companies like Infosys or TCS more than utilities like NTPC.
- Inflation, interest rate changes, and global events (oil price shocks, geopolitical tensions) also add layers of risk.
Expected Return
Expected return is the compensation investors seek for bearing risk. It has two components:
- Yield→ Regular income such as dividends or interest.
- Capital Appreciation→ Increase in the value of the asset over time.
For example:
- A government bond may offer a fixed yield of 6% with minimal capital appreciation.
- A stock like Reliance Industries may provide dividends plus potential price appreciation, leading to higher expected returns but with greater volatility.
Comparative Risk Levels of Instruments
|
Instrument |
Risk Level |
Return Potential |
Example |
|
Government Bonds |
Very Low |
5–6% |
RBI Sovereign Bonds |
|
Bank Fixed Deposits |
Low |
6–7% |
SBI Fixed Deposit |
|
Corporate Debentures |
Medium |
8–10% |
Tata Motors Debenture |
|
Equity Shares |
High |
12–20% |
Infosys, Reliance |
|
Real Estate |
High |
Variable |
Residential Property in Mumbai |
4.2 Concept of Return
Investment can be thought of as delayed consumption. Instead of spending money today, investors set it aside with the expectation of receiving more in the future. This idea is linked to the time preference for money — people generally prefer to consume now rather than later. To persuade them to postpone consumption, they must be compensated with a return.
Real vs Nominal Return
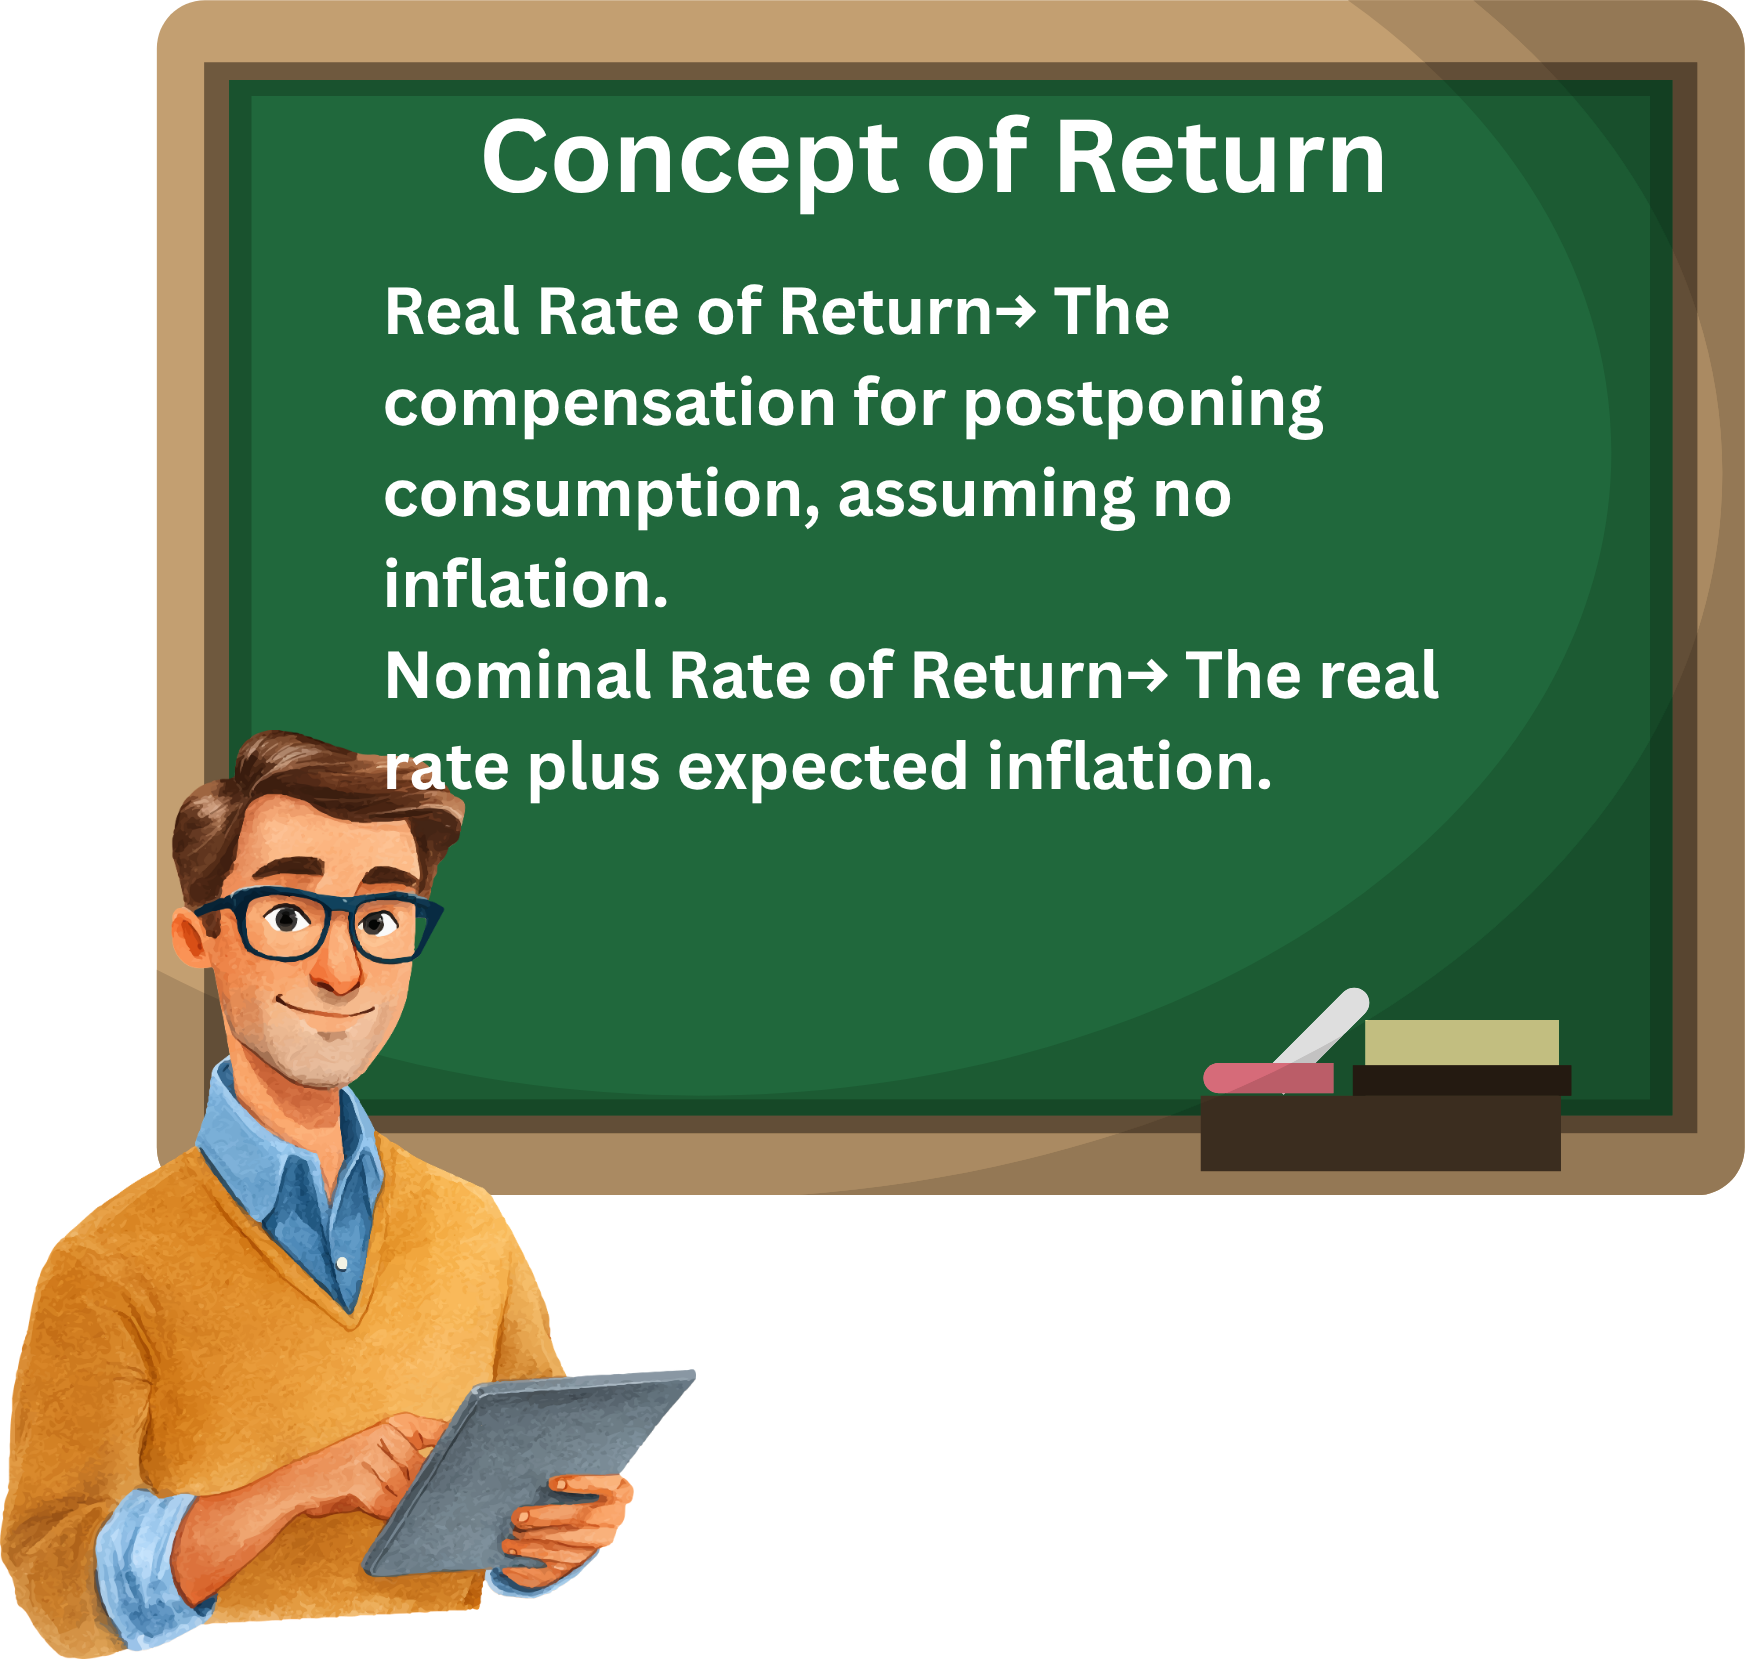
- Real Rate of Return→ The compensation for postponing consumption, assuming no inflation.
- Nominal Rate of Return→ The real rate plus expected inflation.
- If inflation is not accounted for, the real return may become zero or even negative.
Example 1: Government Bond
Suppose an investor buys a government bond worth ₹1,000.
- Real return expected = 4%
- Inflation expected = 5%
If only the real return is paid, the investor receives ₹1,040 after one year. But with inflation at 5%, the purchasing power is eroded, leaving the investor with no real gain. Therefore, the nominal return must be at least 9% (4% real + 5% inflation) to ensure positive returns.
Example 2: Corporate Equity
Now consider equity shares of a company:
- Real return expected = 6%
- Inflation = 4%
- Risk premium (for equity volatility) = 5%
Nominal return = 6% + 4% + 5% = 15%
Here, the investor demands a higher return because equities carry additional risk compared to government bonds.
Factors Influencing Return
- Time Preference
- Longer waiting periods require higher compensation.
- Example: A 10-year bond must offer more than a 1-year deposit.
- Inflation
- Higher inflation expectations push up nominal returns.
- Example: In India, if inflation is projected at 6%, investors demand higher yields on bonds.
- Risk Premium
- Riskier assets must offer extra compensation.
- Example: Start-up equity shares may need to promise 18–20% returns compared to 6–7% on government securities.
Comparative Illustration
|
Asset Type |
Real Return |
Inflation |
Risk Premium |
Nominal Return |
|
Government Bond |
3% |
5% |
0% |
8% |
|
Bank FD |
4% |
5% |
1% |
10% |
|
Corporate Bond |
5% |
5% |
3% |
13% |
|
Equity Shares |
6% |
5% |
6% |
17% |
4.3 Determinants of Rate of Return
When investors commit money to an asset, they expect a certain rate of return. This return is shaped by three fundamental components:
- Risk-free real rate– The basic compensation for postponing consumption in a world without inflation.
- Inflation premium– Adjustment for the erosion of purchasing power due to rising prices.
- Risk premium– Extra reward for bearing uncertainty unique to the investment.
Thus, the required return can be expressed as:
Required Return=Risk-Free Real Rate+Inflation Premium+Risk Premium
4.4 Calculation of Return
The return from an investment is not just one figure; it is made up of two parts:
- Yield→ Regular income such as interest or dividends.
- Capital Appreciation→ Increase in the asset’s price compared to its purchase price.
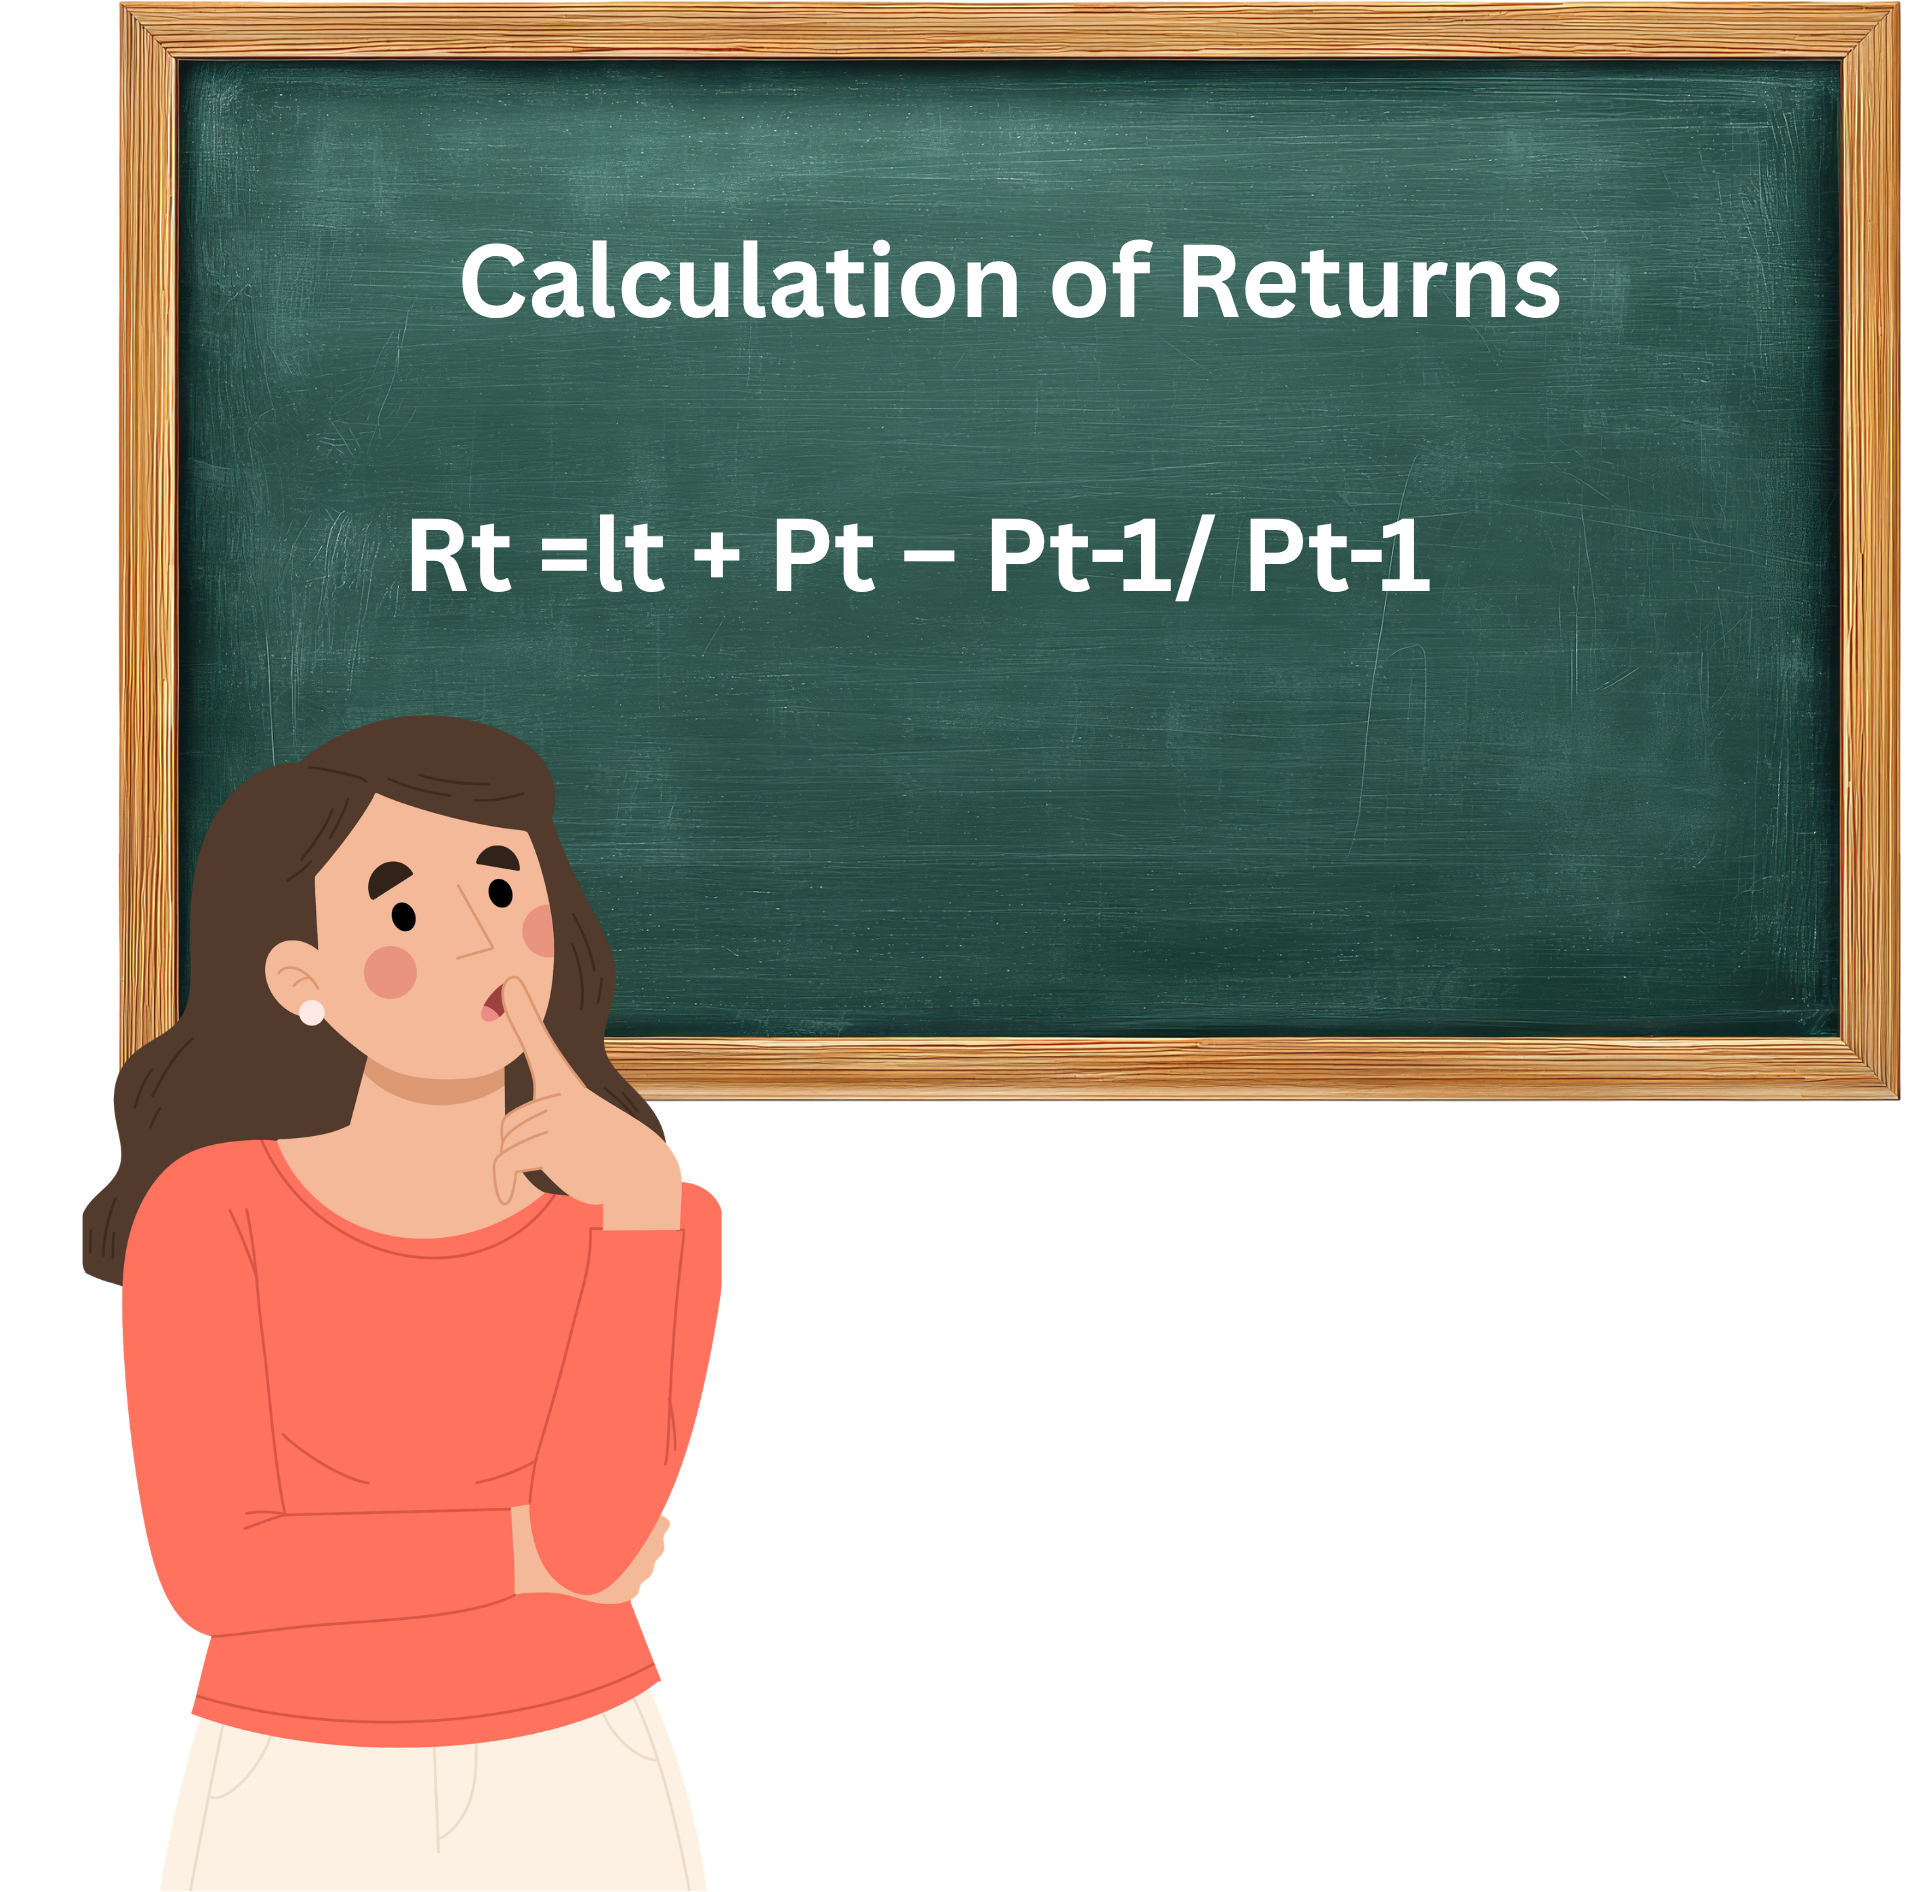
Mathematically:
Rt =lt + Pt – Pt-1/ Pt-1
Where:
- Rt= Rate of return in time period
- lt= Income received during
- Pt = Price at the end of
- Pt-1= Price at the beginning of
This can be split into:
Rt =It/Pt-1 + Pt -Pt-1 /Pt-1
- It/Pt-1→ Current Yield
- Pt -Pt-1 /Pt-1 → Capital Gain Yield
Or simply:
Rate of Return =Current Yield +Capital Gain Yield
Example 1: Equity Share
- Purchase price (Pt-1) = ₹200
- Dividend received (It) = ₹10
- Price after one year (Pt) = ₹240
Rt =10/200 +240-200/200
Rt =0.05 +0.20 =0.25 OR 25%
Here, the investor earns 5% yield and 20% capital appreciation, totaling 25% return.
Example 2: Mutual Fund
- Purchase price = ₹1,000
- Dividend payout = ₹40
- NAV after one year = ₹1,080
Rt = 400/1000 + 1080-1000/1000
Rt = 0.04 + 0.08 =0.12 or 12%
The mutual fund provides 4% yield and 8% capital gain, totaling 12% return.
Example 3: Real Estate
- Purchase price = ₹50,00,000
- Rental income = ₹3,00,000 per year
- Sale price after one year = ₹55,00,000
Rt =3,00,000/50,00,000 + 55,00,000-50,00,000/50,00,000
Rt =0.06+0.10 =0.16 or 16%
The property generates 6% yield and 10% capital appreciation, totaling 16% return.
Comparative Illustration
|
Asset Type |
Current Yield |
Capital Gain Yield |
Total Return |
|
Equity Share |
5% |
20% |
25% |
|
Mutual Fund |
4% |
8% |
12% |
|
Real Estate |
6% |
10% |
16% |
|
Government Bond |
7% |
0% |
7% |