
9.1 Introduction

Capital Asset Pricing Model (CAPM)
The Capital Asset Pricing Model (CAPM), developed by William Sharpe and John Lintner, builds on Harry Markowitz’s portfolio theory. It provides a framework for understanding how risk and return are linked in financial markets.
The model distinguishes between two types of risk:
- Systematic risk– market wide risk that cannot be eliminated through diversification (e.g., inflation, interest rate changes, recessions).
- Unsystematic risk– company specific risk that can be reduced by holding a diversified portfolio.
Together, these risks form the total variance of returns, but CAPM emphasizes that only systematic risk matters for pricing securities.
Core Idea of CAPM
CAPM states that the expected return of a security is directly proportional to its systematic risk, measured by the beta coefficient (β).
The formula is:
E(Ri) =Rf + β (E(Rm)-Rf)
Where:
- E(Ri)= Expected return of the asset
- Rf = Risk free rate (e.g., yield on 10 year Indian government bonds)
- β= Sensitivity of the asset to market movements
- (E(Rm)= Market risk premium (excess return of the market over the risk free rate)
Practical Examples
- High Beta Stock (β > 1)
- Example: Tesla or Adani Enterprises often have betas above 1.5.
- Their prices move more than the overall market — rising faster in bull markets but falling harder in downturns.
- CAPM implies investors demand higher expected returns to compensate for this extra volatility.
Low Beta Stock (β < 1)
- Example: Hindustan Unilever or Johnson & Johnson usually have betas below 0.8.
- These stocks are less sensitive to market swings, making them attractive to risk averse investors.
- CAPM suggests they will have lower expected returns compared to high beta stocks.
Risk Free Asset (β = 0)
- Example: Indian government bonds or S. Treasury bills.
- Their returns are unaffected by market movements, so CAPM assigns them the risk free rate as expected return.
Valuation Implications
- If the market price of a stock is higher than the value implied by CAPM, the stock is overvalued.
- If the market price is lower, the stock is undervalued.
- Example: In 2023, analysts argued that NVIDIA was trading above its CAPM implied valuation due to AI hype, while Tata Steel was undervalued relative to its risk profile.
Key Insight
CAPM provides investors with a way to:
- Estimate the required returnfor any asset given its risk.
- Compare intrinsic value with market price to identify overvalued or undervalued securities.
- Understand how adding a security affects the overall risk/return profileof a portfolio.
In essence, CAPM links risk (beta) and return (expected excess return), helping investors make rational decisions in markets where both systematic risk and investor expectations drive asset pricing.
9.2.Assumptions of CAPM

Because the Capital Asset Pricing Model (CAPM) is a theoretical construct, it rests on a set of simplifying assumptions that describe an “idealized” financial world. These assumptions make the model mathematically elegant, but they are not always realistic in practice.
Key Assumptions
Universal Market Access
- All assets — whether stocks, bonds, commodities, or even intangible assets like patents — are assumed to be tradable.
- Example: In reality, human capital (skills, knowledge) cannot be bought or sold, but CAPM assumes it could be treated like any other asset.
Infinite Divisibility
- Assets can be divided into fractional units and traded in any amount.
- Example: While you can buy fractional shares of Apple or Tesla today through modern brokerage platforms, CAPM assumes this divisibility applies to all assets without restriction.
Complete Market Participation
- All investors collectively hold all assets in the economy.
- Example: CAPM assumes a “market portfolio” that includes everything from Microsoft shares to farmland in India even though in practice investors hold only subsets.
Perfect Borrowing and Lending
- Every borrower has a lender, and all investors can borrow or lend unlimited amounts at the risk free rate.
- Example: CAPM assumes you could borrow at the yield of a 10year U.S. Treasury bond or Indian government security, which is unrealistic since borrowing costs vary by creditworthiness.
Existence of a Risk Free Asset
- There is a perfectly safe investment available to all investors.
- Example: Government bonds are often treated as proxies, but in reality even sovereign debt carries inflation and currency risks.
Homogeneous Expectations
- All investors agree on expected returns, risks, and correlations.
- Example: CAPM assumes everyone values Infosys or Reliance Industries using the same inputs, though in practice analysts differ widely in forecasts.
Simple Investor Preferences
- Investor utility functions are assumed to be simple and based only on mean and variance of returns.
- Example: CAPM ignores behavioral biases like loss aversion or preference for dividends.
Normal Distribution of Returns
- Security returns are assumed to follow a normal distribution, fully described by mean and variance.
- Example: In reality, markets often exhibit “fat tails” — extreme events such as the 2008 financial crisis or the 2020 pandemic crash.
Two Period Framework
- The model assumes only two time periods: today and the future.
- Example: CAPM simplifies investment horizons, whereas real investors plan across multiple periods (monthly, yearly, decades).
Key Insight
Together, these assumptions describe a frictionless capitalist world:
- Perfect liquidity, no transaction costs, no taxes.
- Equal access to information, no investor has an advantage.
- Risk can be cleanly separated into systematic (market wide) and unsystematic (firm specific).
While unrealistic, these assumptions allow CAPM to provide a clear formula linking risk and return. In practice, analysts adjust for deviations — such as transaction costs, heterogeneous expectations, and behavioral biases — but CAPM remains a foundational tool in finance.
9.3.Analysis of CAPM

To understand the Capital Asset Pricing Model (CAPM), it is essential to revisit the concepts of systematic risk and unsystematic risk.
Systematic Risk
- This is the portion of total risk that arises from market wide factorssuch as inflation, interest rate changes, recessions, or government policy shifts.
- It cannot be eliminated through diversification.
- CAPM measures systematic risk using the beta coefficient (β), which captures how sensitive a security’s returns are to movements in the overall market.
- Example: If Infosys has a beta of 1.2, its returns are expected to move 20% more than the NIFTY index. A rise in the market by 10% would imply Infosys could rise by ~12%, but a fall of 10% could mean a ~12% decline.
Mathematically:
β = Cov(Rs , Rm)/Var(Rm)
Where covariance measures how the stock moves with the market, and variance represents market volatility.
Unsystematic Risk
- This is company specific risk, such as labor strikes, management changes, or shifts in consumer preferences.
- Example: A sudden ban on a pharmaceutical product affects Sun Pharma specifically, not the entire market.
- Unlike systematic risk, unsystematic risk can be eliminated through diversification— holding a portfolio of multiple stocks across industries.
CAPM and Risk
- An efficient portfolio is one where unsystematic risk has been diversified away, leaving only systematic risk.
- CAPM assumes that investors are compensated only for systematic risk, since unsystematic risk can be avoided.
- Total risk is measured by standard deviation, but CAPM focuses on beta as the relevant measure for pricing securities.
Market Portfolio
- The market portfolio represents all investable assets in the economy.
- Its expected return is the market premium (market return minus risk free rate), scaled by beta.
- Example: If the NIFTY delivers 12% and the risk free rate is 6%, the market premium is 6%. A stock with β = 1.5 would have an expected return of: E(Ri) =6% + 1.5 * (12%-6%) =15%
9.4. Security Market Line

The Security Market Line is the graphical representation of CAPM. It shows the relationship between a security’s expected return and its beta.
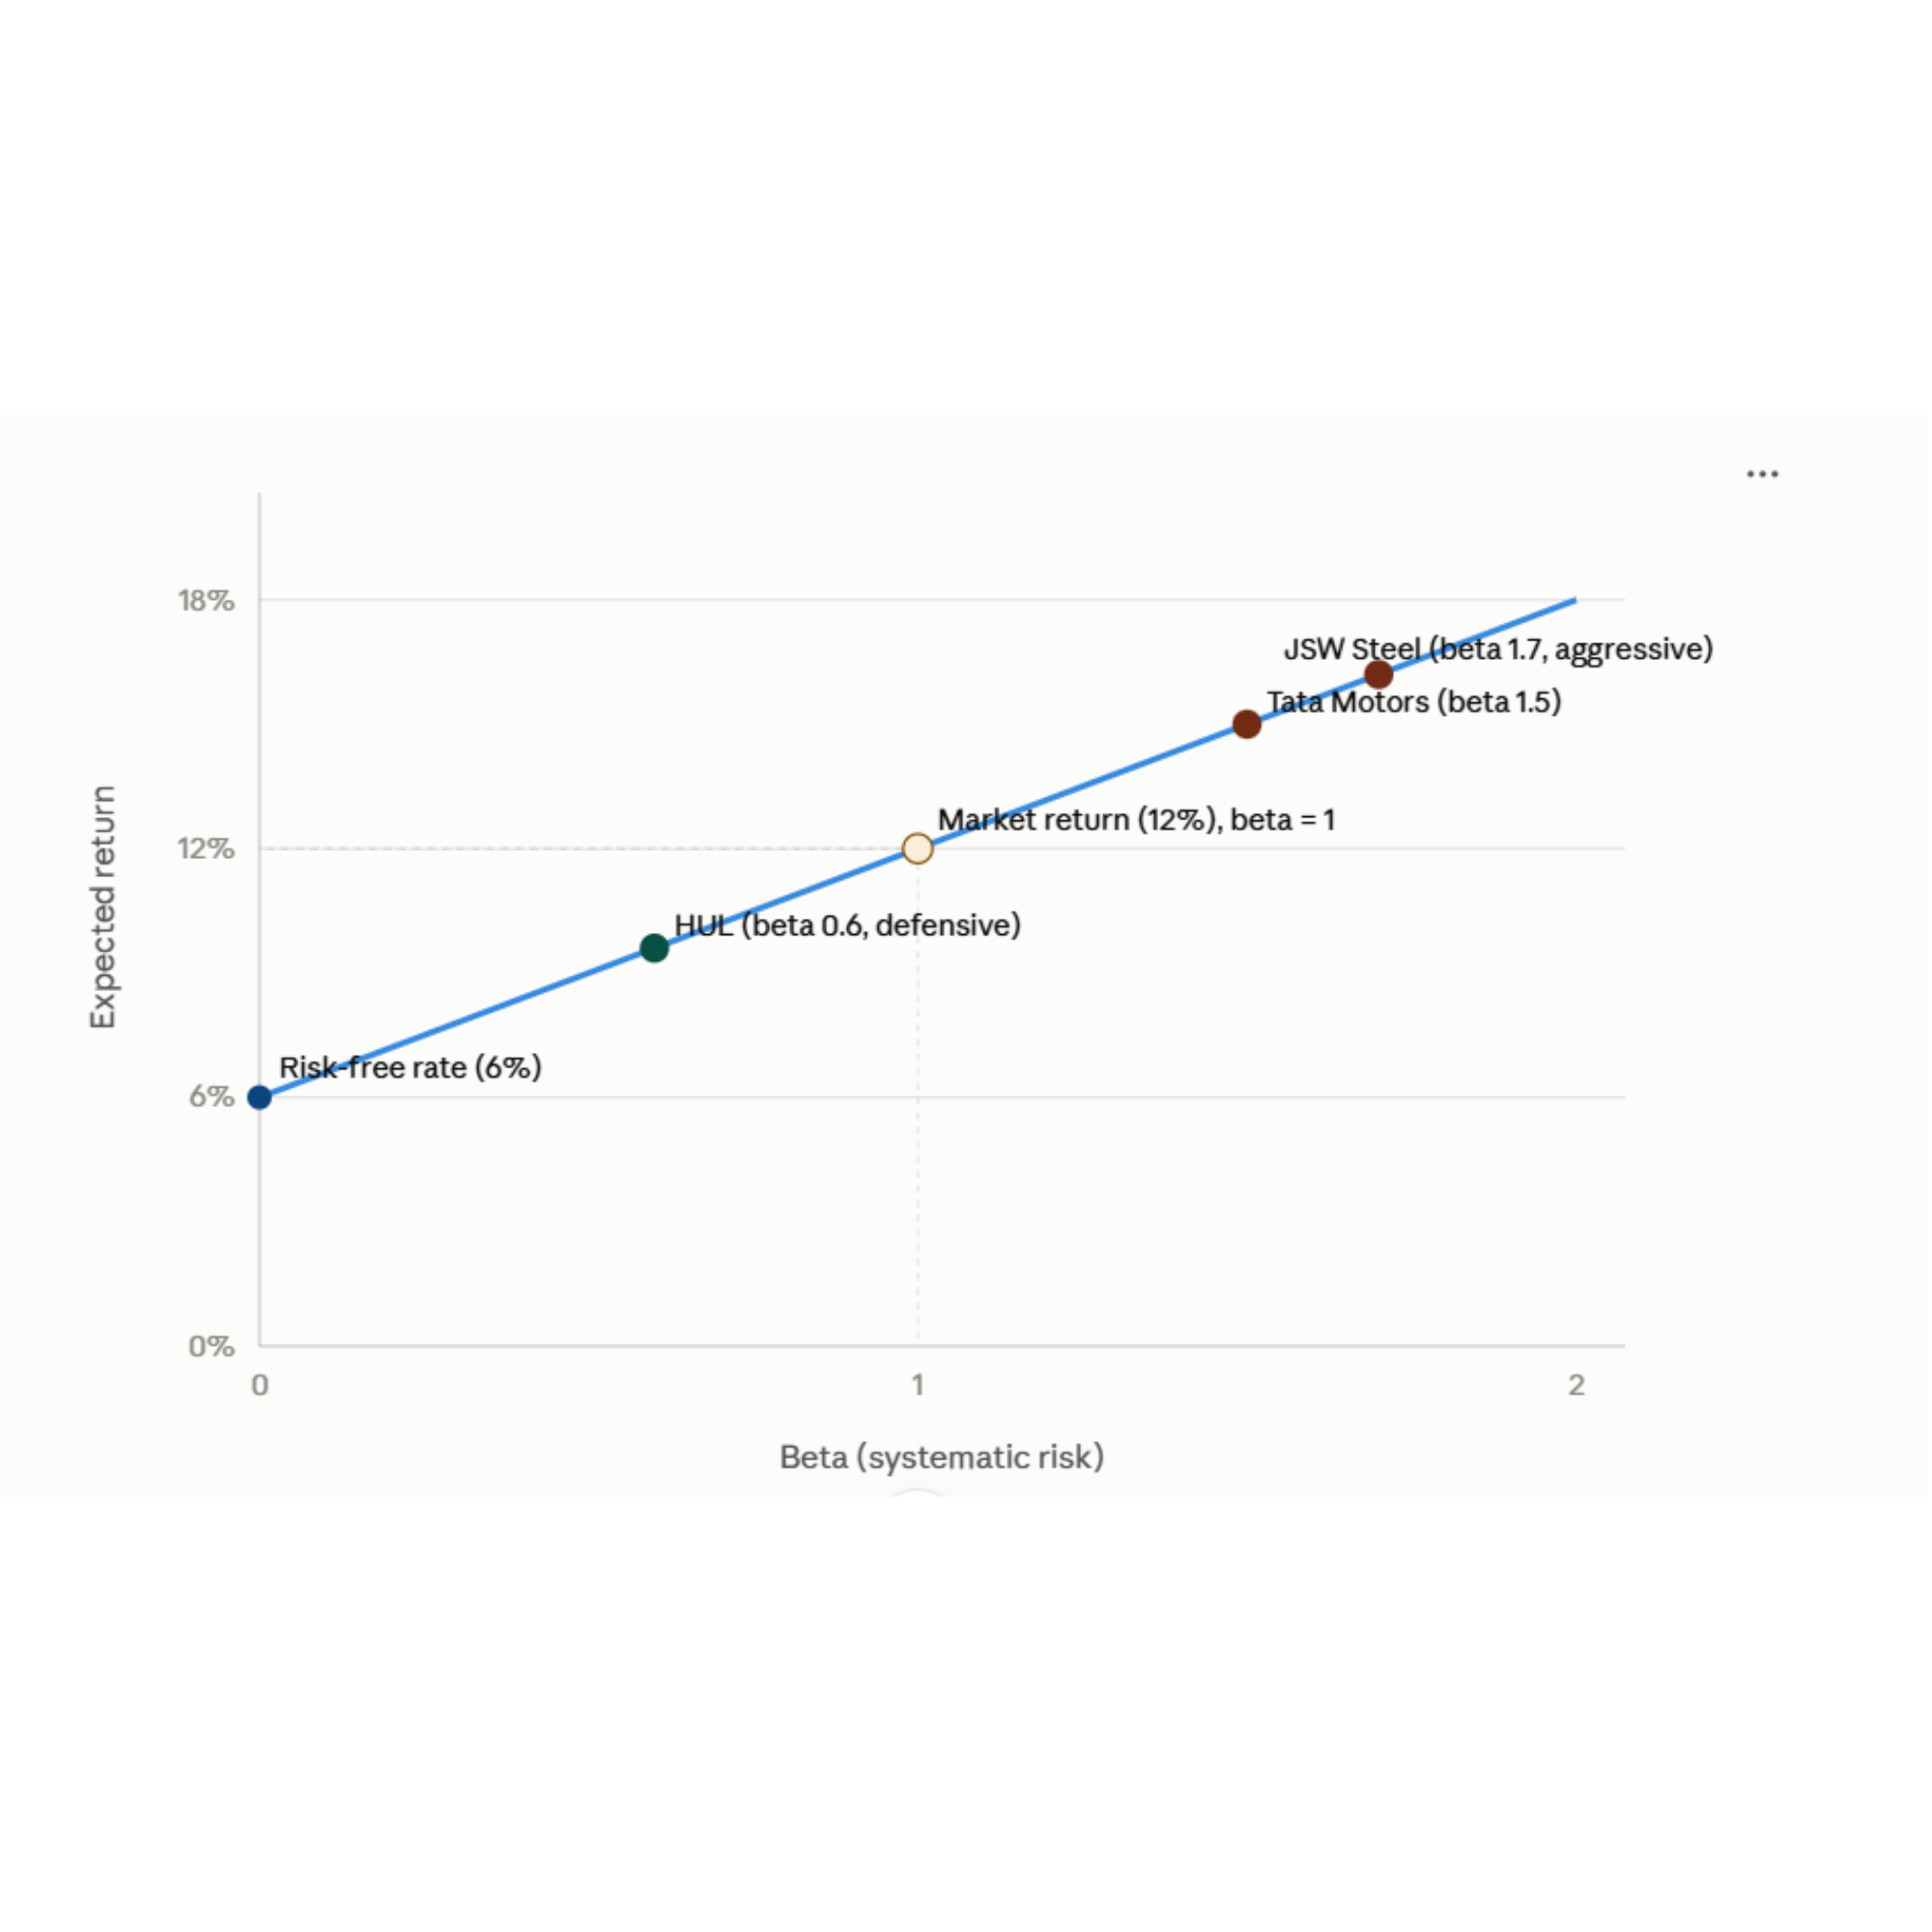
- At β = 0, the intercept is the risk free rate(e.g., yield on Indian government bonds).
- As β increases, the required return rises linearly, reflecting higher systematic risk.
- Securities with β < 1are considered defensive (e.g., FMCG stocks like Hindustan Unilever).
- Securities with β > 1are aggressive (e.g., cyclical stocks like Tata Motors or JSW Steel).
- At β = 1, the expected return equals the market return.
The positive slope of the SML illustrates that higher risk requires higher expected return.
9.5 Limitations of CAPM Model

While CAPM is elegant and widely used, it has several practical limitations:
- Transaction Costs Ignored: CAPM assumes frictionless markets, but in reality brokerage fees, taxes, and bid ask spreads exist.
- Beta Measurement Issues: Beta is based on historical data, which may not accurately predict future risk. For example, tech stocks like NVIDIAsaw beta values change dramatically during the AI boom.
- Borrowing at Risk Free Rate Unrealistic: CAPM assumes investors can borrow unlimited funds at the risk free rate, but actual borrowing costs vary by creditworthiness.
- Information Symmetry Assumption: CAPM assumes all investors have equal access to information. In reality, markets are not perfectly efficient — institutional investors often have an advantage.
- Simplified Risk Model: CAPM focuses only on systematic risk, ignoring other factors like liquidity risk, behavioral biases, or geopolitical shocks.