1.1 What is Technical Analysis
Imagine trying to navigate a busy highway without road signs or traffic signals. Similarly, trading without a framework is just as confusing. This is where Technical Analysis (TA) steps in. Just like a GPS, TA helps detect the stock market and navigate to the destination with definite confidence.
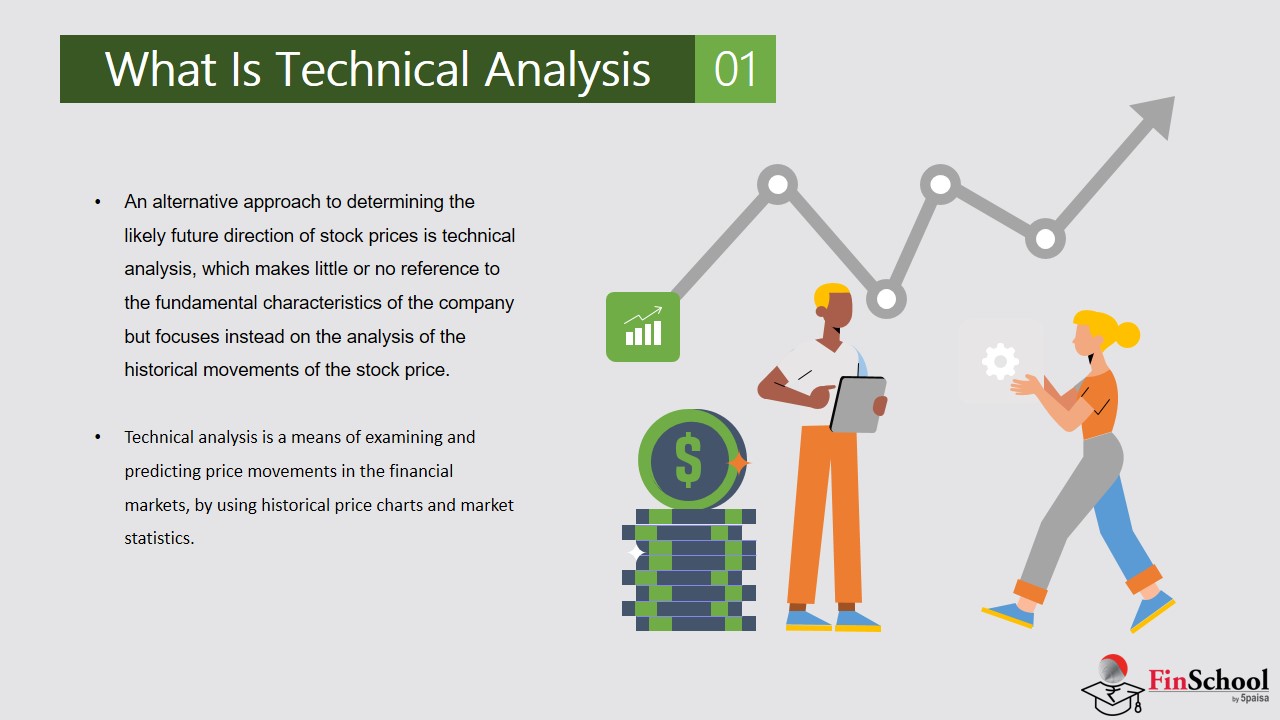
Technical analysis studies historical price movements and trading volume to forecast future market behavior, based on the idea that patterns repeat and prices reflect all known information.Rather than analyzing a company’s fundamentals, it reads market psychology through visual patterns and statistical signals to help traders time their entries and exits more effectively.
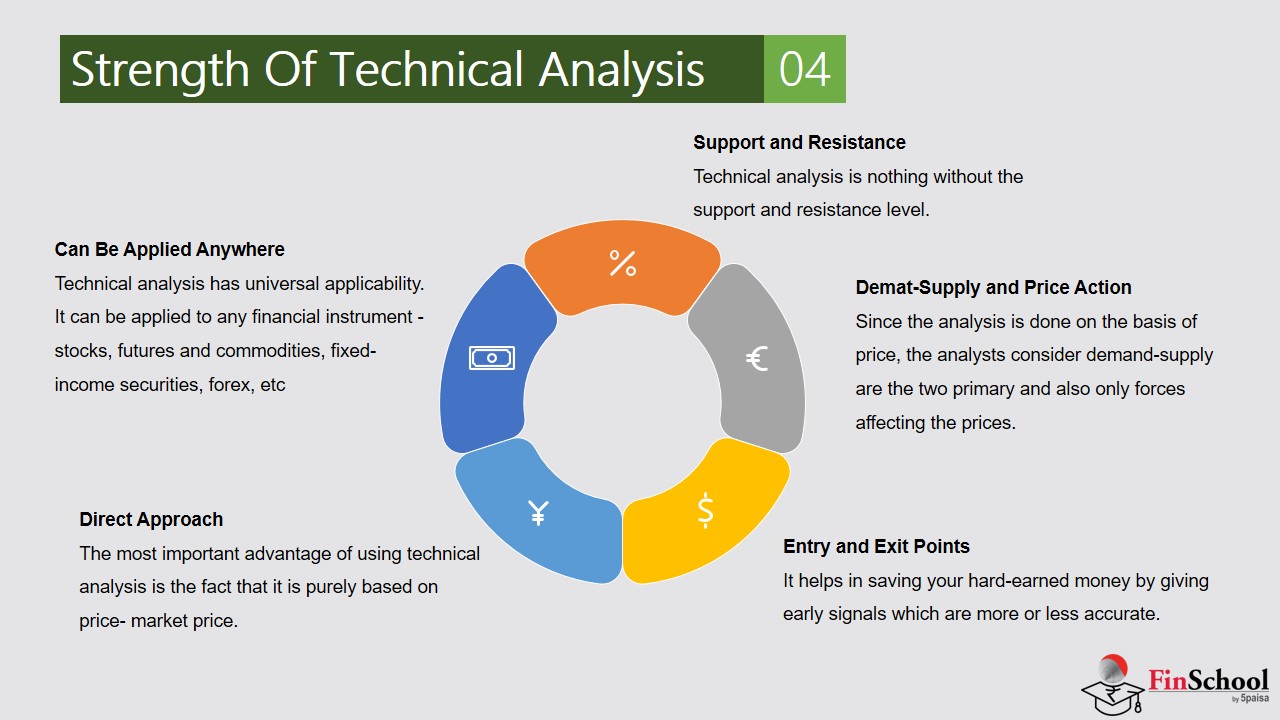
A solid technical analysis plan consists of the following strategies or points as checklists:
The price(level) that the market is set to enter (buy)
The price(level) that the market is set to exit (sell)
The risk which is accepted
The expected reward
The time of the position
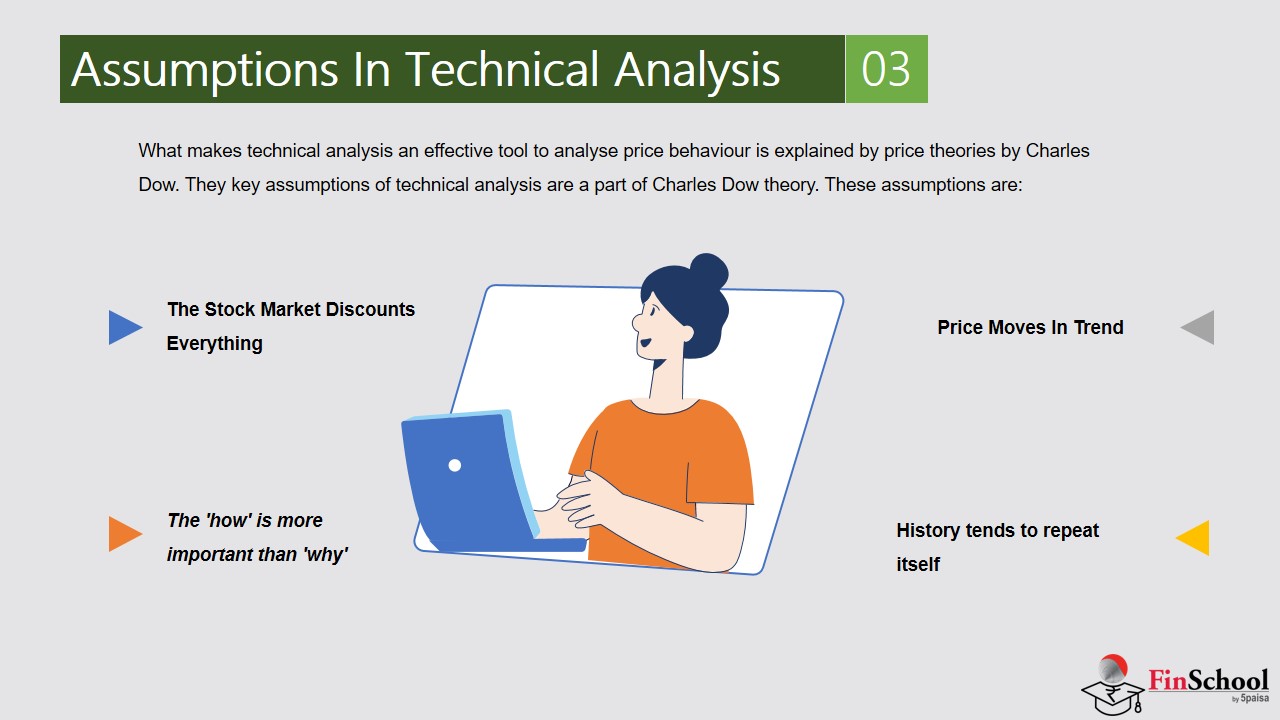
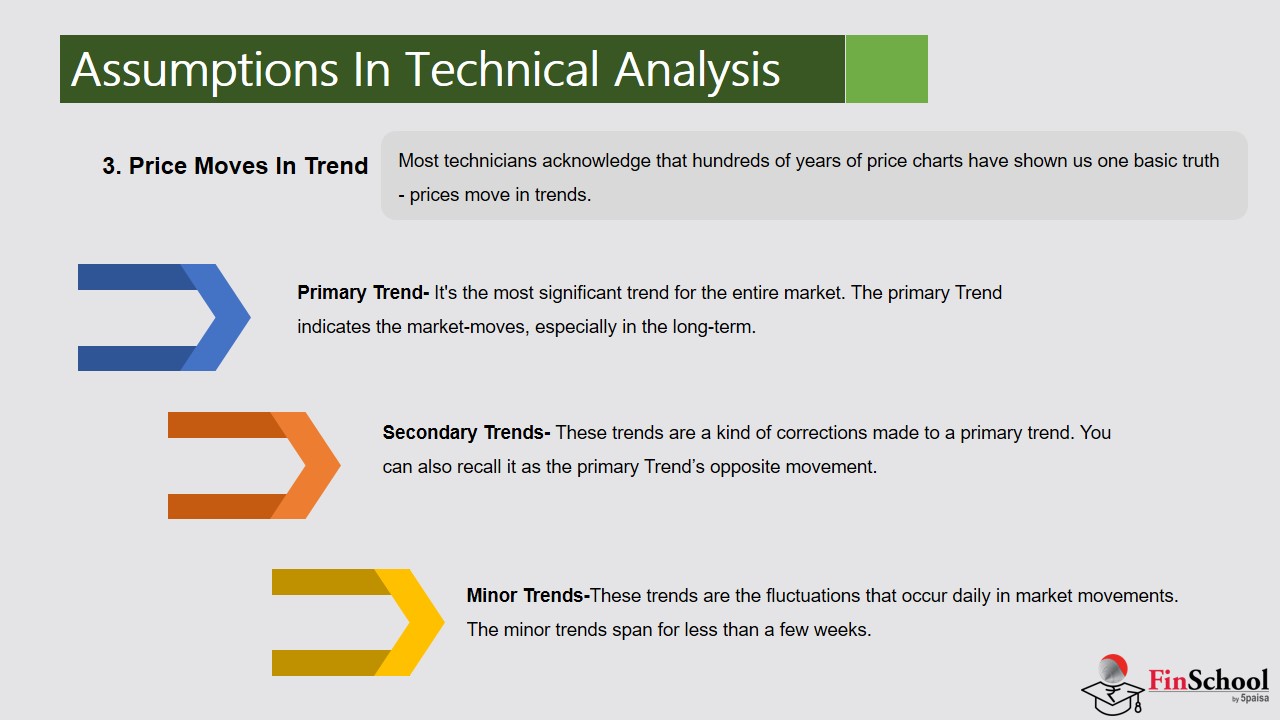
Technical Analysis is not looking at a company to analyze the balance sheets, neither is it considering the profit margins. Instead, it focuses on what the market is behaving like. It believes prices tend to move in trends, and history does tend to repeat it. Analyzing charts and indicators allows traders to anticipate market moves and make decisions based on probability rather than guesswork.
This module focuses on the fundamental aspects of technical analysis such as drawing trendlines, support and resistance, and candlestick and momentum indicators. Your approach could be short-term, and you could be a trader or a long-term investor whose objectives hinge on a proper impact.
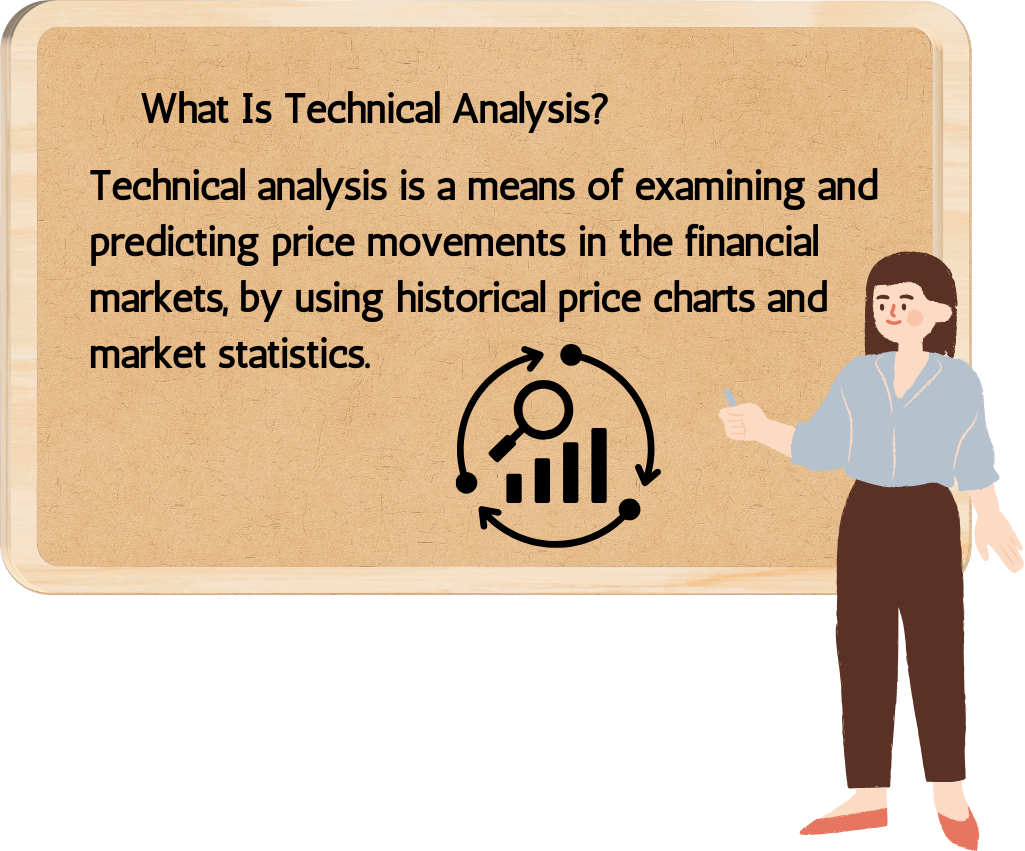
What is Technical Analysis?
Imagine attending a music concert. As the performance begins, the crowd starts clapping, swaying, and singing together. No one planned it, but everyone moves together. This is crowd psychology in action. The stock market behaves in a similar way.
Technical Analysis is the study of market psychology through price charts. It operates on the belief that all known information such as news, earnings, and sentiment is already reflected in the stock price. Rather than analysing a company’s financials, Technical Analysis focuses on historical price movements to anticipate future behaviour.
Technical Analysis helps answer key trading questions:
- When should I buy or sell?
- What is the expected risk and reward?
- How long should I hold the trade?
It is not about predicting the future with certainty. Instead, it aims to increase the probability of a successful outcome by interpreting the signals left by other market participants.
1.2 Technical Analysis vs Fundamental Analysis

Let’s imagine you’re evaluating a new restaurant. A fundamental analyst would take a deep dive into the business reading customer reviews, researching the chef’s background, analyzing the quality of ingredients, and the restaurant’s financial model. This approach is thorough and long-term in nature, aiming to assess the restaurant’s intrinsic value and sustainability. In contrast, a technical analyst would take a more observational route. They would stand outside the restaurant, watch how many people are walking in, how long they stay, and how satisfied they appear when they leave. The assumption here is that the crowd’s Behavior reflects the restaurant’s current appeal, and that patterns in this Behavior can help predict future popularity.
Both approaches are valid, but they serve different purposes. Technical analysis focuses on price and volume data, using tools like charts, indicators, and patterns to identify short- to medium-term trading opportunities. Its primary goal is to determine the right time to enter or exit a trade. Fundamental analysis, on the other hand, is concerned with a company’s financial health and intrinsic value. It relies on balance sheets, earnings reports, and financial ratios to identify long-term investment opportunities in undervalued or overvalued companies.
In practice, skilled market participants often combine both approaches. For instance, one might use fundamental analysis to identify a fundamentally strong company and then apply technical analysis to decide the most opportune moment to buy or sell. This integrated approach allows for both conviction in the asset and precision in timing.
1.3 The Reality Check: Technical Analysis Isn’t a Shortcut to Riches
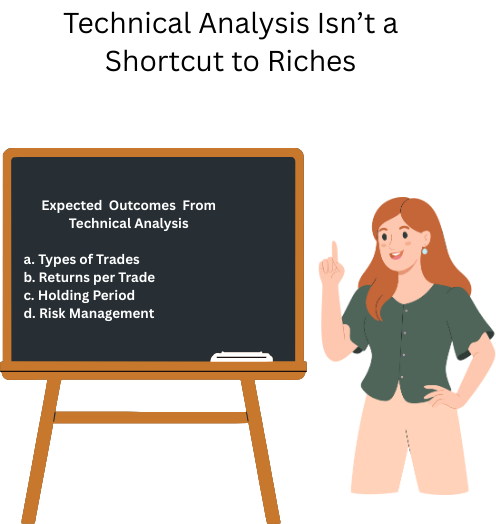
The reality is, a lot of people engage in trading without understanding that TA is not some magical economic formula which creates a lot of wealth in a matter of minutes. This is a very dangerous mentality to have. Like learning an advanced game such as chess or mastering a complex musical weave, TA is a skill that takes time, effort, and extreme discipline. If you approach it as a shortcut, you will most certainly lose a lot more than you gain.
Expected Outcomes from Technical Analysis
Type of Trades
- Technical Analysis is most effective over a shorter time span, optimally over a few weeks to a month.
- For long term investments, it is more effective to employ fundamental analyses (reviewing a company’s stats such as health, earnings, predicted growth, etc).
- For long term investors, TA can still work, but only to optimally position entry and exit points.
Returns Per Trade
- It is unrealistic to expect to double your profits instantly
- TA is most effective when looking for small, incremental profits over a longer span.
- The ultimate aim is not to create huge profits, but to create a solid surrounding of profitable investments.
Holding Period
- Having a TA-based strategy comes with a clear advantage – it allows you to act within a short time span.
- For intraday trading, positions can be held for a few minutes. For swing trading, positions are held for a few weeks.
- Anything more than that, you are more or less out of TA’s most effective guidelines.
Risk Management
- Losses are part of the game. What matters is how you handle them.
- If a trade starts going against you, don’t hold on hoping it’ll bounce back—especially in short-term setups.
- Cut your losses quickly and move on. There’s always another opportunity around the corner.
1.4 Key Takeaways

- Technical Analysis uses past price and volume data to predict future market movements. It operates on the belief that all known information is already reflected in the current price.
- Price trends tend to repeat because human behavior in markets is cyclical and pattern-driven. TA relies on visual tools like charts and indicators rather than company financials. It’s best suited for short-term trading strategies like intraday and swing trading.
- A solid TA plan includes entry/exit points, risk limits, reward targets, and a defined time frame. TA helps traders time the market, while fundamental analysis helps investors assess value.
- Market sentiment drives price action, and TA captures this through patterns and volume shifts. TA is like observing a crowd’s behavior, while fundamental analysis is like inspecting the restaurant’s kitchen.
- Success in TA requires discipline, patience, and consistent practice—not shortcuts or luck. Traders must cut losses quickly and let profitable trades run to manage risk effectively.
- TA is most reliable for trades held from minutes to a few weeks—not for long-term investing. It’s a probability-based approach that improves odds but doesn’t guarantee outcomes. Emotional control and consistency matter more than just knowing chart patterns.