9.1 The Harami Candlestick Pattern
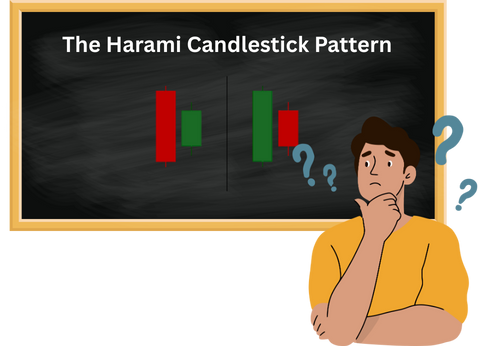
The Harami candlestick pattern is a two-candle formation that signals a potential trend reversal, either bullish or bearish, depending on where it appears on the chart. The word Harami comes from Japanese, meaning “pregnant,” which reflects the visual structure: a small candle nestled inside the body of a larger one.
It typically appears after a strong price move either upward or downward and reflects a shift in momentum. The first candle is large and dominant, representing the prevailing trend (bullish or bearish), while the second candle is much smaller and completely contained within the body of the first. This smaller candle suggests indecision or weakening pressure from the dominant side. In a bullish Harami, a small Green candle follows a large red one, hinting that sellers are losing control and buyers may step in. Conversely, a bearish Harami features a small red candle inside a large Green one, indicating that buying momentum may be fading. Traders often wait for confirmation from the next candle before acting, as the Harami alone signals hesitation rather than a guaranteed reversal. Let us understand bullish and bearish harami in detail
9.2 Bullish Harami
The bullish harami is a classic two-day candlestick pattern that hints at a potential reversal from a downtrend to an uptrend. True to its name, it typically forms near the bottom of a price chart, where selling pressure has dominated and buyers are just beginning to stir.
Here’s how it unfolds:
- On Day 1, you’ll see a long red candle, reflecting strong bearish sentiment and continued downward momentum.
- On Day 2, a small green candle appears its body completely contained within the body of the previous red candle. This smaller candle signals indecision or a pause in selling, suggesting that bears may be losing control.
Unlike the engulfing pattern, where the second candle aggressively overtakes the first, the bullish harami is more subtle. It’s like a quiet whisper in the market saying, “The tide might be turning.” Traders often wait for a third candle ideally a strong bullish one to confirm the reversal before entering a long position.


The OHLC Data for Day1: 4th Jan 1993
Open : 744.90
High : 744.90
Low:705.00
Close : 709.65
The OHLC Data for Day 2 : 11th Jan 1993
Open : 721.20
High :740.35
Low : 721.20
Close: 740.35
Market Psychology Behind the Pattern
- If you observe the market is sliding lower, and bears are in full control, pushing prices down day after day.
- A strong red candle forms, making a new low. This reinforces bearish momentum and deepens trader pessimism.
- The market opens higher than P1’s close, which is unexpected. Bears, who anticipated another weak open, are caught off guard.
- Bulls gain traction throughout the day, and P2 closes positively, forming a small green candle. However, this close is still below P1’s open, keeping the candle nestled inside P1’s body.
- The small green candle looks “pregnant” within the larger red candle, hence the name Harami.
- While the green candle alone may seem insignificant, its sudden appearance in a bearish environment triggers panic among bears and hope among bulls.
- This emotional shift can accelerate bullish interest, potentially leading to a trend reversal.
Trade Setup for Bullish Harami
Risk Taker -Arjun
Arjun sees the Harami pattern forming and is quick to act. By the close of 11 Jan, he notices that:
- P2 opened higher than P1’s close (721.20 > 709.65)
- P2’s close (740.35) is still below P1’s open (744.90)
These two conditions validate the Harami setup. Arjun enters a long position near the close of P2, anticipating a reversal. He places his stop-loss at the lowest low of the pattern, which is ₹705.00 from Day 1. Arjun is betting on early momentum and is comfortable with the risk.
Risk Averse Trader- Aakash
Aakash prefers confirmation. He waits for the next week’s candle to see if the bullish momentum continues. If the following candle closes higher and forms another green candle, he enters a long trade with more confidence. He also uses ₹705.00 as his stop-loss but enters at a slightly higher price, accepting reduced reward for increased certainty.
Here’s another instance where a bullish harami pattern appeared, but the trade resulted in a loss as the stop-loss level was breached.

Small Activity for you
Q1. What does the ‘Harami – Bull’ candlestick pattern typically indicate in technical analysis?
- A potential Bull Reversal
- A continuation of Downtrend
- Market Indecision with no clear direction
- A signal to short the stock
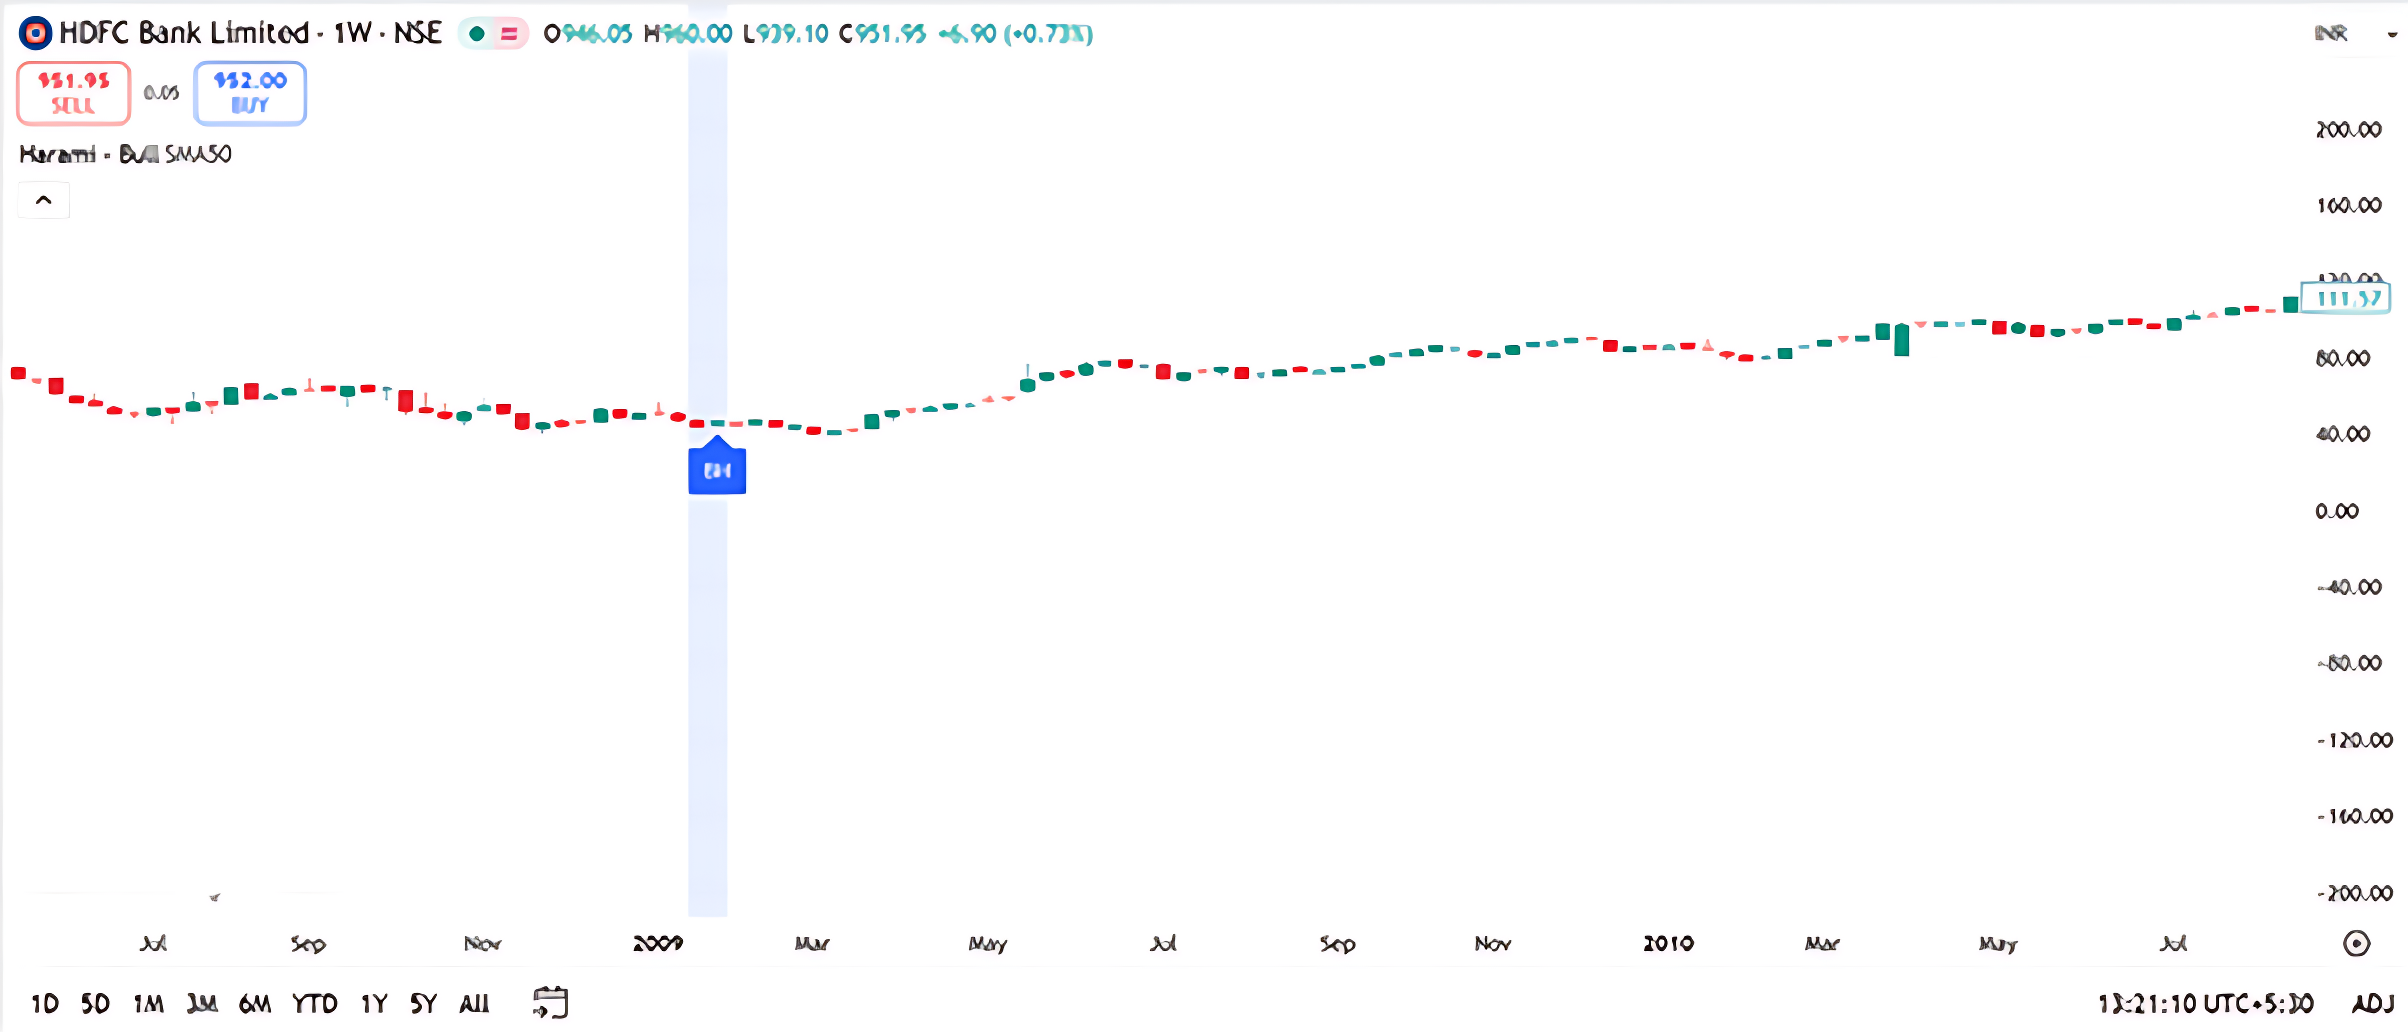
Q2. Around early 2009, the chart shows a marker labeled ‘BH’. What could this signify in the context of candlestick analysis?
- Bearish Hammer
- Bullish Harami
- Buy Hold
- Breakout High
Q3. What does a green candlestick generally represent on a weekly chart?
- The stock has no movement
- The stock closed higher than it opened
- The stock was delisted
- The stock closed lower than it opened
- If a trader sees a Bullish Harami pattern forming after a prolonged downtrend, what is a cautious next step?
- Ignore the Pattern and continue to hold short positions
- Wait for confirmation of reversal before entering a long position
- Enter a short position immediately
- Sell all holdings regardless of trend
Answers
- A potential bullish reversal
- Bullish Harami
- The stock closed Higher than it opened
- Wait for confirmation of reversal before entering a long position
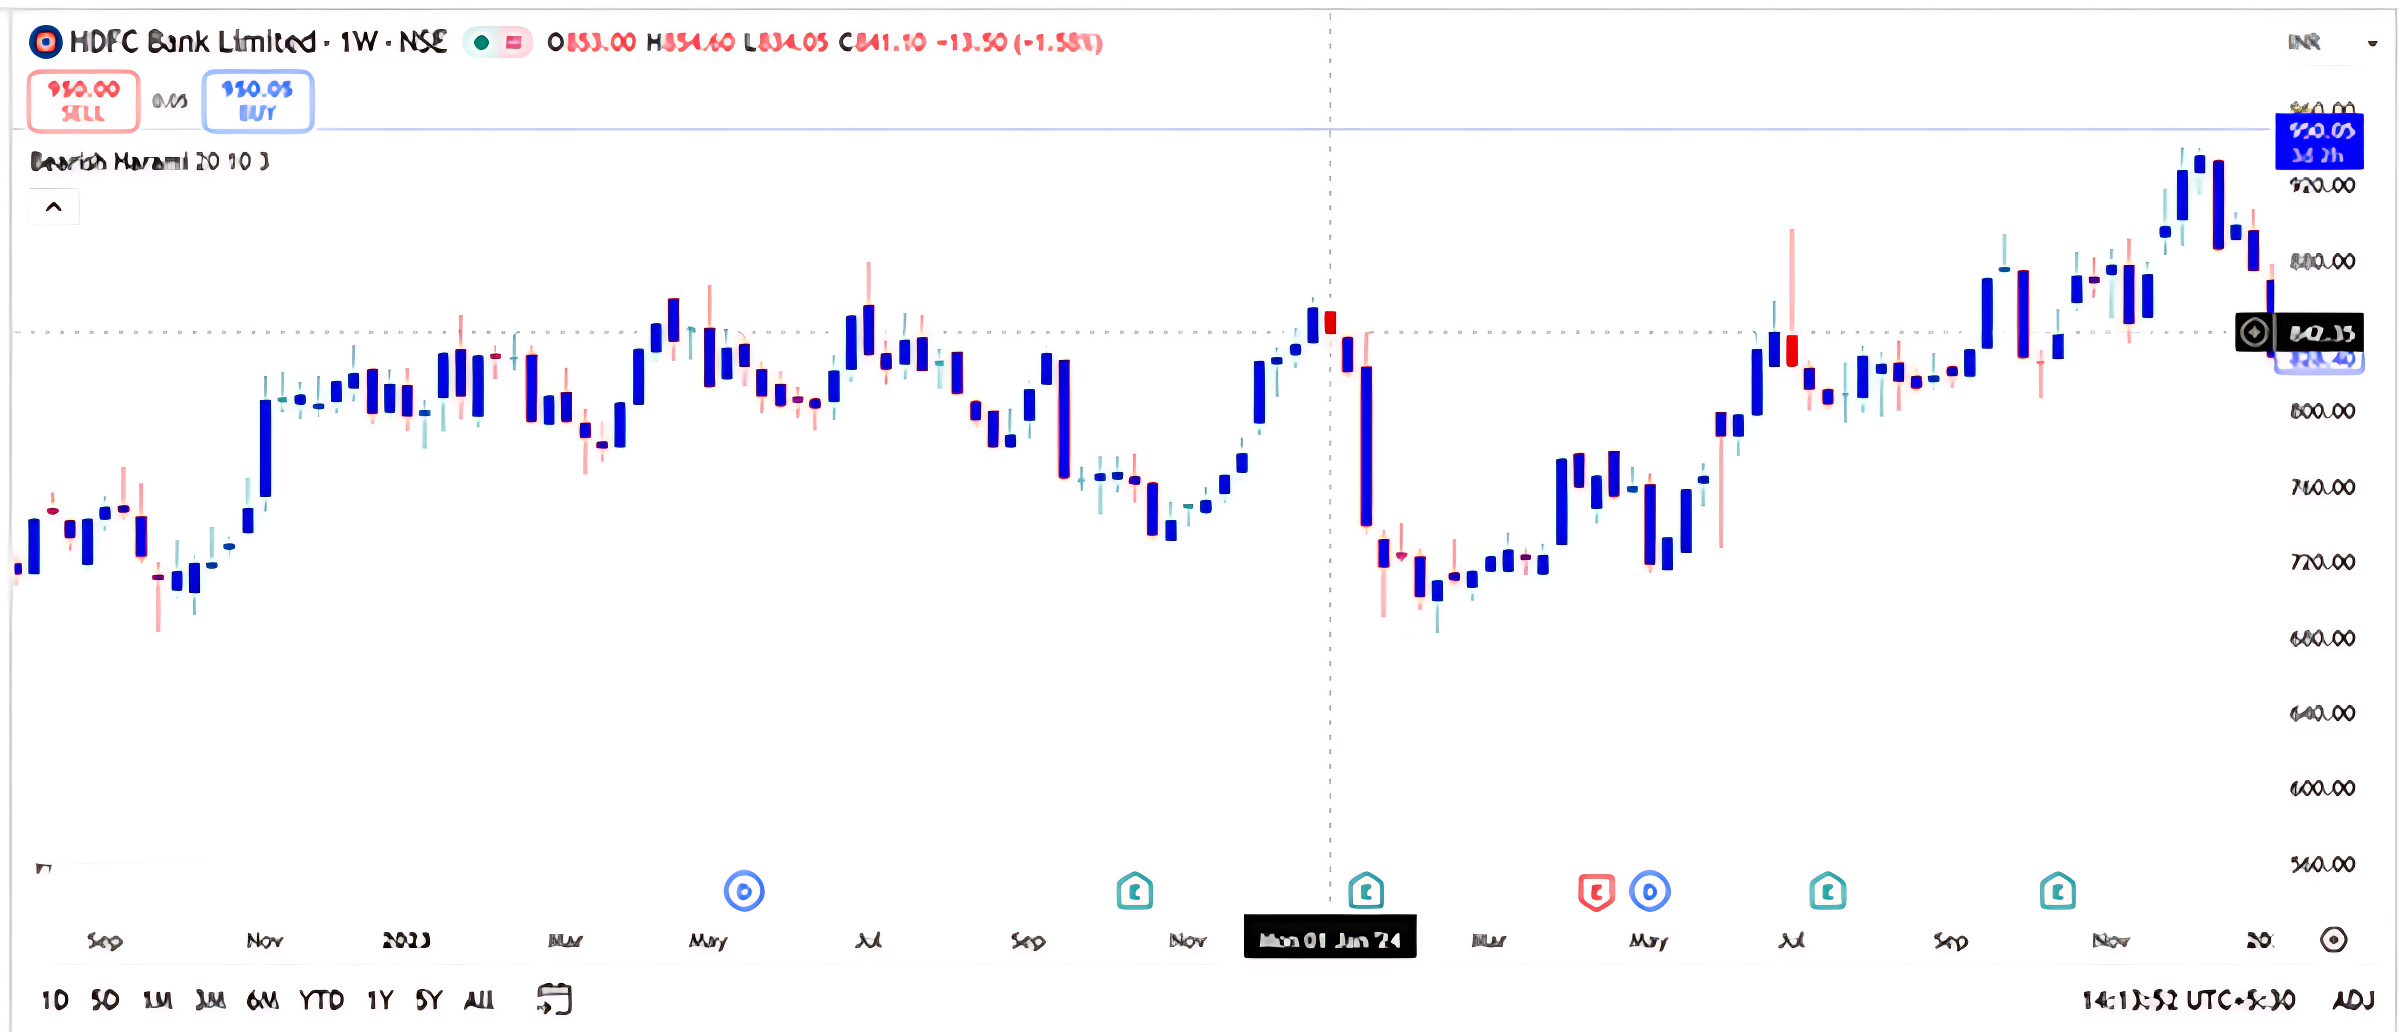
9.3 The Bearish Harami

The bearish harami pattern is a two-candle formation that signals a potential reversal from an uptrend to a downtrend. It begins with a strong bullish candle that reflects continued buying momentum. However, on the following day, a small bearish candle forms entirely within the body of the previous bullish candle. This smaller candle suggests hesitation or weakening strength among buyers. The sudden appearance of a red candle in an otherwise bullish environment can unsettle market participants, hinting that sellers may be preparing to take control. While the pattern itself doesn’t guarantee a reversal, it serves as an early warning sign. Traders often wait for confirmation such as a follow-through red candle or a break below support before initiating short positions. The bearish harami is essentially a quiet shift in sentiment, where the market pauses and begins to lean toward the downside.
OHLC Data for Day 1 and Day 2
Day 1 : 13th February
Open : 5382.10
High : 5606.70
Low : 5351.40
Close : 5564.30
Day 2 : 21st February
Open : 5561.90
High : 5629.95
Low : 5405.90
Close : 5350.30
Market Psychology Behind the Pattern
- If you observe the chart above the market is in a strong uptrend, with bulls firmly in control.
- On Day 1 (P1), a long blue candle forms as prices surge to a new high and close positively—reaffirming bullish dominance.
- On Day 2 (P2), the market unexpectedly opens lower, catching bulls off guard and triggering mild panic.
- As the day progresses, the market continues to slide, eventually closing in the red—forming a small bearish candle.
- This sudden shift unsettles bullish traders, prompting many to unwind their long positions.
- The expectation is that this negative momentum will continue, making it a potential opportunity to initiate a short trade
Trade Setup for Bearish Harami
Risk Taker -Arjun
Arjun is quick to act. He considers shorting the market near the close of P2, but only after validating the pattern using two conditions:
- P2’s open must be lower than P1’s close (P2 Open 5561.90 < P1 Close 5564.30)
- P2’s close must be below P1’s open ( P2 Close : 5350.30 < P1 Open 5381.10)
If both are satisfied, Arjun sees it as a legitimate bearish harami and enters the trade, aiming to catch the early downside move.
Risk Averse Trader-Aakash
Aakash prefers confirmation. He waits for the next trading day to see if a strong red candle forms, reinforcing the bearish sentiment. Only then does he initiate a short position, accepting a slightly delayed entry for greater certainty.
Stop-Loss Strategy
Both traders use the highest high between P1 and P2 as their stop-loss level. This protects against false signals and limits downside risk if the market resumes its uptrend. In our example it would be 5629.95.
Short Activity for You
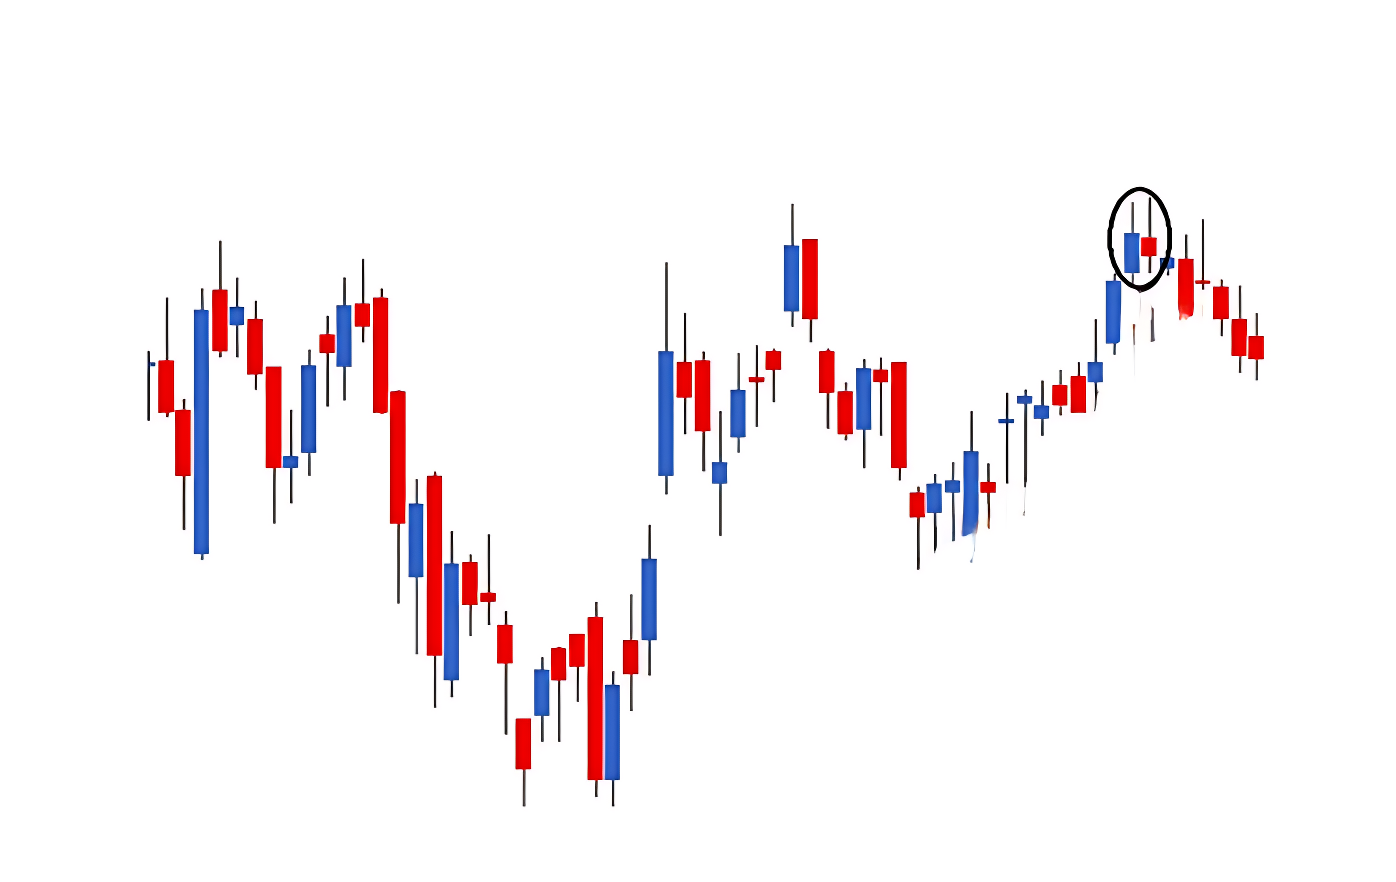
A Bearish Harami pattern appears on the chart after a bullish move. This pattern consists of a large bullish candle followed by a smaller bearish candle that is contained within the previous candle’s body.
Question: If you’re a trader and you spot this Bearish Harami near a recent high, what would be a cautious next step?
- A) Enter a long position
- B) Wait for bullish confirmation
- C) Consider reducing long exposure or preparing for a reversal
- D) Ignore the signal—it’s unreliable
Correct Answer: C) Consider reducing long exposure or preparing for a reversal Why: A Bearish Harami is a potential reversal signal. It suggests weakening bullish momentum, so managing risk and watching for confirmation is a prudent move.
9.4 Key Takeaways

The Harami pattern is a two-candle formation that signals a potential trend reversal. The name comes from a Japanese word meaning “pregnant,” which describes its visual structure: a small candle is completely contained within the body of a larger, preceding candle.
- This pattern appears after a strong price move and reflects a shift in momentum. The first large candle represents the prevailing trend, while the second, smaller candle suggests indecision or weakening pressure from the dominant side.
- Bullish Harami: This pattern hints at a potential reversal from a downtrend to an uptrend. It is formed by a long red candle followed by a small green candle whose body is completely contained within the body of the red candle. This suggests that sellers are losing control.
- Bearish Harami: This pattern signals a potential reversal from an uptrend to a downtrend. It begins with a strong bullish candle, followed by a small bearish candle that forms entirely within the body of the previous candle, suggesting that buying momentum may be fading.
- Market Psychology: The pattern’s appearance, with a small candle of opposing color, triggers an emotional shift in the market. In a bullish harami, the small green candle in a bearish environment creates hope among bulls and panic among bears. In a bearish harami, the sudden appearance of a small red candle unsettles bullish traders.
- Trade Setup for a Bullish Harami:
- Risk-Taker (Arjun): Arjun enters a long position near the close of the second candle (P2) after validating that P2’s open is higher than P1’s close, and P2’s close is lower than P1’s open. His stop-loss is placed at the lowest low of the two-candle pattern.
- Risk-Averse (Aakash): Aakash waits for a third candle to confirm the reversal, ideally a strong bullish one, before entering a long trade. He accepts a higher entry price for increased certainty and uses the same stop-loss level.
- Trade Setup for a Bearish Harami:
- Risk-Taker (Arjun): Arjun will consider shorting the market near the close of the second day (P2) after validating that P2’s open is lower than P1’s close and P2’s close is below P1’s open.
- Risk-Averse (Aakash): Aakash waits for the next trading day to see if a strong red candle forms, reinforcing the bearish sentiment, before initiating a short position.
- Stop-Loss: For both types of traders, the stop-loss is placed at the highest high between the two candles of the pattern.
- The Harami pattern alone signals hesitation rather than a guaranteed reversal, which is why traders often wait for confirmation from the next candle before acting on the signal.
- While the pattern serves as an early warning sign, it does not guarantee a reversal, and it is possible for a trade based on the pattern to result in a loss if the stop-loss level is breached.