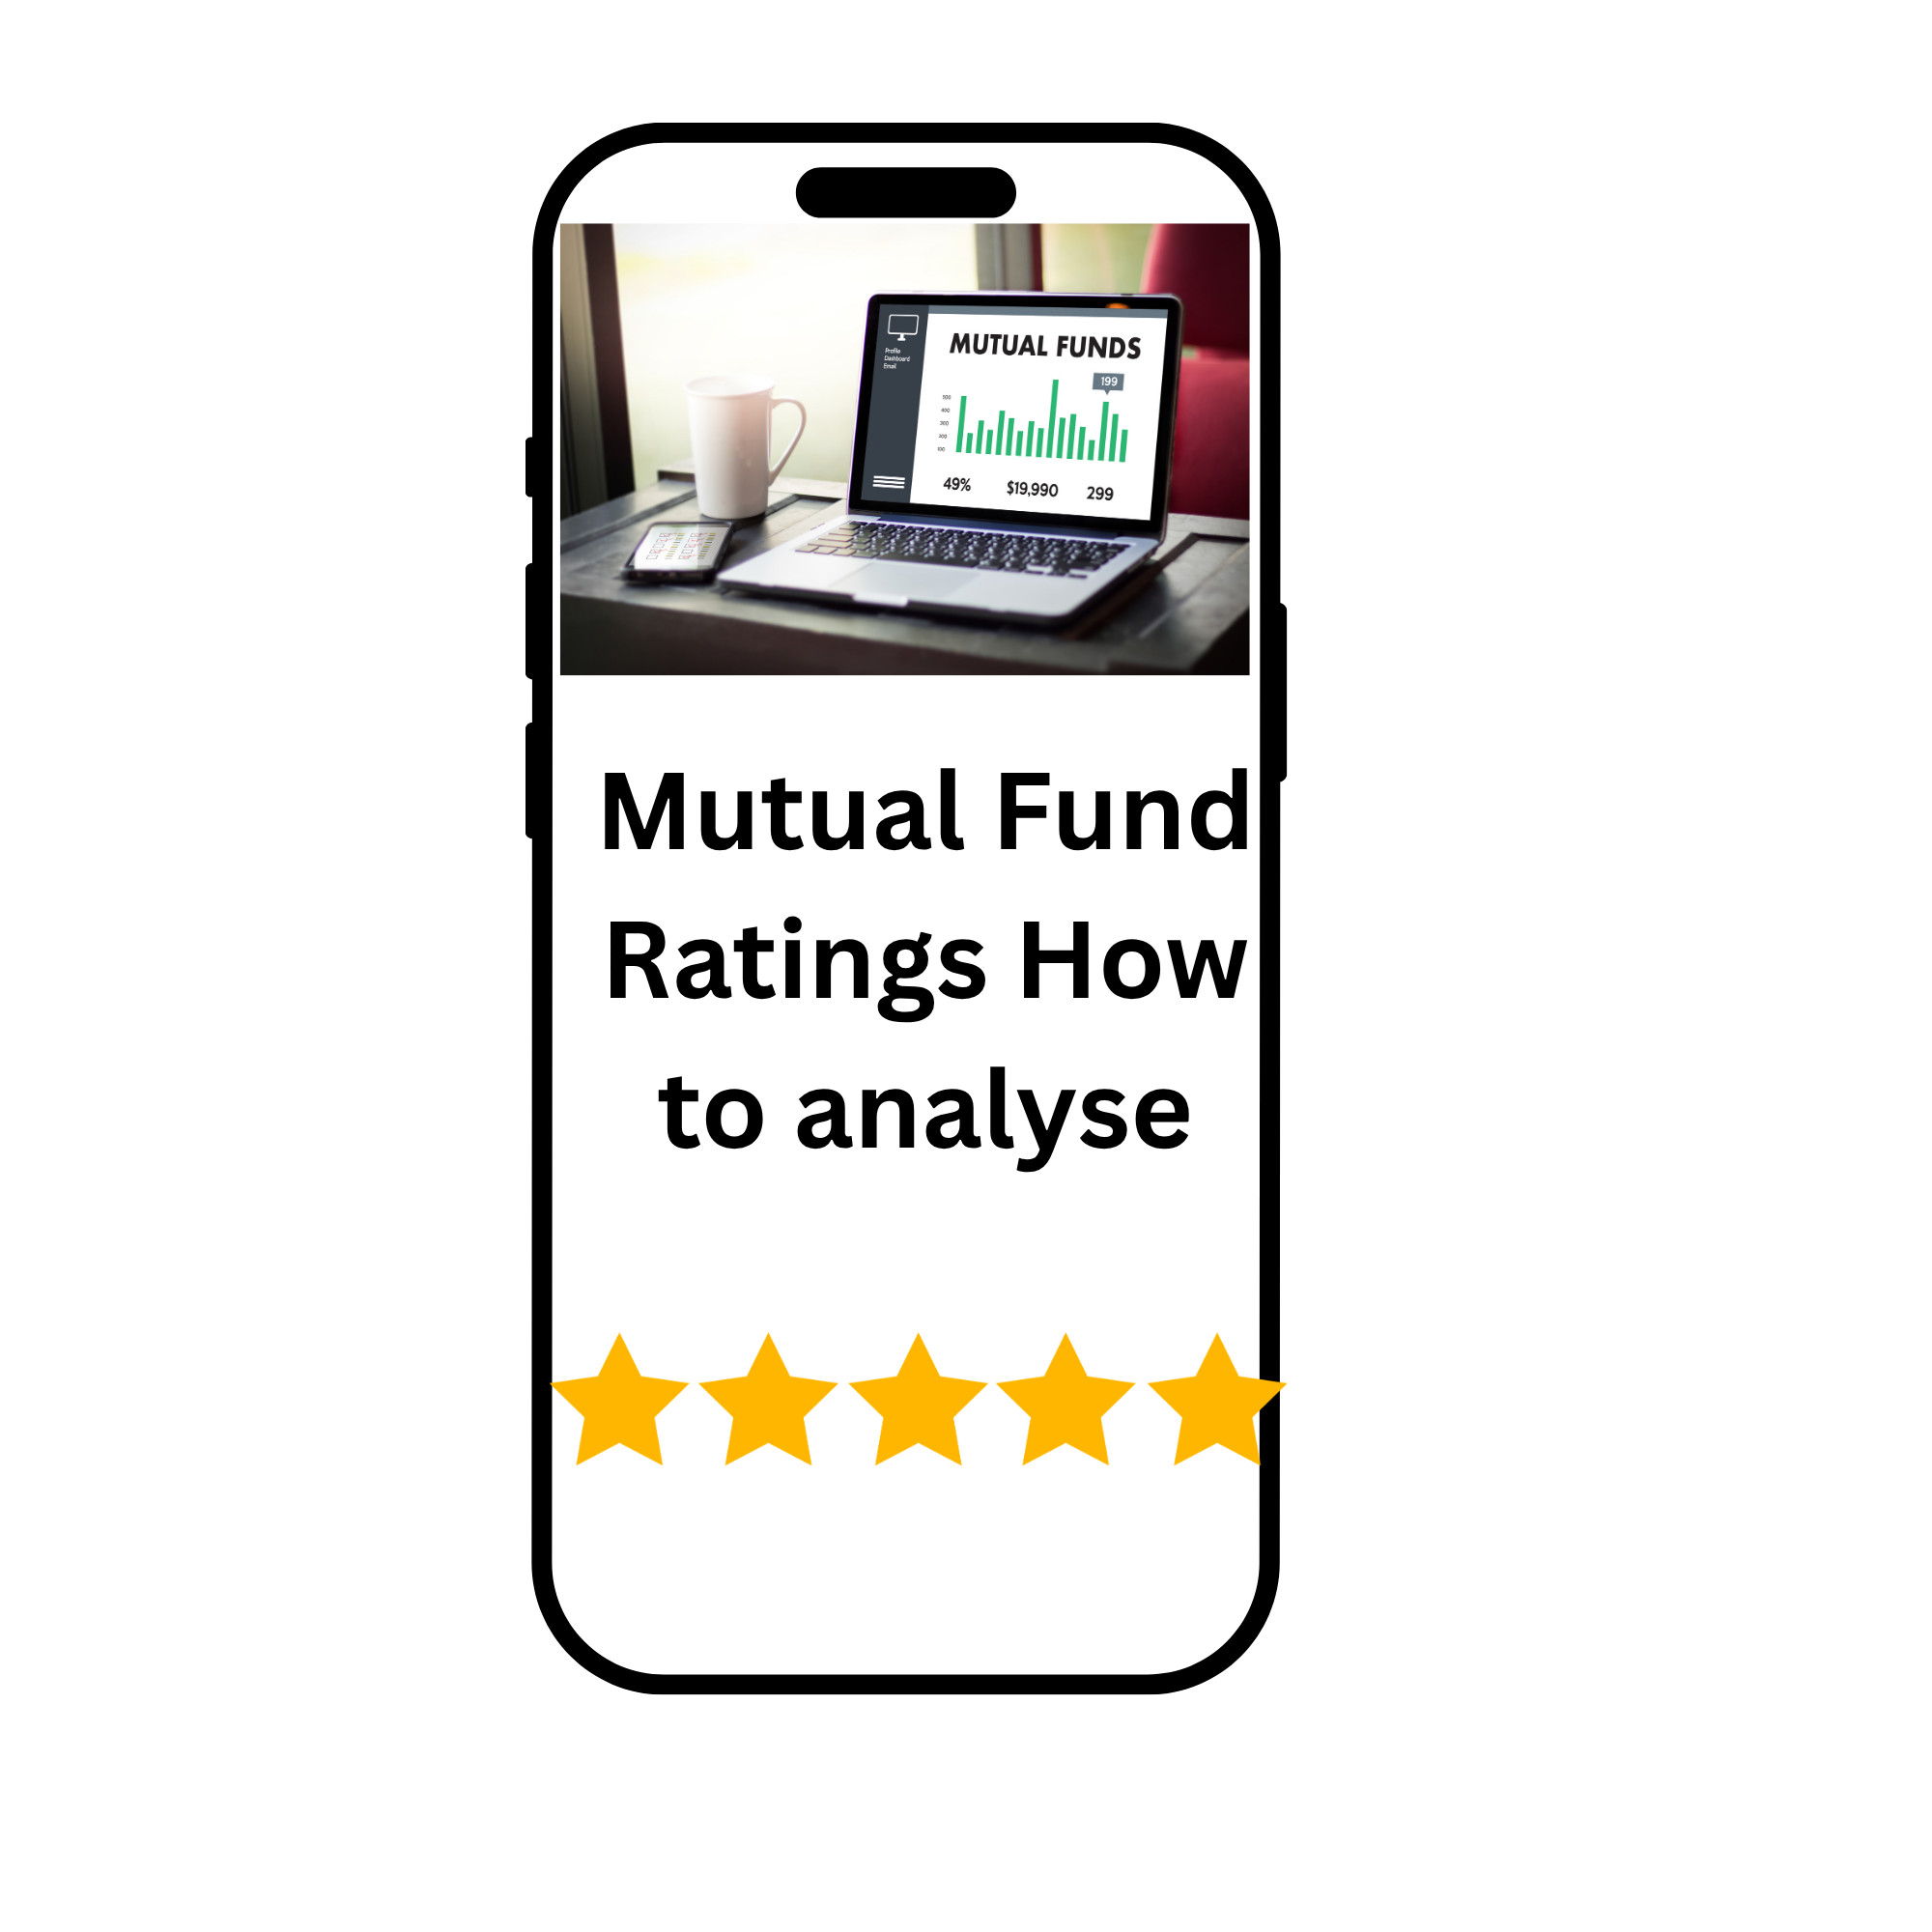
A mutual fund star rating tells you how a fund’s past risk-adjusted returns compare with other funds in the same category, usually over three to five years. It does not predict future returns or tell you whether the fund suits your goal. To analyse a fund properly, check its category fit, rolling returns across market cycles, expense ratio, portfolio, risk ratios, manager tenure and riskometer level.
Key takeaways
- Star ratings are backward-looking and category-relative. A 5-star rating means a fund did well against its peers in the past, not that it will do well next year.
- Rating agencies in India, such as CRISIL, Value Research and Morningstar, use different methods, so the same fund can carry different ratings.
- The direct planof a fund has a lower expense ratio than its regular plan, and that gap compounds over decades.
- Rolling returns, downside protection, portfolio quality and manager continuity tell you far more than a star count.
- Use ratings as a shortlisting tool, then apply the checklist in this guide to make the final choice.
Open almost any investment app in India and you will see mutual funds lined up with one to five stars beside their names. The stars are convenient and easy to read, and they strongly influence where new investor money flows. Yet choosing a fund mainly, or only, because of its star rating is one of the most common mistakes investors make, including well-informed ones.
This guide explains what mutual fund ratings really measure, why relying on them alone is risky, and the fuller framework professionals use to analyse a fund before investing.
What Do Mutual Fund Star Ratings Actually Measure?

A mutual fund star rating is a summary score of a fund’s historical risk-adjusted performance compared with other funds in the same category. Most rating systems look at trailing periods, often three and five years, and adjust returns for the volatility the fund took on to earn them.
In other words, a rating answers one narrow question: “How did this fund perform in the past, after adjusting for risk, relative to its peers?” It does not tell you:
- whether that performance is likely to continue,
- why the fund performed well (skill, a lucky sector bet or a favourable market phase),
- whether the person who produced those results still manages the fund, or
- whether the fund fits your goal, time horizon and risk tolerance.
How do CRISIL, Value Research and Morningstar ratings differ?
The three most widely used rating systems in India are built differently, which is why one fund can be rated 5 stars by one agency and 3 by another.
Rating provider | What it is called | How it broadly works |
CRISIL | CRISIL Mutual Fund Ranking (CMFR) | Ranks funds from 1 to 5, where Rank 1 is the best (top 10% of the category). Uses performance plus portfolio-based factors such as concentration, liquidity and, for debt funds, credit quality. Updated quarterly. |
Value Research | Fund Rating (1 to 5 stars) | Based mainly on risk-adjusted returns over three- and five-year periods within a category. Funds generally need at least a three-year history to be rated. |
Morningstar | Morningstar Rating (1 to 5 stars) | Uses a risk-adjusted return measure. Roughly the top 10% of a category get 5 stars, the next 22.5% get 4, the middle 35% get 3, the next 22.5% get 2 and the bottom 10% get 1. |
Because the methods differ, it is worth checking whether the agencies broadly agree. A fund rated highly by all three has a more robust history than one that tops only a single list.
Why Is It Risky to Choose a Fund on Star Ratings Alone?
1. Past performance does not reliably predict future performance
This is the disclaimer printed on every mutual fund document in India, and it exists for a reason. Research on fund performance persistence repeatedly finds that top-performing funds often fail to stay at the top. Investors who pile into last year’s 5-star fund frequently get average results afterwards, because the market conditions or manager calls that drove the earlier outperformance have changed. This pattern is often called “chasing yesterday’s winners.”
The S&P Dow Jones Indices SPIVA India scorecards add another layer: over long periods, a majority of actively managed large-cap funds in India have underperformed their benchmark. A high rating within a category does not mean a fund beat the index.
2. Ratings can shift quickly because of the measurement window
Ratings use rolling trailing periods. When a very strong or very weak year drops out of the three-year window, a fund’s rating can change even if nothing about the fund has changed. A rating is a snapshot of one historical window, not a stable measure of quality.
3. Ratings ignore your goal and time horizon
A 5-star small-cap fund can still be the wrong fund for someone saving for a car in two years. A rating compares a fund with its peers. It never compares a fund with your needs.
4. Ratings can influence fund manager behaviour
Because ratings drive inflows, there is a risk that a fund house manages for short-term rating metrics rather than long-term investor outcomes. This is subtle, but it is another reason to look beneath the stars.
How to Analyse a Mutual Fund: A 9-Point Framework
Here is the fuller framework to use once a rating has helped you build a shortlist.
Step 1: Confirm the category and benchmark fit
Start by understanding the fund’s SEBI category. Under SEBI’s 2017 categorisation rules, large-cap stocks are the top 100 companies by market capitalisation, mid-caps are ranked 101 to 250, and small-caps are ranked 251 onwards. Each category has defined portfolio limits, and each fund is measured against a stated benchmark, such as the Nifty 100 TRI for a large-cap fund.
Compare a fund only with funds in the same category and against its own benchmark. Comparing a small-cap fund’s returns with a large-cap fund’s returns tells you nothing useful.
Step 2: Check rolling returns, not just point-to-point returns
Point-to-point returns (for example, “3-year return: 18%”) depend heavily on the start and end dates. Rolling returns calculate the return for every possible period of a given length, such as every three-year period over the last ten years, and show how often the fund beat its benchmark and by how much.
A fund that beat its benchmark in, say, 75% of all rolling three-year periods offers far stronger evidence of a sound process than a fund with one spectacular year.
Step 3: Look at performance across different market cycles
Check how the fund behaved in at least three types of market:
- a strong bull market,
- a sharp correction, such as the March 2020 crash, and
- a sideways or range-bound market.
Consistency across these phases suggests a durable investment process. A fund whose entire track record comes from one favourable phase deserves caution.
Step 4: Compare expense ratios, especially direct vs regular plans
The expense ratio is the annual fee a fund charges, expressed as a percentage of your investment. Unlike future returns, which are uncertain, the cost is near-certain and compounds every year.
Every fund has two versions:
- Regular plan: Bought through a distributor who earns a commission, so the expense ratio is higher.
- Direct plan: Bought directly from the fund house or a direct platform, with no distributor commission, so the expense ratio is lower. Direct plans have been available in India since January 2013.
The underlying portfolio is identical. Only the cost differs. Consider a simple illustration: ₹10 lakh invested for 20 years at a gross return of 12% grows to roughly ₹81 lakh with a 1.0% annual expense ratio but to about ₹90 lakh with a 0.4% expense ratio. The difference of around ₹9 lakh comes purely from costs.
What changed in 2026: Under the SEBI (Mutual Funds) Regulations, 2026, effective 1 April 2026, fund houses disclose a Base Expense Ratio (BER), with statutory levies such as GST, STT and stamp duty shown separately on actuals. Your total cost may therefore look different on fact sheets. Compare like with like, and look at the total expense ratio you actually pay.
Step 5: Study the portfolio, not just the label
Read the latest monthly portfolio disclosure on the fund house’s website and check:
- Top 10 holdings and what share of assets they represent,
- Sector allocation, and whether it is concentrated in one or two themes,
- Market-cap mix, to confirm the fund is true to its label, for debt funds, credit ratingsof the bonds held and the average maturity and modified duration.
Two funds in the same category can carry very different risks. A fund with 60% of its money in ten stocks behaves very differently from one spread across 70 holdings.
Step 6: Read the risk ratios
Fact sheets publish several risk measures. Here is what each one tells you:
Ratio | What it measures | What to look for |
Standard deviation | How much returns swing around their average | Lower means a smoother ride, compared within the same category |
Beta | Sensitivity to the benchmark’s moves | Below 1 means the fund tends to move less than the market |
Sharpe ratio | Return earned per unit of total risk | Higher is better |
Sortino ratio | Return per unit of downside risk only | Higher is better, and useful for cautious investors |
Alpha | Return above what the fund’s beta would predict | Positive and consistent alpha suggests skill |
Downside capture ratio | How much of the benchmark’s fall the fund suffers | Below 100 means the fund falls less than the market |
You do not need to master every ratio. Even comparing Sharpe ratio and downside capture across three shortlisted funds will sharpen your decision.
Step 7: Check fund manager tenure
A fund’s track record is largely the work of its manager or team. If the manager who built a ten-year record left eight months ago, that record says much less about the future. Check the manager’s start date on the fund in the scheme information document or fact sheet, and look at their record on other funds.
Step 8: Review the portfolio turnover ratio
The turnover ratio shows how often the fund buys and sells holdings in a year. High turnover means higher trading costs, which reduce returns even when they are not obvious in the headline expense ratio. A turnover of 30% implies holding stocks for about three years on average; 150% implies frequent trading.
Step 9: Match the riskometer and the fund to your goal
Every fund in India carries a SEBI riskometer with six levels: Low, Low to Moderate, Moderate, Moderately High, High and Very High. Match this to your own risk profile.
Then ask the most important question of all: does this fund suit my goal and timeline?
Time horizon | Categories that usually fit |
Under 1 year | Liquid funds, overnight funds, money market funds |
1 to 3 years | Ultra-short and short-duration debt funds, arbitrage funds |
3 to 5 years | Conservative or balanced hybrid funds, large-cap funds |
5 years or more | Flexi-cap, large and mid-cap, index funds; mid- and small-cap only with a high risk tolerance |
The “best” fund on any league table is the wrong fund if it does not match the job you need it to do.
Don’t Forget Taxes and AUM
Taxes affect your net return. Under current rules, equity fund gains held for more than 12 months are taxed at 12.5% above ₹1.25 lakh a year, and short-term equity gains at 20%. Gains on debt funds bought on or after 1 April 2023 are taxed at your income slab rate. Check the latest rules before investing.
Assets under management (AUM) also matter. A very small fund may face closure or higher costs, while a very large small-cap fund can find it harder to buy and sell stocks without moving prices. Neither extreme is automatically bad, but both are worth noting.
How to Use Star Ratings the Right Way
Ratings still have value. They reflect verified, risk-adjusted history, so they work well as a first filter. A sensible process looks like this:
- Filter a category using ratings to get a shortlist of five or six funds.
- Analyse each fund using the nine-point framework above.
- Choose the fund that best fits your goal, risk tolerance and cost preference.
- Review once a year, comparing the fund with its benchmark and peers.
Treat a rating as the start of your research, never the end of it.
Should You Switch Funds When the Rating Drops?
Not on the rating alone. A downgrade can simply reflect a strong year leaving the measurement window. Consider switching only if you see a deeper problem, such as:
- Underperformance against the benchmark for two to three years in rolling returns,
- A change in fund manager followed by a change in strategy,
- A change in fund mandate or category, or
- The fund no longer matching your goal.
Remember that switching is a sale. It can trigger capital gains tax and, within the exit-load period, an exit load.
A Practical Checklist Before You Invest
Use these questions for any fund you are considering:
- Does the fund’s category match my financial goal and time horizon?
- How has it performed in rolling returns against its benchmark, not just its recent return?
- How did it behave in a bull market, a crash and a flat market?
- What is the expense ratio of the direct plan, and how does it compare with peers?
- What do the top holdings, sector weights and, for debt funds, credit ratings look like?
- Are its Sharpe ratio and downside capture competitive within the category?
- Is the manager who built the track record still running the fund?
- Does the riskometer level match my own comfort with risk?
- Have I considered the tax impact of investing and, later, of exiting?
The Bottom Line
Mutual fund star ratings are a convenient but limited summary of past, risk-adjusted performance against category peers. They are useful for building a shortlist and dangerous as the only reason to invest. A proper analysis looks at consistency through rolling returns and market cycles, the real cost of the expense ratio, the actual portfolio, risk ratios, manager continuity and, above all, whether the fund fits your own goal and time horizon. Do that, and you will choose funds for what they can do for you, not for how many stars they display on a screen.
Sources and Further Reading
- SEBI, Categorization and Rationalization of Mutual Fund Schemes (Oct 2017): https://www.amfiindia.com/Themes/Theme1/downloads/1507291273374.pdf
- SEBI (Mutual Funds) Regulations, 2026: https://www.taxmann.com/post/blog/sebi-notifies-mutual-funds-regulations-2026
- CRISIL, Mutual Fund Ranking methodology: https://www.crisil.com/content/crisil/en/home/what-we-do/financial-products/mf-ranking.html
- Value Research, Fund rating methodology: https://www.valueresearchonline.com/fund-rating-methodology/
- Morningstar, The Morningstar Rating for Funds: https://morningstar.com/content/cs-images/v3/assets/blt9415ea4cc4157833/blt4746ec2633987fb2/67819c62694c4c0ed070ba0a/Morningstar_Rating_for_Funds.pdf
- S&P Dow Jones Indices, SPIVA India Scorecard: https://www.spglobal.com/spdji/en/spiva/article/spiva-india-year-end-2025/
- AMFI, Riskometer and investor education: https://www.mutualfundssahihai.com/en/amfi