17.1 Natural Gas: Origins, Evolution, and Exploration

Varun: Isha, we’ve covered crude oil, but I keep hearing that natural gas is just as important. What makes it different?
Isha: Great question. Natural gas is cleaner than oil and coal, and it’s used for power, heating, cooking—even fertilizers. It’s mostly methane and burns with fewer emissions.
Varun: So it’s part of the energy transition?
Isha: Exactly. Plus, it has a fascinating history—from ancient Greek temples to bamboo pipelines in China. Today, it’s a global commodity with India playing a growing role.
Varun: And it’s traded on MCX too?
Isha: Yes, and it’s one of the most volatile energy contracts. Weather, storage data, and global demand all impact its price.
A Late but Essential Chapter
Natural Gas might be arriving late in this module, but its importance in the global energy and commodities landscape makes it an essential topic—especially for traders. While we’ve already explored crude oil, natural gas deserves its own spotlight due to its unique market behaviour, industrial relevance, and growing role in the energy transition.
What Is Natural Gas?
Natural gas is a naturally occurring hydrocarbon gas, primarily composed of methane (CH₄). It is a non-renewable fossil fuel, formed deep within the Earth over millions of years. Known for its clean-burning properties, natural gas is widely used for electricity generation, residential heating, cooking, and as a feed-stock in fertilizers and petrochemicals. Its versatility and relatively lower carbon emissions compared to coal and oil have made it a key player in the global shift toward cleaner energy.
A Glimpse into the Past
The story of natural gas begins in antiquity. Around 1000 B.C., natural gas seeped from the Earth’s crust on Mount Parnassus in ancient Greece and ignited spontaneously. The Greeks believed this eternal flame was divine and built the Temple of Apollo at Delphi around it, possibly the earliest recorded encounter with natural gas.
By 500 B.C., the Chinese had discovered natural gas seeps and began using bamboo pipelines to transport it. They ingeniously used the gas to boil seawater, producing potable water—an early example of industrial application.
Fast forward to 1785, and Great Britain became the first country to commercially use natural gas, derived from coal, to light street lamps and lighthouses. This marked the beginning of natural gas as a utility.
How Natural Gas Is Formed
Natural gas originates from the decomposition of ancient organic matter, plants and marine organisms, that was buried under layers of sediment. Over millions of years, heat and pressure transformed this material into coal, crude oil, and natural gas. The gas either migrated into porous rock formations or became trapped in shale layers, forming reservoirs.
In its raw form, natural gas is colourless, odourless, and tasteless, which poses a serious safety risk. To make leaks detectable, producers add mercaptan, a compound with a strong sulphur-like odour, making it easier to identify gas leaks before they become hazardous.
Exploration and Extraction
The process of locating natural gas is similar to oil exploration. Geologists conduct seismic surveys—both onshore and offshore—to identify potential reserves. If the data is promising, an exploratory well is drilled. If viable quantities are found and the economics are favorable, production wells are established.
Modern extraction techniques like hydraulic fracturing (fracking) and horizontal drilling have unlocked vast reserves, especially in shale formations. These technologies have transformed countries like the United States into net exporters of natural gas.
India’s Role in the Global Gas Market
India ranks as the 7th largest producer of natural gas, contributing around 2.5% of global output. Major production zones include Assam, Gujarat, Andhra Pradesh, and offshore fields in the Krishna-Godavari Basin. A significant portion of India’s gas is used for power generation, industrial heating, LPG blending, and as a feed-stock in the fertilizer sector.
A recent milestone is the KG-DWN-98/2 deep-water project operated by ONGC, which is expected to produce 15 million standard cubic meters per day at peak. This project is part of India’s broader strategy to reduce LNG imports and enhance energy security.
Natural Gas in the Trading World
For traders, natural gas is one of the most volatile energy contracts. Prices are influenced by a range of factors including:
- Weather patterns, especially winter demand in North America and Europe.
- Storage data from the U.S. Energy Information Administration (EIA).
- Geopolitical tensions affecting supply chains.
- Currency fluctuations, particularly USD-INR for Indian traders.
- Industrial and export demand, especially from sectors like fertilizers and chemicals.
A Notable Market Event: The Amaranth Advisors Collapse
No discussion on natural gas trading is complete without mentioning the infamous Amaranth Advisors collapse in 2006. The hedge fund lost over $6 billion in a matter of weeks due to highly leveraged bets on natural gas futures. The fund’s trader, Brian Hunter, had taken massive positions expecting prices to rise, but a sudden shift in weather forecasts and market sentiment led to catastrophic losses. This event remains one of the largest hedge fund failures in history and serves as a cautionary tale about the risks of overexposure in volatile commodities.
17.2 –The Amaranth Collapse: A Cautionary Tale in Natural Gas Trading

In the early 2000s, Amaranth Advisors emerged as a rising star in the hedge fund world. Based in Greenwich, Connecticut, the fund operated across multiple strategies—ranging from convertible arbitrage and merger plays to leveraged assets and energy trading. By mid-2006, Amaranth had grown into a $9 billion powerhouse, thanks in part to aggressive reinvestment of profits and a string of successful trades.
The fund’s energy desk gained prominence when Brian Hunter, a celebrated natural gas trader formerly with Deutsche Bank, joined the team. Known for his bold directional bets and deep understanding of energy markets, Hunter had already earned millions in bonuses and a reputation for delivering out-sized returns. At Amaranth, his winning streak continued. By April 2006, the fund had reportedly booked $2 billion in profits, largely driven by Hunter’s natural gas positions. Investors and management alike were captivated by his performance.
But beneath the surface, the strategy was becoming increasingly risky.
The Setup: A High-Stakes Bet on Weather and Supply
Natural gas, though globally traded, is regionally priced and logistically constrained. Unlike crude oil, it cannot be easily transported across continents to balance supply-demand mismatches. This makes it highly sensitive to inventory levels, weather forecasts, and seasonal demand.
Hunter believed that U.S. gas inventories were building up, which would normally push prices lower. However, he also anticipated a harsh winter or a hurricane event—similar to Hurricanes Katrina and Rita in 2005—that could disrupt supply and send prices soaring. Confident in his outlook, he constructed a complex web of leveraged futures positions across multiple expiries, designed to profit from both short-term dips and long-term spikes.
The Unravelling: When Nature Defies the Trade
Unfortunately for Amaranth, the weather didn’t cooperate. The anticipated hurricanes never materialized, and the winter turned out to be milder than expected. Meanwhile, natural gas supplies remained robust, and prices began to slide.
As the market broke below the psychological support level of $5.50, panic set in. Long positions began to unwind, triggering a 20% single-day drop in natural gas prices. Amaranth’s positions, heavily exposed and highly leveraged, took a massive hit.
Still confident in his thesis, Hunter doubled down. The fund borrowed aggressively, leveraging up to 8 times its capital in an attempt to recover losses. But the market continued to fall, and the pressure became unbearable. By September 2006, Amaranth was forced to liquidate, incurring losses of over $6 billion—one of the largest hedge fund collapses in financial history.
The Lesson: Risk Management Above All
The Amaranth episode is a stark reminder that no amount of conviction can substitute for sound risk management. Even the most sophisticated strategies, backed by experience and data, can unravel in the face of unpredictable variables, especially in volatile markets like natural gas.
The core takeaway is simple but profound: leverage magnifies both gains and losses, and without strict risk controls, even a single miscalculation can be catastrophic. Risk management isn’t just a safety net, it’s the foundation of long-term survival in trading.
As we move forward, the next module will focus entirely on risk and trading psychology, exploring how to build discipline, manage exposure, and develop resilience in the face of uncertainty.
17.3 Natural Gas Futures: Contract Structure and Global Influences

Varun: Isha, I’m curious—how does the natural gas contract work on MCX?
Isha: It’s quoted in ₹ per mmBtu, with a lot size of 1,250 mmBtu. Each tick is ₹0.10, so that’s ₹125 per tick.
Varun: And what drives the price?
Isha: Mostly global factors—US weather, inventory data, hurricanes, and even crude oil trends. The MCX contract closely tracks NYMEX Henry Hub futures.
Varun: So checking US weather is part of the strategy?
Isha: Absolutely. Before trading, look at EIA reports, storm alerts, and seasonal forecasts. Natural gas reacts fast to global cues.
Understanding the MCX Natural Gas Contract
Natural Gas is one of the most actively traded energy contracts on MCX, offering high liquidity and sharp intraday movements. The contract is designed to mirror global benchmarks—especially the NYMEX Henry Hub futures—while being settled in Indian rupees.
Here are the latest specifications for the Natural Gas Futures contract on MCX (October 2025):
|
Parameter |
Specification |
|
Price Quote |
₹ per Million British Thermal Unit (mmBtu) |
|
Lot Size |
1,250 mmBtu |
|
Tick Size |
₹0.10 |
|
P&L per Tick |
₹125 |
|
Expiry Date |
25th of every month |
|
Delivery Unit |
10,000 mmBtu |
|
Delivery Location |
Hazira, Gujarat |
As of October 2025, the November contract is trading around ₹218.60/mmBtu, making the contract value:
The NRML margin required is approximately ₹41,000, which is about 15% of the contract value. The MIS margin (for intraday trades) is around ₹20,500, or 7.5%. These margin levels reflect the contract’s volatility and global sensitivity.
Contract Lifecycle and Introduction Logic

MCX introduces a new Natural Gas contract every month, with a four-month forward cycle. For example, in October 2025, the February 2026 contract is introduced. Each contract expires on the 25th of the month, regardless of the day of the week.
This structure allows traders to choose between near-month contracts for liquidity or far-month contracts for strategic positioning.
Global Correlation: MCX vs NYMEX
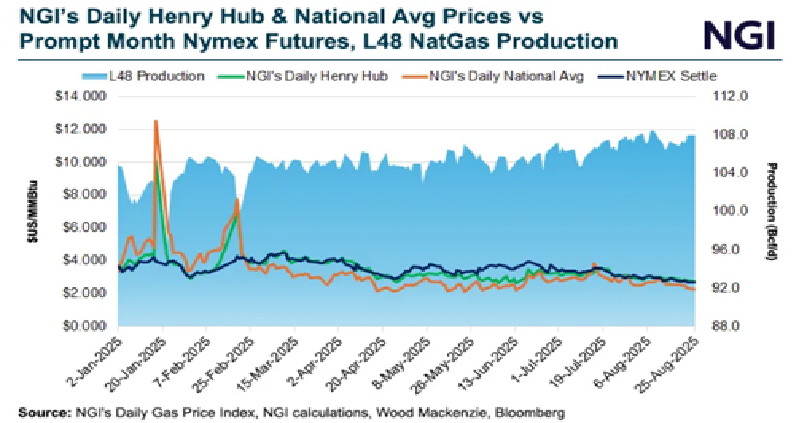
Although Natural Gas is a global commodity, its Indian futures price is influenced by both domestic and international factors. The MCX contract closely tracks the NYMEX Henry Hub benchmark, as shown in the chart below:
As evident, both contracts move in tandem, reacting to global inventory data, weather forecasts, and geopolitical developments.

Key Drivers of Price Movement
Several global events influence Natural Gas prices on NYMEX—and by extension, MCX:
- US Inventory Reports:Weekly data from the EIA shows how much gas is stored. A rise in inventory typically pushes prices down, while a drawdown signals higher demand and lifts prices.
- US Weather Conditions: The US is the largest consumer of natural gas. A harsh winter increases heating demand, depletes inventory, and drives prices higher. Conversely, mild weather suppresses demand.
- Hurricane Activity: Hurricanes in the Gulf of Mexico can disrupt production and supply chains. If a storm approaches, traders often go long in anticipation of supply shocks.
- Crude Oil Prices:Natural Gas is a cleaner and cheaper alternative to crude. Historically, the two have shown strong correlation, although recent months have seen divergence due to LNG exports and regional demand shifts.
Watch the Weather—Literally
Before placing trades in Natural Gas, it’s wise to check US weather forecasts, inventory updates, and storm alerts. These factors often precede major price moves. For example, in September 2025, a mild hurricane season and strong inventory buildup kept prices below ₹220/mmBtu despite rising crude oil prices.
17.4 Key Takeaways

- Natural gas is a clean-burning fossil fuel, used in power generation, heating, and industrial applications.
- It has a rich history, from ancient Greece to modern shale extraction via fracking and horizontal drilling.
- India is the 7th largest producer, with key fields in Assam, Gujarat, and the Krishna-Godavari Basin.
- Natural gas is highly volatile, influenced by weather, storage data, and geopolitical events.
- The Amaranth Advisors collapse is a cautionary tale, showing how leverage and poor risk management can destroy a fund.
- MCX natural gas contracts are quoted in ₹ per mmBtu, with a lot size of 1,250 mmBtu and ₹125 per tick.
- Margins are around 15% for NRML and 7.5% for MIS, reflecting the contract’s volatility.
- MCX prices closely track NYMEX Henry Hub futures, making global data essential for Indian traders.
- Key price drivers include US inventory reports, weather forecasts, hurricanes, and crude oil trends.
- Successful trading requires monitoring global cues, especially US winter forecasts and EIA inventory updates.
17.5 Fun Activity

You’re planning to trade one lot of Natural Gas Futures on MCX.
Market Snapshot:
- Lot Size: 1,250 mmBtu
- Current Price: ₹218.60/mmBtu
- Tick Size: ₹0.10
- NRML Margin: 15%
- MIS Margin: 7.5%
Questions:
- What is the contract value?
- What is the NRML margin required?
- What is the MIS margin required?
- If the price moves up by ₹0.80, what is your profit?
- If the price drops by ₹0.40, what is your loss?
Answers:
- Contract Value = ₹218.60 × 1,250 = ₹2,73,250
- NRML Margin = 15% × ₹2,73,250 = ₹40,987.50
- MIS Margin = 7.5% × ₹2,73,250 = ₹20,493.75
- Profit = ₹0.80 × 1,250 = ₹1,000
- Loss = ₹0.40 × 1,250 = ₹500
17.1 Natural Gas: Origins, Evolution, and Exploration
Varun: Isha, we’ve covered crude oil, but I keep hearing that natural gas is just as important. What makes it different?
Isha: Great question. Natural gas is cleaner than oil and coal, and it’s used for power, heating, cooking—even fertilizers. It’s mostly methane and burns with fewer emissions.
Varun: So it’s part of the energy transition?
Isha: Exactly. Plus, it has a fascinating history—from ancient Greek temples to bamboo pipelines in China. Today, it’s a global commodity with India playing a growing role.
Varun: And it’s traded on MCX too?
Isha: Yes, and it’s one of the most volatile energy contracts. Weather, storage data, and global demand all impact its price.
A Late but Essential Chapter
Natural Gas might be arriving late in this module, but its importance in the global energy and commodities landscape makes it an essential topic—especially for traders. While we’ve already explored crude oil, natural gas deserves its own spotlight due to its unique market behaviour, industrial relevance, and growing role in the energy transition.
What Is Natural Gas?
Natural gas is a naturally occurring hydrocarbon gas, primarily composed of methane (CH₄). It is a non-renewable fossil fuel, formed deep within the Earth over millions of years. Known for its clean-burning properties, natural gas is widely used for electricity generation, residential heating, cooking, and as a feed-stock in fertilizers and petrochemicals. Its versatility and relatively lower carbon emissions compared to coal and oil have made it a key player in the global shift toward cleaner energy.
A Glimpse into the Past
The story of natural gas begins in antiquity. Around 1000 B.C., natural gas seeped from the Earth’s crust on Mount Parnassus in ancient Greece and ignited spontaneously. The Greeks believed this eternal flame was divine and built the Temple of Apollo at Delphi around it, possibly the earliest recorded encounter with natural gas.
By 500 B.C., the Chinese had discovered natural gas seeps and began using bamboo pipelines to transport it. They ingeniously used the gas to boil seawater, producing potable water—an early example of industrial application.
Fast forward to 1785, and Great Britain became the first country to commercially use natural gas, derived from coal, to light street lamps and lighthouses. This marked the beginning of natural gas as a utility.
How Natural Gas Is Formed
Natural gas originates from the decomposition of ancient organic matter, plants and marine organisms, that was buried under layers of sediment. Over millions of years, heat and pressure transformed this material into coal, crude oil, and natural gas. The gas either migrated into porous rock formations or became trapped in shale layers, forming reservoirs.
In its raw form, natural gas is colourless, odourless, and tasteless, which poses a serious safety risk. To make leaks detectable, producers add mercaptan, a compound with a strong sulphur-like odour, making it easier to identify gas leaks before they become hazardous.
Exploration and Extraction
The process of locating natural gas is similar to oil exploration. Geologists conduct seismic surveys—both onshore and offshore—to identify potential reserves. If the data is promising, an exploratory well is drilled. If viable quantities are found and the economics are favorable, production wells are established.
Modern extraction techniques like hydraulic fracturing (fracking) and horizontal drilling have unlocked vast reserves, especially in shale formations. These technologies have transformed countries like the United States into net exporters of natural gas.
India’s Role in the Global Gas Market
India ranks as the 7th largest producer of natural gas, contributing around 2.5% of global output. Major production zones include Assam, Gujarat, Andhra Pradesh, and offshore fields in the Krishna-Godavari Basin. A significant portion of India’s gas is used for power generation, industrial heating, LPG blending, and as a feed-stock in the fertilizer sector.
A recent milestone is the KG-DWN-98/2 deep-water project operated by ONGC, which is expected to produce 15 million standard cubic meters per day at peak. This project is part of India’s broader strategy to reduce LNG imports and enhance energy security.
Natural Gas in the Trading World
For traders, natural gas is one of the most volatile energy contracts. Prices are influenced by a range of factors including:
- Weather patterns, especially winter demand in North America and Europe.
- Storage data from the U.S. Energy Information Administration (EIA).
- Geopolitical tensions affecting supply chains.
- Currency fluctuations, particularly USD-INR for Indian traders.
- Industrial and export demand, especially from sectors like fertilizers and chemicals.
A Notable Market Event: The Amaranth Advisors Collapse
No discussion on natural gas trading is complete without mentioning the infamous Amaranth Advisors collapse in 2006. The hedge fund lost over $6 billion in a matter of weeks due to highly leveraged bets on natural gas futures. The fund’s trader, Brian Hunter, had taken massive positions expecting prices to rise, but a sudden shift in weather forecasts and market sentiment led to catastrophic losses. This event remains one of the largest hedge fund failures in history and serves as a cautionary tale about the risks of overexposure in volatile commodities.
17.2 –The Amaranth Collapse: A Cautionary Tale in Natural Gas Trading
In the early 2000s, Amaranth Advisors emerged as a rising star in the hedge fund world. Based in Greenwich, Connecticut, the fund operated across multiple strategies—ranging from convertible arbitrage and merger plays to leveraged assets and energy trading. By mid-2006, Amaranth had grown into a $9 billion powerhouse, thanks in part to aggressive reinvestment of profits and a string of successful trades.
The fund’s energy desk gained prominence when Brian Hunter, a celebrated natural gas trader formerly with Deutsche Bank, joined the team. Known for his bold directional bets and deep understanding of energy markets, Hunter had already earned millions in bonuses and a reputation for delivering out-sized returns. At Amaranth, his winning streak continued. By April 2006, the fund had reportedly booked $2 billion in profits, largely driven by Hunter’s natural gas positions. Investors and management alike were captivated by his performance.
But beneath the surface, the strategy was becoming increasingly risky.
The Setup: A High-Stakes Bet on Weather and Supply
Natural gas, though globally traded, is regionally priced and logistically constrained. Unlike crude oil, it cannot be easily transported across continents to balance supply-demand mismatches. This makes it highly sensitive to inventory levels, weather forecasts, and seasonal demand.
Hunter believed that U.S. gas inventories were building up, which would normally push prices lower. However, he also anticipated a harsh winter or a hurricane event—similar to Hurricanes Katrina and Rita in 2005—that could disrupt supply and send prices soaring. Confident in his outlook, he constructed a complex web of leveraged futures positions across multiple expiries, designed to profit from both short-term dips and long-term spikes.
The Unravelling: When Nature Defies the Trade
Unfortunately for Amaranth, the weather didn’t cooperate. The anticipated hurricanes never materialized, and the winter turned out to be milder than expected. Meanwhile, natural gas supplies remained robust, and prices began to slide.
As the market broke below the psychological support level of $5.50, panic set in. Long positions began to unwind, triggering a 20% single-day drop in natural gas prices. Amaranth’s positions, heavily exposed and highly leveraged, took a massive hit.
Still confident in his thesis, Hunter doubled down. The fund borrowed aggressively, leveraging up to 8 times its capital in an attempt to recover losses. But the market continued to fall, and the pressure became unbearable. By September 2006, Amaranth was forced to liquidate, incurring losses of over $6 billion—one of the largest hedge fund collapses in financial history.
The Lesson: Risk Management Above All
The Amaranth episode is a stark reminder that no amount of conviction can substitute for sound risk management. Even the most sophisticated strategies, backed by experience and data, can unravel in the face of unpredictable variables, especially in volatile markets like natural gas.
The core takeaway is simple but profound: leverage magnifies both gains and losses, and without strict risk controls, even a single miscalculation can be catastrophic. Risk management isn’t just a safety net, it’s the foundation of long-term survival in trading.
As we move forward, the next module will focus entirely on risk and trading psychology, exploring how to build discipline, manage exposure, and develop resilience in the face of uncertainty.
17.3 Natural Gas Futures: Contract Structure and Global Influences
Varun: Isha, I’m curious—how does the natural gas contract work on MCX?
Isha: It’s quoted in ₹ per mmBtu, with a lot size of 1,250 mmBtu. Each tick is ₹0.10, so that’s ₹125 per tick.
Varun: And what drives the price?
Isha: Mostly global factors—US weather, inventory data, hurricanes, and even crude oil trends. The MCX contract closely tracks NYMEX Henry Hub futures.
Varun: So checking US weather is part of the strategy?
Isha: Absolutely. Before trading, look at EIA reports, storm alerts, and seasonal forecasts. Natural gas reacts fast to global cues.
Understanding the MCX Natural Gas Contract
Natural Gas is one of the most actively traded energy contracts on MCX, offering high liquidity and sharp intraday movements. The contract is designed to mirror global benchmarks—especially the NYMEX Henry Hub futures—while being settled in Indian rupees.
Here are the latest specifications for the Natural Gas Futures contract on MCX (October 2025):
|
Parameter |
Specification |
|
Price Quote |
₹ per Million British Thermal Unit (mmBtu) |
|
Lot Size |
1,250 mmBtu |
|
Tick Size |
₹0.10 |
|
P&L per Tick |
₹125 |
|
Expiry Date |
25th of every month |
|
Delivery Unit |
10,000 mmBtu |
|
Delivery Location |
Hazira, Gujarat |
As of October 2025, the November contract is trading around ₹218.60/mmBtu, making the contract value:
The NRML margin required is approximately ₹41,000, which is about 15% of the contract value. The MIS margin (for intraday trades) is around ₹20,500, or 7.5%. These margin levels reflect the contract’s volatility and global sensitivity.
Contract Lifecycle and Introduction Logic
MCX introduces a new Natural Gas contract every month, with a four-month forward cycle. For example, in October 2025, the February 2026 contract is introduced. Each contract expires on the 25th of the month, regardless of the day of the week.
This structure allows traders to choose between near-month contracts for liquidity or far-month contracts for strategic positioning.
Global Correlation: MCX vs NYMEX
Although Natural Gas is a global commodity, its Indian futures price is influenced by both domestic and international factors. The MCX contract closely tracks the NYMEX Henry Hub benchmark, as shown in the chart below:
As evident, both contracts move in tandem, reacting to global inventory data, weather forecasts, and geopolitical developments.
Key Drivers of Price Movement
Several global events influence Natural Gas prices on NYMEX—and by extension, MCX:
- US Inventory Reports:Weekly data from the EIA shows how much gas is stored. A rise in inventory typically pushes prices down, while a drawdown signals higher demand and lifts prices.
- US Weather Conditions: The US is the largest consumer of natural gas. A harsh winter increases heating demand, depletes inventory, and drives prices higher. Conversely, mild weather suppresses demand.
- Hurricane Activity: Hurricanes in the Gulf of Mexico can disrupt production and supply chains. If a storm approaches, traders often go long in anticipation of supply shocks.
- Crude Oil Prices:Natural Gas is a cleaner and cheaper alternative to crude. Historically, the two have shown strong correlation, although recent months have seen divergence due to LNG exports and regional demand shifts.
Watch the Weather—Literally
Before placing trades in Natural Gas, it’s wise to check US weather forecasts, inventory updates, and storm alerts. These factors often precede major price moves. For example, in September 2025, a mild hurricane season and strong inventory buildup kept prices below ₹220/mmBtu despite rising crude oil prices.
17.4 Key Takeaways
- Natural gas is a clean-burning fossil fuel, used in power generation, heating, and industrial applications.
- It has a rich history, from ancient Greece to modern shale extraction via fracking and horizontal drilling.
- India is the 7th largest producer, with key fields in Assam, Gujarat, and the Krishna-Godavari Basin.
- Natural gas is highly volatile, influenced by weather, storage data, and geopolitical events.
- The Amaranth Advisors collapse is a cautionary tale, showing how leverage and poor risk management can destroy a fund.
- MCX natural gas contracts are quoted in ₹ per mmBtu, with a lot size of 1,250 mmBtu and ₹125 per tick.
- Margins are around 15% for NRML and 7.5% for MIS, reflecting the contract’s volatility.
- MCX prices closely track NYMEX Henry Hub futures, making global data essential for Indian traders.
- Key price drivers include US inventory reports, weather forecasts, hurricanes, and crude oil trends.
- Successful trading requires monitoring global cues, especially US winter forecasts and EIA inventory updates.
17.5 Fun Activity
You’re planning to trade one lot of Natural Gas Futures on MCX.
Market Snapshot:
- Lot Size: 1,250 mmBtu
- Current Price: ₹218.60/mmBtu
- Tick Size: ₹0.10
- NRML Margin: 15%
- MIS Margin: 7.5%
Questions:
- What is the contract value?
- What is the NRML margin required?
- What is the MIS margin required?
- If the price moves up by ₹0.80, what is your profit?
- If the price drops by ₹0.40, what is your loss?
Answers:
- Contract Value = ₹218.60 × 1,250 = ₹2,73,250
- NRML Margin = 15% × ₹2,73,250 = ₹40,987.50
- MIS Margin = 7.5% × ₹2,73,250 = ₹20,493.75
- Profit = ₹0.80 × 1,250 = ₹1,000
- Loss = ₹0.40 × 1,250 = ₹500