7.1 परिचय

चार्ट में हमेशा कहानी होती है. हालांकि, समय-समय पर वे चार्ट ऐसी भाषा बोल सकते हैं जो आपको नहीं समझती है और आपको व्याख्यापक से कुछ मदद की आवश्यकता हो सकती है. टेक्निकल इंडिकेटर मार्केट के इंटरप्रेटर हैं. वे कीमत की जानकारी देखते हैं और इसे आसान, पढ़ने में आसान सिग्नल में बदलते हैं, जो आपको यह निर्धारित करने में मदद कर सकते हैं कि स्टॉक कब खरीदना है और कब बेचना है.
तकनीकी संकेतक गणितीय समीकरणों पर आधारित होते हैं जो एक मूल्य उत्पन्न करते हैं जो फिर आपके चार्ट पर प्लॉट किया जाता है. उदाहरण के लिए, मूविंग एवरेज पिछले स्टॉक की औसत कीमत की गणना करता है और आपके चार्ट पर एक पॉइंट प्लॉट करता है. जैसा कि आपका स्टॉक चार्ट आगे बढ़ता है, मूविंग एवरेज प्लॉट्स न्यू पॉइंट्स, अपडेटेड प्राइस जानकारी के आधार पर. अंत में, मूविंग एवरेज आपको एक आसान संकेत देता है कि किस डायरेक्शन स्टॉक मूविंग कर रहा है.
प्रत्येक टेक्निकल इंडिकेटर विशिष्ट जानकारी प्रदान करता है. आपको पता चलेगा कि आपकी ट्रेडिंग व्यक्तित्व के आधार पर स्वाभाविक रूप से विशिष्ट तकनीकी संकेतकों की ओर आकर्षित होते हैं, लेकिन आपके पास सभी तकनीकी संकेतकों से परिचित होना महत्वपूर्ण है. टेक्निकल इंडिकेटर से जुड़ी एक कमजोरी के बारे में भी जानकारी होनी चाहिए: क्योंकि टेक्निकल इंडिकेटर ऐतिहासिक प्राइस डेटा को देखते हैं, इसलिए उन्हें भविष्य के बारे में कुछ भी निश्चित जानने की गारंटी नहीं दी जाती है.
तकनीकी संकेतकों को निम्न श्रेणी में विभाजित किया जाता है:
- ट्रेंडिंग इंडिकेटर
- ऑस्सिलेटिंग इंडिकेटर
ट्रेंडिंग इंडिकेटर
ट्रेंडिंग इंडिकेटर, जैसा कि उनके नाम से पता चलता है, करेंसी पेयर के ट्रेंड की पहचान करें और फॉलो करें. फॉरेक्स ट्रेडर करेंसी पेयर ट्रेंडिंग होने पर अपना अधिकतर पैसा कमाते हैं. इसलिए, आपके लिए यह निर्धारित करना महत्वपूर्ण है कि करंसी पेयर कब ट्रेंडिंग है और जब यह समेकित हो रहा है. अगर आप ट्रेंड शुरू होने के तुरंत बाद अपने ट्रेड दर्ज कर सकते हैं और ट्रेंड समाप्त होने के तुरंत बाद बाहर निकल सकते हैं, तो आप काफी सफल होंगे.
आइए निम्नलिखित ट्रेंडिंग इंडिकेटर पर एक नज़र डालें:
- मूविंग एवरेज
- बोलिंगर बैंड्स
7.2. मूविंग एवरेज

जैसा कि बताया गया है, ये सबसे बेसिक ट्रेंडिंग इंडिकेटर हैं. वे आपको दिखाते हैं कि स्टॉक की दिशा क्या हो रही है और जहां समर्थन और प्रतिरोध के संभावित स्तर हो सकते हैं-मूविंग एवरेज स्वयं सहायता और प्रतिरोध दोनों के रूप में काम कर सकते हैं.
मूविंग एवरेज ट्रेडिंग सिग्नल - मूविंग एवरेज ट्रेंडिंग करंसी पेयर के लिए उपयोगी ट्रेडिंग सिग्नल प्रदान करता है.
- एंट्री सिग्नल-जब अप-ट्रेंडिंग मूविंग एवरेज को हिट करने के बाद अप-ट्रेंडिंग करेंसी पेयर बैकअप हो जाता है, या जब डाउन-ट्रेंडिंग मूविंग एवरेज को हिट करने के बाद डाउन-ट्रेंडिंग करेंसी पेयर बाउंस हो जाता है.
- एक्जिट सिग्नल-जब आप अप-ट्रेंडिंग स्टॉक पर ट्रेड करते हैं, तो मूविंग एवरेज से कम स्टॉप लॉस सेट करें. जब मूविंग एवरेज बढ़ता है, तो अपने स्टॉप लॉस को मूविंग एवरेज के साथ ऊपर ले जाएं.
अगर स्टॉक कभी भी मूविंग एवरेज से कहीं कम टूट जाता है, तो आपका स्टॉप लॉस आपको अपने ट्रेड से बाहर ले जाएगा. जब आप डाउन-ट्रेंडिंग स्टॉक पर ट्रेड करते हैं, तो मूविंग एवरेज से ऊपर स्टॉप लॉस सेट करें. जब मूविंग एवरेज गिरता है, तो मूविंग एवरेज के साथ अपने स्टॉप लॉस को नीचे ले जाएं. अगर स्टॉक कभी भी मूविंग एवरेज से काफी अधिक टूट जाता है, तो आपका स्टॉप लॉस आपको अपने ट्रेड से बाहर ले जाएगा.
7.3 बॉलिंगर बैंड

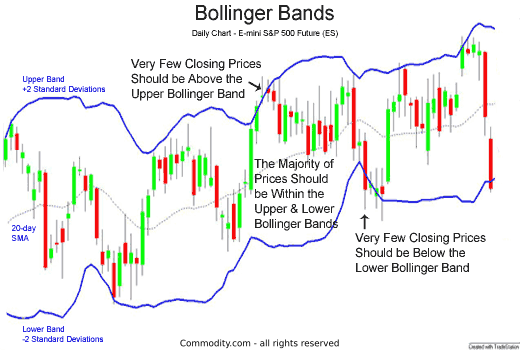
जॉन बोलिंगर द्वारा बनाए गए बोलिंगर बैंड, एक ट्रेंडिंग इंडिकेटर हैं, जो आपको न केवल एक करेंसी पेयर की दिशा क्या है, बल्कि स्टॉक की अस्थिर प्राइस मूवमेंट भी दिखा सकता है. बोलिंगर बैंड में दो बैंड होते हैं- एक ऊपरी बैंड और एक निम्न बैंड- और एक मूविंग एवरेज और आमतौर पर चार्ट के प्राइस मूवमेंट के शीर्ष पर प्लॉट किए जाते हैं.
बोलिंगर बैंड कैसे बनाए जाते हैं
बोलिंगर बैंड आमतौर पर 20-अवधि के मूविंग एवरेज पर आधारित होते हैं. यह मूविंग एवरेज दो बैंड के बीच में चलती है. ऊपरी बैंड को 20-पीरियड मूविंग एवरेज से ऊपर दो स्टैंडर्ड डेविएशन प्लॉट किया गया है. लोअर बैंड को 20- पीरियड मूविंग एवरेज से नीचे दो स्टैंडर्ड डेविएशन की योजना बनाई जाती है.
स्टैंडर्ड डेविएशन एक सांख्यिकीय शब्द है जो यह मापता है कि विभिन्न क्लोजिंग प्राइस औसत क्लोजिंग प्राइस से कितने अलग होते हैं. इसलिए 20-पीरियड बॉलिंगर बैंड आपको बताते हैं कि पिछले 20 अवधियों के दौरान क्लोजिंग प्राइस की रेंज कितनी चौड़ी या अस्थिर है. अधिक अस्थिर स्टॉक, व्यापक बैंड होंगे. कम अस्थिर स्टॉक, संकीर्ण बैंड होंगे.
7.4 मार्केट के उतार-चढ़ाव को मापना इतना महत्वपूर्ण क्यों है

एक के लिए, अस्थिर मार्केट बिना अधिक गतिविधि वाले मार्केट की तुलना में अधिक ट्रेडिंग के अवसर प्रदान करते हैं. अधिक महत्वपूर्ण बात यह है कि उतार-चढ़ाव अक्सर मार्केट की दिशा का अनुमान लगा सकता है और यह इसकी परफॉर्मेंस का माप है.
2011 में, क्रेस्टमोंट रिसर्च ने अस्थिरता और मार्केट परफॉर्मेंस के बीच ऐतिहासिक संबंधों का अध्ययन किया. इसके विश्लेषण के लिए, क्रेसमोंट ने प्रत्येक दिन के लिए औसत रेंज का उपयोग करके एस एंड पी 500 की अस्थिरता को मापा. अध्ययन के अंत में, उन्होंने निष्कर्ष निकाला कि उच्च अस्थिरता डाउनवर्ड ट्रेंडिंग मार्केट की उच्च संभावना का संकेत देती है. इसकी तुलना में, कम अस्थिरता बढ़ती मार्केट की उच्च संभावना का संकेत देती है.
अब बोलिंगर बैंड की गणना को समझने के लिए एक उदाहरण लें:
उदाहरण के लिए, ब्रिटानिया के शेयर, अगर 20 दिन का SMA 3600 है, और SD 75 (या 0.96%) है, तो +2 SD 3600 + (75*2) = 3750 होगा. इसी प्रकार, एक -2 SD से पता चलता है कि हम SD को 2 से गुणा करते हैं और इसे औसत से घटाते हैं. 3600 – (2*75) = 3450.
अब हमारे पास बीबी के घटक हैं:
20 दिन एसएमए = 3600
ऊपरी बैंड = 3450
लोअर बैंड = 3750
सांख्यिकीय रूप से, वर्तमान मार्केट की कीमत 3600 की औसत कीमत के आसपास होनी चाहिए. हालांकि, अगर वर्तमान मार्केट की कीमत लगभग 3650 है, तो इसे औसत के हिसाब से महंगा माना जाता है. इसलिए आपको इस उम्मीद के साथ शॉर्टिंग अवसरों पर विचार करना चाहिए कि कीमत अपने औसत मूल्य तक वापस बढ़ जाएगी.
इसलिए 3600 के लक्ष्य के साथ ट्रेड 3650 पर बेचा जाएगा.
इसी प्रकार, अगर वर्तमान मार्केट प्राइस लगभग 3450 है, तो इसे औसत कीमतों के अनुसार सस्ता माना जाता है. इसलिए, आपको यह उम्मीद करने के लिए खरीदने के अवसरों पर विचार करना चाहिए कि कीमतें अपनी औसत कीमत तक वापस बढ़ जाएंगी.
इसलिए 3600 के लक्ष्य के साथ 3450 पर ट्रेड खरीदना होगा. ऊपरी और निचले बैंड एक ट्रेड शुरू करने के लिए एक ट्रिगर के रूप में कार्य करते हैं.
बॉलिंगर बैंड ट्रेडिंग सिग्नल
बॉलिंगर बैंड उन स्टॉक के लिए उपयोगी ब्रेकआउट सिग्नल प्रदान करते हैं जो समेकित कर रहे हैं.
- एंट्री सिग्नल - जब बैंड चौड़े होते हैं और समेकन की अवधि के बाद विपरीत दिशाओं में चलना शुरू करते हैं, तो आप उस दिशा में ट्रेड में प्रवेश कर सकते हैं जब बैंड चौड़ा होने लगे थे.
- एक्जिट सिग्नल - जब बैंड स्टॉक की कीमत को ब्रेकआउट टर्न से घटा देता है और स्टॉक की वर्तमान कीमत की ओर वापस जाना शुरू करता है, तो ट्रेंड रिवर्स होने पर आपको ट्रेड से बाहर ले जाने के लिए ट्रेलिंग स्टॉप लॉस सेट करें.


