
24.1 Blueprint for Portfolio Construction

Achieving long-term financial independence requires transforming personal financial goals into actionable investment strategies. Mutual funds serve as the ideal vehicle for retail investors, bridging personal targets—such as building a ₹40 lakh higher education fund over a 15-year horizon—with professional market management.
Constructing a goal-aligned portfolio relies on three core operational phases:
- Target Formulation:Translating life goals into specific required timelines and inflation-adjusted terminal values.
- Selection & Allocation:Conducting thorough fund research and allocating capital across equity and debt options.
- Portfolio Maintenance:Performing structured, periodic performance and risk reviews.
While establishing goals is straightforward, evaluating individual equity schemes requires a systematic framework to filter out underperforming funds.
24.2 Baseline Health Audit

The initial evaluation phase focuses on baseline structural details accessible via factsheets.
- Operating Track Record:Prioritize schemes with extended histories across multiple market cycles. Evaluating the Kotak Flexicap Fund (launched in September 2009 as Kotak Select Focus Fund, later renamed Kotak Standard Multicap Fund) provides over 15 years of continuous operational data.
- Appropriate Benchmarking: Ensure the scheme measures itself against a realistic universe. A flexible, multi-cap style strategy should be evaluated against broad market indices like the Nifty 500 TRI (Kotak Flexicap’s current benchmark) or BSE 500 TRI rather than narrow large-cap indices like the Nifty 50.
- Relative AUM & Flagship Priority: Evaluate Assets Under Management relative to the Asset Management Company (AMC). For instance, Kotak Flexicap Fund manages about ₹56,400 crore (September 2026), making it one of Kotak AMC’s largest equity schemes. This signals a “flagship” offering that the AMC is incentivized to manage prudently.
- Asset Growth Trajectory: Gradual asset growth reflects healthy investor confidence. Conversely, abrupt liquidity surges from heavy marketing campaigns can strain portfolio deployment agility.
- Cost Structure Impact: Always select Direct Plans. Choosing a Direct plan (e.g., ~0.66% TER for Kotak Flexicap’s Direct plan in 2026) over a Regular plan (typically around 0.8–1 percentage point costlier) prevents persistent fee drag on long-term compound growth.
- Avoiding Portfolio Nitpicking: Refrain from micromanaging individual stock choices within the portfolio. Evaluating active managers on micro-allocations overlooks their primary role: overall risk control and macro execution.
24.3 Rolling Returns Analysis
How consistent has the fund been?
A fund’s 1-year or 3-year return can look very good or very bad depending on which dates you pick. A better approach is to check its returns over every possible 3-, 5- and 10-year period. These are called rolling returns, and they show how reliably the fund has performed over time, not just on one lucky or unlucky date.
| Holding period | Fund’s average return | Index’s average return (Nifty 200 TRI) | Fund’s worst to best return | What it means |
|---|---|---|---|---|
| 3 years | 15.20% | 9.87% | -5.19% to +31.20% | The fund usually beat the index, but over short periods returns swung widely and were sometimes negative. |
| 5 years | 16.51% | 10.46% | +1.18% to +25.09% | Investors who held for 5 years never lost money. The index’s worst 5-year return was -2.28%. |
| 10 years | 12.07% | 7.48% | +8.59% to +14.56% | Over 10 years, returns were steady and always well above the index. |
Key takeaways
- The longer you stay invested, the more predictable your returns. The gap between the worst and best outcomes shrinks sharply from 3 to 10 years.
- The fund has beaten its index on average in every holding period. However, it may have taken somewhat more risk to do so, so higher returns aren’t the full story.
- The fund’s lead over the index has been shrinking lately. This could be because the fund has grown very large or because market conditions have changed. It’s worth watching.
24.4 Risk–Reward Efficiency Assessment
Evaluating returns without adjusting for risk presents an incomplete picture. Active management is justified when a fund delivers market-matching returns at reduced volatility, or superior returns at equivalent risk.
Analyzing a 5-Year Volatility (Standard Deviation on X-axis) versus Return (Y-axis) plot:
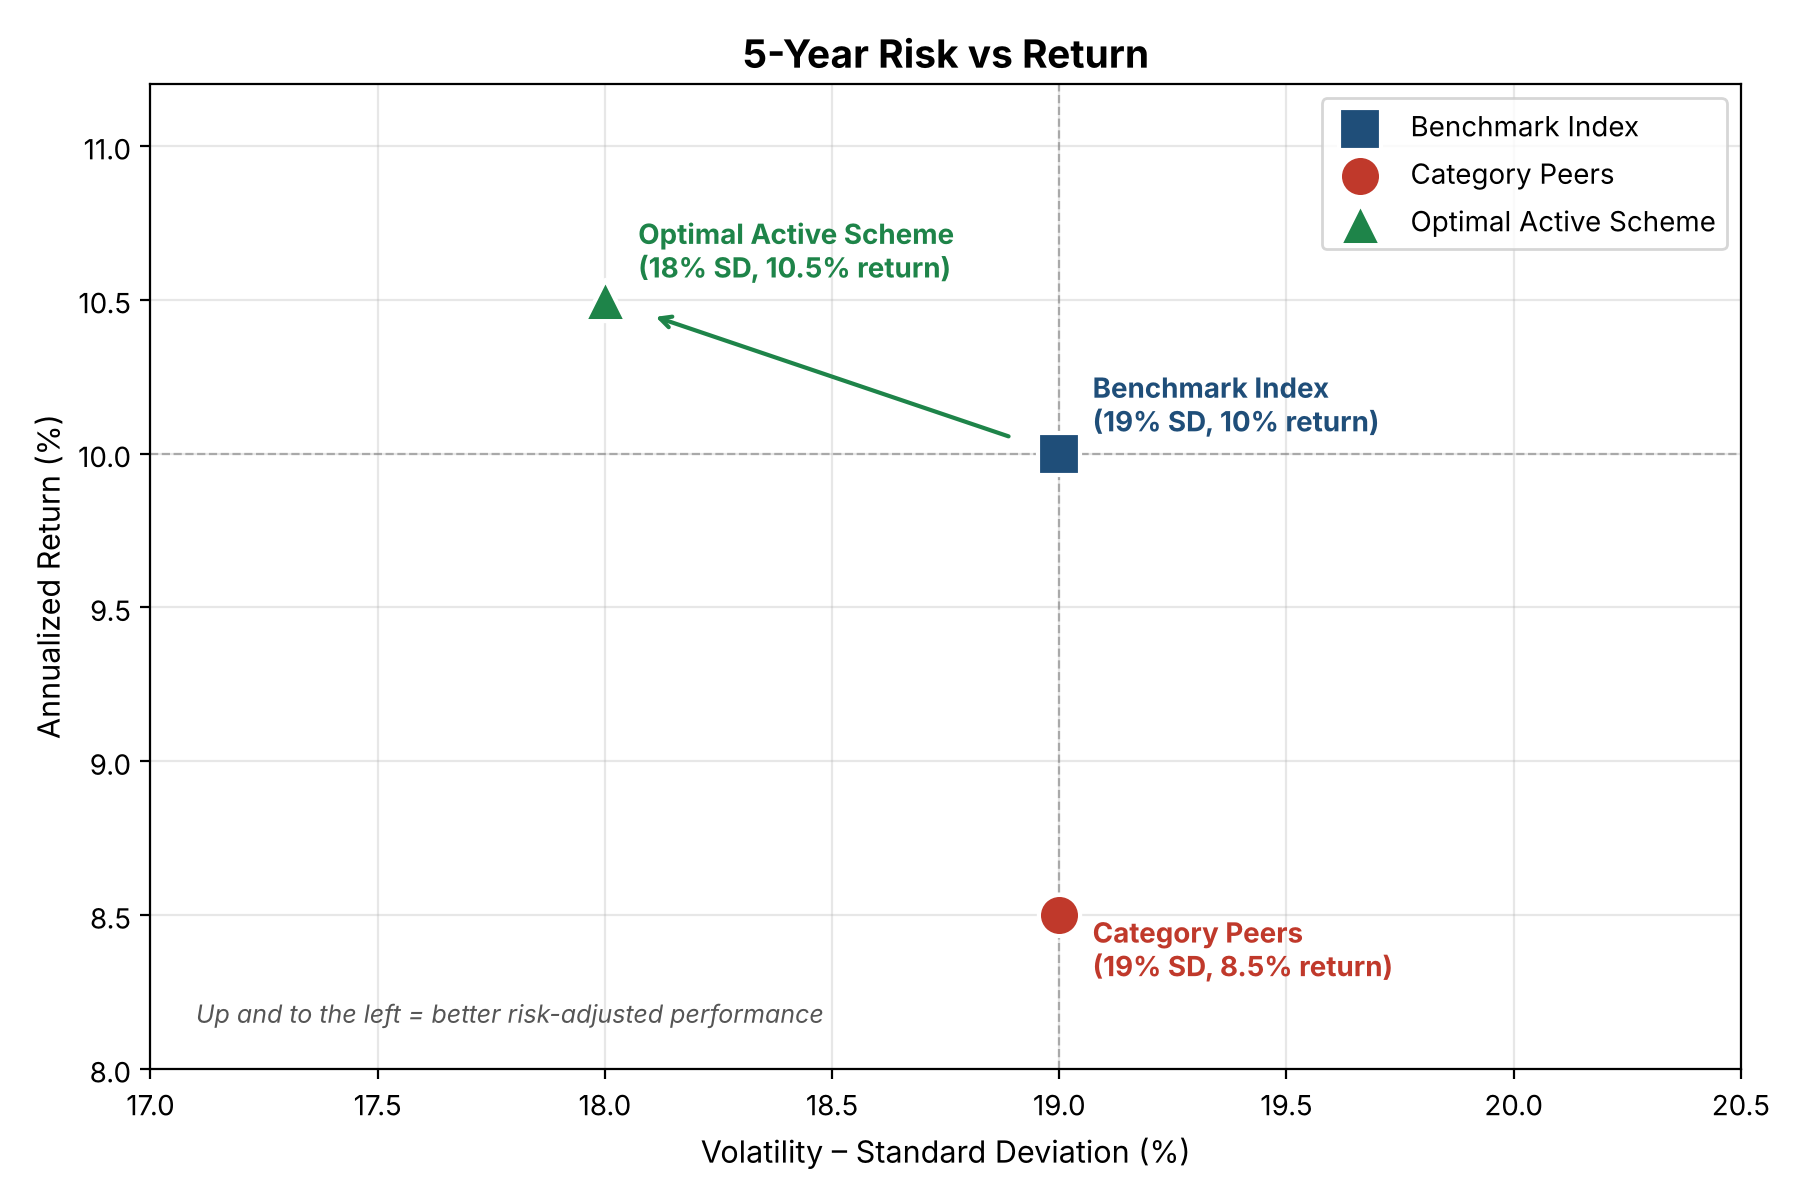
- Benchmark Index:Serves as the anchor (~10% return at 19% standard deviation).
- Category Peers:Often share identical risk profiles (19% standard deviation) while yielding lower net returns (~8.5%), indicating poor overall fee efficiency.
- Optimal Active Scheme:Positions to the left of the benchmark—delivering equal or superior returns (~10.5%) while operating at a lower risk profile (~18% standard deviation).
24.5 Market Stress-Testing
Capture ratios quantify fund behavior during market expansions and contractions. An Upside Capture Ratio above 100% signifies outperformance during market rallies, whereas a Downside Capture Ratio below 100% reflects capital containment during market downturns.
- 5-Year Metrics: Upside Capture = 94% | Downside Capture = 90%
- 10-Year Metrics: Upside Capture = 99% | Downside Capture = 87%
Retaining 99% of market gains while absorbing only 87% of market drawdowns over decade-long horizons accelerates compounding momentum while curbing investor panic during bear markets.
24.6 Key Takeaways

- Filter with Hygiene:Verify track record length, low-cost Direct plan availability, and AMC flagship status before assessing returns.
- Rely on Rolling Metrics:Prioritize 3, 5, and 10-year rolling return distribution ranges over point-to-point trailing numbers.
- Evaluate Risk Efficiency:Confirm that excess returns stem from superior portfolio construction rather than heightened volatility.
- Verify Downside Cushioning:Target downside capture ratios consistently below 100% to safeguard capital during structural market corrections.
15.1 Why talk about bonds now?
We have just finished exploring debt mutual funds, which are essentially baskets of bonds managed by professionals. Before moving on to index funds, it makes sense to pause and understand bonds themselves. After all, debt funds are nothing but a collection of bonds, and if fund managers can buy them directly, so can you. Today, investors don’t need to rely only on mutual funds, there are stock exchanges, SEBI‑registered Online Bond Platform Providers (OBPPs) and, for government securities, RBI Retail Direct, all of which allow individuals to purchase bonds directly, much like buying shares. Understanding bonds at this stage helps you see the mechanics behind debt funds and gives you the option to invest without an intermediary.
Debt mutual funds are essentially collections of bonds. By learning bonds directly, you understand what fund managers are doing behind the scenes.
Example:
- A debt fund like HDFC Corporate Bond Fund invests in PSU bonds such as Power Finance Corporation (PFC).
- As an individual, you can also buy listed PFC bonds directly on NSE/BSE through your broker, or through a SEBI‑registered online bond platform.
This means you can bypass the AMC if you want more control, though you’ll lose professional management.
15.2 Looking at bonds before investing
Imagine you’re browsing the stock exchange website and come across bonds issued by a government-backed company, say Power Finance Corporation (PFC). Each bond issue has a unique identification number called an ISIN, much like a fingerprint. Clicking on a bond reveals details such as whether it is tax-free, its credit rating, issue date, maturity date, coupon rate, and face value.
For example, suppose a PFC bond carries a tax-free tag. This means the interest you earn annually is exempt from income tax, making it highly attractive for investors in higher tax brackets. Note that no new tax‑free bonds have been issued since 2015–16, so today they can be bought only in the secondary market on NSE/BSE. However, if you sell the bond before maturity at a profit, that gain is taxable as capital gains. For listed bonds held for more than 12 months, long‑term capital gains are currently taxed at 12.5% without indexation; gains on bonds held for 12 months or less are taxed at your income‑tax slab rate. Next, you notice the credit rating—say AAA from CRISIL. This rating signals that the issuer is extremely reliable in repaying its debt. Since PFC is a government-owned company (a Maharatna PSU under the Ministry of Power), so the risk of default is considered minimal, although its bonds are not explicitly guaranteed by the government.
Other details matter too. If the bond is marked as secured, it means the issuer has pledged assets against the borrowing, similar to how banks secure car loans against the vehicle. This reduces risk further. You’ll also see the issue date and maturity date—perhaps issued in 2015 and maturing in 2030, making it a 15 year instrument. Finally, the coupon rate tells you how much interest you’ll earn annually based on the bond’s face value. If the coupon is 7% and the face value is ₹1,000, you’ll receive ₹70 per bond each year until maturity.
Looking at Bonds Before Investing
|
Detail |
Meaning |
Example |
|
ISIN |
Unique identifier for each bond issue. |
PFC bond ISINs begin with ‘INE134E’, PFC’s issuer code. |
|
Tax-Free Tag |
Interest exempt from income tax. |
NHAI Tax-Free Bonds (2015–16 issue). |
|
Credit Rating |
Reliability of issuer. |
AAA rating for PFC bonds. |
|
Secured/Unsecured |
Whether assets are pledged. |
REC secured bonds backed by receivables. |
|
Issue & Maturity Date |
Tenure of the bond. |
Issued 2015, maturing 2030 (15 years). |
|
Coupon Rate |
Annual interest on face value. |
7% coupon → ₹70 per ₹1,000 bond. |
Example: If you buy a PFC Tax-Free Bond (October 2015 issue, 15-year series, 7.52% retail coupon, AAA-rated), you’ll receive tax-free interest every year until it matures in 2030. (The 10-year series of the same issue, with a 7.36% retail coupon, matured in 2025.)
15.3.Yield to Maturity (YTM)
While the coupon looks straightforward, the real measure of return is the Yield to Maturity (YTM). Think of it like buying a rental property. Suppose you buy a shop for ₹50 lakh and rent it out for ₹5 lakh per year. That’s a 10% rental yield. But if you later sell the shop for the same ₹50 lakh, your net yield remains 10%. If you bought it at ₹55 lakh instead, your yield drops because your cost was higher. Conversely, if you bought it at ₹45 lakh, your yield rises because you paid less for the same rent.
Bonds work the same way. The coupon is fixed, but the price you pay for the bond changes in the market. If a bond with a ₹1,000 face value and 7% coupon is trading at ₹1,080, you still earn ₹70 annually, but your effective yield is lower because you paid more upfront. On maturity, you’ll only get back ₹1,000, not the premium you paid. That’s why YTM often differs from the coupon—it reflects the actual return considering both interest payments and the difference between purchase price and redemption value.
Yield to Maturity (YTM)
|
Scenario |
Bond Price |
Coupon (₹70) |
Current Yield (Coupon ÷ Price) |
|
Buy at Face Value |
₹1,000 |
₹70 |
7% |
|
Buy at Premium |
₹1,080 |
₹70 |
~6.48% |
|
Buy at Discount |
₹950 |
₹70 |
~7.37% |
Example:
- If you buy a REC bond at ₹1,080, your yield drops below the coupon because you paid extra.
If you buy at ₹950, your yield rises since you paid less for the same coupon. Note: the yields in the table are current yields (coupon ÷ price). The YTM moves even further in the same direction, because the ₹80 premium is lost at maturity (pushing YTM below 6.48%), while the ₹50 discount is gained at maturity (pushing YTM above 7.37%).
Credit Risk Funds are the adrenaline junkies of the debt world. Their mandate is to invest at least 65% in lower-rated corporate bonds (AA and below, excluding AA+). These bonds pay higher interest because the issuers are riskier. The fund manager’s bet is that the company will not default and may even improve its credit rating over time. If that happens, the bond price rises, boosting the fund’s NAV along with the coupon income.
Picture a landlord renting out property to a tenant with a shaky financial history. The tenant agrees to pay double the rent to compensate for the risk. If the tenant stabilizes his income, the landlord benefits both from the high rent and from the improved reputation of the property. But if the tenant defaults, the landlord suffers a heavy loss. That’s exactly how credit risk funds operate.
The danger lies in concentration. Even within SEBI’s single-issuer limits (lower for lower-rated papers), some funds allocate large chunks to a single company. If that company defaults, the NAV can collapse overnight. For retail investors, this risk is unnecessary. Most personal financial goals—retirement, education, home purchase—can be achieved with safer debt categories. Credit Risk Funds are better left to institutional players who can absorb shocks. For individuals, avoiding them is the wiser choice.
High ratings are no guarantee either. DHFL was rated AAA until early 2019, was downgraded as its troubles grew and defaulted in June 2019. The losses hit many debt schemes, not only credit risk funds, which is why every debt investor should check the quality of the papers in a portfolio.
Credit Risk Funds
|
Aspect |
Explanation |
Example |
|
Mandate |
At least 65% in bonds rated AA & below (excluding AA+). |
Nippon India Credit Risk Fund (formerly Reliance Credit Risk Fund). |
|
High Yield |
Lower-rated issuers pay higher interest. |
Bonds of stressed issuers such as DHFL traded at high yields before default. |
|
Concentration Danger |
Large exposure to one issuer magnifies risk. |
DHFL default in 2019 caused sharp NAV markdowns. |
|
Suitability |
Better for institutions, not retail investors. |
Affected schemes suffered sharp losses and side-pocketing. |
15.4 .Accrued Interest

Now let’s talk about accrued interest. Suppose a bond pays its annual coupon every 1st January. If you buy the bond in July, the seller has already held it for six months and earned half the year’s interest. To be fair, you compensate the seller for that portion by paying a slightly higher price, which includes accrued interest. When January arrives, you’ll receive the full coupon, even though you only held the bond for half the year. This adjustment ensures fairness between buyer and seller.
In bond markets, the settlement price (the amount you pay) includes accrued interest and is called the “dirty price.” The price excluding accrued interest is the “clean price.” For example, if the clean price is ₹1,020 and six months of accrued interest on a 7% coupon is ₹35, the dirty price you pay is ₹1,055. This mechanism ensures that the seller is paid interest for the period they held the bond, and the buyer earns interest only for the period they hold it.
Accrued Interest
|
Term |
Meaning |
Example |
|
Clean Price |
Price excluding accrued interest. |
₹1,020 |
|
Accrued Interest |
Interest earned by seller till date. |
₹35 |
|
Dirty Price |
Settlement price (Clean + Accrued). |
₹1,055 |
Example:
- A bond pays coupon every 1st January.
- You buy in July → seller already earned 6 months’ interest.
- You pay dirty price (includes accrued interest).
- In January, you still receive full coupon (₹70).
15.5 .Should you invest in bonds?
Many investors lean heavily toward equities because of their growth potential. But market shocks—like the sudden crash during the pandemic—remind us that diversification is essential. When stock indices fell sharply, even many long-term SIPs briefly showed negative returns, leaving equity only investors exposed. Bonds, gold, and fixed deposits act as stabilizers in such times. They may not deliver spectacular returns, but they provide safety and predictable income.
Today, you can build a portfolio using a mix of assets: equities for growth, mutual funds for diversification, bonds for stability, gold for inflation protection, and fixed deposits for liquidity. The right blend depends on your goals—whether it’s wealth creation, retirement planning, or capital preservation. Bonds deserve a place in that mix because they balance risk and return, ensuring your portfolio doesn’t crumble during market downturns.
Should You Invest in Bonds?
Bonds stabilize portfolios during equity downturns.
Examples of Diversification:
- Equities: Growth (Infosys, Reliance shares).
- Bonds: Stability (PFC, NHAI tax-free bonds).
- Gold: Inflation hedge.
- FDs: Liquidity.
During the COVID-19 crash (February–March 2020), the Nifty 50 and Sensex fell about 38% from their January 2020 peaks. High-quality bonds and gilt funds cushioned portfolios, proving their stabilizing role.
15.6.Key takeaways
- Tax-free bonds provide interest income exempt from tax (no new issues since 2015–16; they are available only in the secondary market).
- PSU bonds generally carry low credit risk because of government ownership, though most are not explicitly government-guaranteed.
- Coupon rate is fixed on face value, but actual returns depend on purchase price.
- Yield to Maturity reflects the true return considering both coupon and redemption value.
- Accrued interest ensures fairness between buyer and seller during coupon cycles.
- Diversification with bonds and other assets protects against equity market shocks.