
28.1 – Assets, Liabilities, and the Purpose of Ownership

An individual or corporate balance sheet categorizes capital into assets (economic resources producing positive monetary value or cash flows) and liabilities (claims by debt-holders requiring future outflow of economic benefits).
- Tangible vs. Intangible Assets:Tangible real assets (e.g., agricultural land, bullion) possess physical form and intrinsic utility, whereas intangible assets (e.g., patents, registered trademarks, brand equity) drive cash flow via legal rights and competitive moats.
- Liabilities:Consist of fixed debt obligations such as term loans, home loans (mortgages), credit‑card dues or accrued payables, which usually carry an interest cost.
- Intertemporal Wealth Transfer:Assets function as mechanisms to shift purchasing power across time horizons. Fixed-income securities (e.g., coupon-bearing bonds) generate recurring coupon income () per period; their price is the present value of these coupons plus the face value (F) at maturity, discounted at the market yield (r):
PV = Σ (from t = 1 to n) [ C / (1 + r)^t ] + F / (1 + r)^n
Non-yielding assets (e.g., fine art or physical commodities) transmit intergenerational wealth strictly through capital appreciation () when supply curves remain inelastic relative to demand growth.
28.1.1 – The Time Value of Money & Inflation Dynamics

Fiat currencies lose purchasing power over time due to inflation—the rate at which the general level of prices for goods and services rises. Central banks typically manage monetary policy around specific headline inflation bands (such as the Reserve Bank of India’s flexible target of 4% +- 2% under the RBI Act framework, retained for April 2026 to March 2031).
Holding uninvested cash exposes capital to persistent negative real yield due to purchasing power decay. The residual real value of cash subject to annual inflation (i) over years is governed by the compounding formula:
Real Value =Nominal Value /(1+i)n
- Real-world Impact:At a consistent annual headline inflation rate of , a cash holding of ₹1,00,000 loses approximately 16% of its purchasing power over 10 years, shrinking its effective value to ₹55,839.
- Hedge Imperative:To prevent capital erosion, long-term capital must be allocated to productive assets—such as equities, commercial property, or commodities—yielding a positive real rate of return rreal (that is, returns above inflation), approximated via the Fisher Effect: rreal ≈ rnominal – i
28.1.2 – Functional Categories of Assets

- Precious Metals: Gold functions as a monetary asset with historically low correlation to equities and to paper (fiat) currencies. Historically, physical bullion acts as a counter-cyclical store of value during currency devaluation regimes and periods of negative real yields.
- Real Estate: Property investment offers dual return drivers: net operating income (rental yield, historically ranging between for residential and for commercial properties) and long-term land value appreciation. Real estate exhibits illiquidity, significant transaction costs ( in stamp duty/registration fees), and spatial heterogeneity.
- Alternative Collectibles: Art, rare numismatics, and digital assets (e.g., non-fungible tokens) represent non-standardized markets. Valuation relies heavily on subjective utility, liquidity premiums, and secondary market demand rather than fundamental cash-flow discounted valuations.
- Exchange-Traded Financial Assets: Standardized financial instruments (equities, sovereign and corporate bonds, pooled vehicles like Exchange Traded Funds) operate under strict regulatory standards (e.g., SEBI or US SEC enforcement). This infrastructure supports transparent price discovery, order matching, generally tight bid-ask spreads for liquid instruments, and exchange-cleared settlement (T+1 for Indian and US equities).
28.2 – Asset Allocation and Capital Market Realities

Asset allocation involves distributing a portfolio’s capital across asset classes with low correlation to one another to optimize the overall Sharpe Ratio—a measure of risk-adjusted return calculated as:
Sharpe Ratio = Rp – Rf / σP
Because financial markets undergo structural regime shifts driven by macroeconomic variables (interest rate cycles, fiscal policy, currency movements), individual asset class returns are impossible to consistently forecast over multi-year horizons.
- Historical Market Leadership Cycles:Regional equity market performance varies significantly across market cycles. Emerging Market equities outpaced US Developed Markets during the post-dot-com expansion (2000-2007), whereas US mega-cap technology equities outpaced broader global equities in the low-rate regime following the Global Financial Crisis (2010-2020).
- Diversification Principle:Broad asset distribution mitigates single-market concentration risk and reduces non‑systematic risk without requiring predictive market timing, although it cannot remove systematic risk.
28.3 – Sequence of Returns Risk

Sequence Risk refers to the path-dependency of investment returns. While long-term historical returns are calculated using Compound Annual Growth Rate (CAGR), individual investors experience cash flow timing constraints that make annualized averages misleading.
- Mathematical Mechanism:Mathematical commutative property states that for a lump sum with no withdrawals, return order does not change the final valuation (A *B*C=C*B*A). However, for portfolios with regular withdrawals (such as a retirement corpus) or regular contributions, the order matters: losses early in a withdrawal phase permanently deplete the capital base, because units sold at low prices cannot participate in the recovery.
- Scenario Example:If a ₹10,00,000 equity portfolio incurs consecutive losses of -20%,-15% , and -10% in years 1–3, the base capital collapses to ₹6,12,000. Regaining the initial ₹10,00,000 target requires a cumulative return of +63.4% over the remaining period, showing how deep early losses demand large recoveries. If withdrawals are also being taken during these loss years, the shortfall becomes even harder to recover, which is why sequence risk threatens financial outcomes even if long‑term historical averages remain positive.
- Mitigation Strategy:Combining assets with low or negative covariance (e.g., equities paired with high-grade sovereign debt or gold) dampens maximum drawdowns during equity market stress.
28.4 – True Diversification vs. “Diworsification”
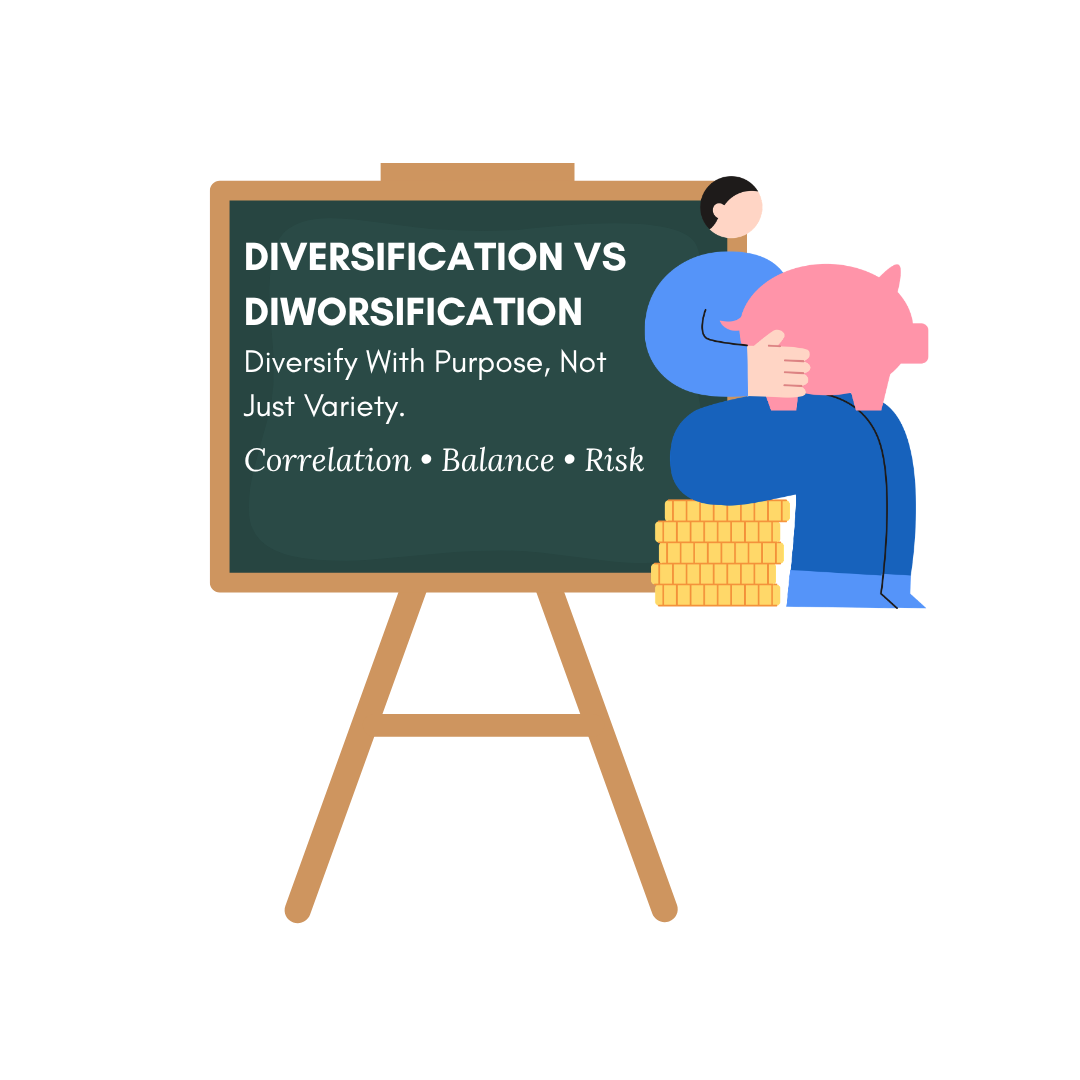
True portfolio diversification requires selecting assets driven by fundamentally distinct macroeconomic factors, reducing total portfolio variance:
σp² = w1²σ1² + w2²σ2² + 2·w1·w2·Cov(1,2)
Holding multiple products influenced by the same underlying systematic risks leads to diworsification—increasing structural portfolio complexity without achieving risk reduction.
28.5 – Structural Framework for a Balanced Starter Portfolio

For novice investors, an un-leveraged, broad-market allocation provides diversified asset exposure while minimizing expense ratios:
- Domestic Equities:Broad market indices (e.g., Nifty 50 or Nifty Large Midcap 250) capturing domestic corporate earnings growth.
- International Equities:Index funds tracking broad foreign benchmarks (e.g., S&P 500 or MSCI World) for geographical and currency diversification. (Indian mutual funds operate under overseas investment limits, so international funds sometimes pause fresh subscriptions.)
- Fixed Income:Short-duration sovereign debt or high-grade Public Sector Undertaking (PSU) bonds to anchor capital stability and preserve liquidity.
- Precious Metals:Gold ETFs or gold funds to capture bullion price movements without physical storage/assay costs. (No new Sovereign Gold Bond tranche has been issued since February 2024; existing SGBs can still be bought on stock exchanges.)
- Real Estate Exposure:Real Estate Investment Trusts (REITs) providing fractional ownership of yield-generating commercial portfolios with daily exchange liquidity.
Note: For investors lacking historical correlation models, an Equal-Weight Allocation ( 20% across 5 distinct asset classes) can serve as a simple starting point, to be adjusted for the investor’
28.6 – Financialization and Structural Risks to Diversification

While structural innovations (such as liquid ETFs, liquid options contracts, and REITs) have lowered barrier-to-entry costs, they have also altered baseline correlation matrices.
- Correlation Convergence:Historically, private real estate exhibited near-zero correlation with public equities due to high search costs, localized pricing, and multi-month transaction timelines. Securitized real estate (REITs) trades on public exchanges in real-time alongside equities, subjecting real estate assets to equity-market liquidity shocks, systemic market volatility, and margin call liquidations.
- Adaptive Management Necessity:Inter-asset correlations are non-static; they tend to trend toward during extreme systemic crises. Investors must periodically audit asset correlations to ensure true diversification over changing macroeconomic cycles.
Key Takeaways
- Wealth Preservation Imperative:Cash allocations decay due to compounding inflation; long-term purchasing power requires allocations to real yield-generating assets.
- Factor-Driven Selection:Asset selection must evaluate underlying macroeconomic return drivers rather than short-term price momentum.
- Execution Simplicity:Prioritize low-cost, liquid structural instruments over complex, highly correlated assets to avoid diworsification.
- Dynamic Risk Profile:Correlations shift over time as asset classes become financialized; periodic asset allocation review is mandatory.
27.1 Setting the Stage

This chapter introduces a relatively new category of funds in India — smart-beta funds and ETFs. Unlike traditional index funds that simply track a market-cap weighted benchmark (like Nifty 50), smart-beta funds use alternative methods of weighting stocks.
For example, instead of giving more weight to companies with the largest market capitalization, a smart-beta index might assign weights based on earnings, dividends, or profitability. The idea is to capture certain characteristics of stocks that historically drive returns.
Think of it like cooking: a traditional recipe follows exact proportions (market-cap weighting), while smart-beta tries different combinations of ingredients (factors) to enhance flavor.
27.2 – What Are Factors?

A factor is a persistent driver of stock returns. Factor investing means building portfolios around these traits. Academic research, starting with the Capital Asset Pricing Model (CAPM), evolved into the Fama-French models, which identified multiple factors beyond just market risk.
Here are the most common factors explained simply:
|
Factor |
Meaning |
Example |
|
Value |
Cheap stocks have historically outperformed expensive ones |
A stock trading at low pricetobook but strong fundamentals |
|
Momentum |
Recent winners tend to keep winning (and losers keep losing) in the short to medium term |
A stock rising steadily for 12 months often continues upward |
|
Low Volatility |
Lowerrisk stocks deliver better riskadjusted returns |
Consumer staples outperform during downturns |
|
Quality |
Profitable, stable companies outperform weaker ones |
Firms with strong balance sheets and steady cash flows |
|
Size |
Smaller companies outperform larger ones |
Mid-caps often grow faster than mega-caps |
In India, data is limited, but early studies show momentum and low volatility strategies have delivered attractive returns, though momentum comes with sharper drawdowns.
27.3 – Smart Beta Funds in India

Smart beta ETFs and index funds are relatively new in India; most launched after 2018, though the category has grown rapidly since 2020. Examples include quality ETFs, value ETFs, and low volatility ETFs.
However, live performance often differs from back-tested index data due to costs, liquidity, and market efficiency. In the US, factor ETFs have longer histories, and the evidence shows factors are cyclical — they can outperform for years, then underperform for a decade or more.
For instance:
- Value stocks underperformed growth stocks for well over a decade in the US (roughly 2007–2020).
- Momentum ETFs delivered strong gains but suffered steep declines during market reversals.
This cyclical nature means investors must be patient and avoid chasing recent winners blindly.
27.4 – Do Smart Beta Funds Work?

There are two schools of thought:
- Sceptics:Believe factors are just backtested data mining. They argue that once markets become efficient, these premiums disappear.
- Believers:Point to firms like Dimensional Fund Advisors (DFA), managing hundreds of billions of dollars using factor strategies, as proof that factors can work long-term.
The truth lies in between. Factors do work, but their premiums are not constant. They ebb and flow, requiring long horizons and tolerance for underperformance.
Challenges today:
- Markets are more efficient with data widely available.
- Too many “new factors” discovered through data mining — the so called factor zoo.
- Premiums shrink as more money chases the same strategies.
So, while factors remain useful, investors must temper expectations and understand the pain involved in harvesting them.
27.5 – Should You Invest in Smart Beta Funds?

Smart-beta funds should not replace index funds or consistently managed active funds. Instead, they can complement your portfolio.
- Core allocation: Index funds or diversified active funds.
- Satellite allocation: Smart-beta funds for potential extra returns.
But remember:
- Factors can underperform for long stretches.
- Each factor ETF defines its methodology differently (e.g., value could mean price to book, price to sales, or forward earnings).
- Diversification across factors is key. Multi factor products (like ICICI Prudential Alpha Low Vol 30 ETF, which tracks the Nifty Alpha Low‑Volatility 30 index, or the actively managed, rules‑based DSP Quant Fund) combine traits; read the index or fund methodology carefully, as approaches differ.
Table: Comparing Fund Types
|
Fund Type |
Weighting Method |
Pros |
Cons |
|
Index Fund |
Marketcap weighted |
Simple, low cost, broad exposure |
Heavy reliance on large caps |
|
Active Fund |
Fund manager discretion |
Potential to beat benchmark |
High fees, inconsistent performance |
|
Smart Beta Fund |
Factor based weighting |
Targets specific drivers of returns |
Cyclical, methodology differences |
Key Takeaways
- Smart beta is essentially factor investing with alternative weighting.
- Factors like value, momentum, low volatility, quality, and size drive returns but are cyclical.
- Indian smart beta ETFs are new; US data shows long cycles of underperformance.
- Use smart beta funds as a supplement, not a core holding.
- Diversify across factors and avoid chasing past performance.