
8.1 Setting the Stage – From Basics to Reality

In the earlier discussion, we simplified the idea of a mutual fund by imagining a group of people pooling their money together to invest with a shared purpose. That simplification was deliberate it helped us grasp the foundation without getting lost in technicalities. Now, as we move forward, it’s time to step into the real world of mutual funds and see how this industry actually looks and operates.
Before we dive into the fund factsheet the key document that tells you everything about a scheme—it’s important to understand the scale of the mutual fund industry in India. Think of it like learning about the size of a city before exploring its neighborhoods. Knowing how wide and deep the industry runs will give you perspective when you later analyze individual funds.
The Breadth of the Industry
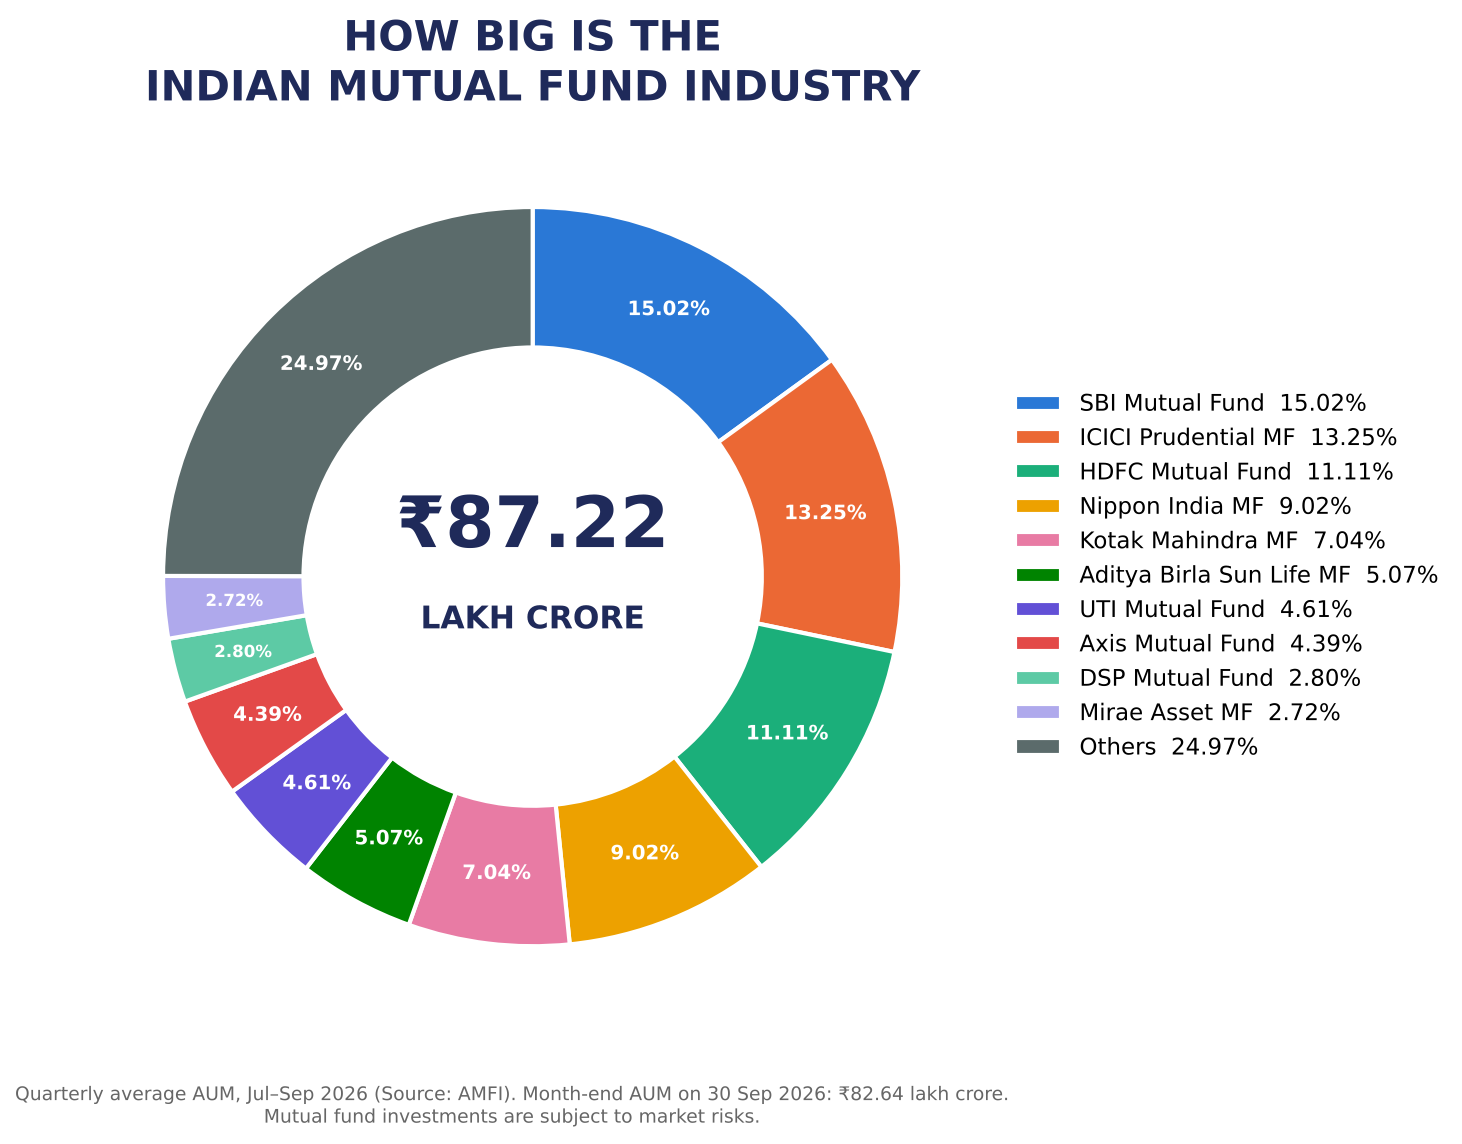
India’s mutual fund ecosystem is vast. In mid-2021, there were 45 Asset Management Companies registered with SEBI; by 2026 the number had grown to nearly 60. Each AMC is essentially a professional fund house that designs and manages investment schemes. To make this relatable, imagine the FMCG industry: you have multiple brands like Britannia, Nestlé, or ITC, each offering dozens of products. Similarly, in mutual funds, you have AMCs like HDFC, ICICI Prudential, Kotak, Axis, and DSP, each offering a wide menu of schemes for investors.
Expansion of the Industry (2021–2026)
- AUM Growth: From about ₹35 lakh crore in mid 2021, the industry expanded to ₹53.4 lakh crore by March 2024and further to ₹68–69 lakh crore by late 2024, finally reaching ₹82.64 lakh crore by September 2026 . This represents more than a doubling in five years.
- Investor Base: Folios rose to 78 crore by March 2024, translating into 4.46 crore unique investors, up from 2.39 crore in 2021. By June 2026, folios had reached 27.86 crore, held by about 6.2 crore unique investors. Women now account for about 23% of investors, showing a gradual diversification of participation.
- Retail vs Institutional: Individual investors dominate equity, hybrid, and solution oriented schemes, holding nearly 60% of AUM. Institutions remain strong in debt and liquid funds.
Schemes – The Product Line of AMCs
Across these fund houses, there were about 1,510 schemes running at that time (2021); by December 2025, there were about 1,763 open-ended schemes. A scheme is nothing but a specific fund with a defined investment objective. For instance, one scheme may focus on large-cap stocks, another on debt instruments, and yet another on hybrid strategies. To give you a parallel: think of a restaurant chain like Domino’s. While the brand is one, the menu has multiple pizzas, sides, and desserts. Each scheme is like a different item on the menu, catering to varied tastes and needs.
Some AMCs are particularly prolific. In 2021, Nippon India AMC, for example, had around 145 schemes, while SBI AMC managed about 144. This variety ensures that investors with different risk appetites and goals can find something suitable.
The Scale of Money Managed
Now, let’s talk about the money involved. In 2021, the Indian mutual fund industry was managing close to ₹35 lakh crore. To put that in perspective, this is larger than the GDP of many countries. Within this, SBI AMC alone managed over ₹5.2 lakh crore, while Axis AMC handled about ₹2 lakh crore. On the other end of the spectrum, smaller players like Yes AMC managed just a few hundred crores. By March 2026, SBI Mutual Fund alone managed about ₹12.5 lakh crore.
This money doesn’t come from one type of investor it’s a mix. Roughly half of it around ₹18.8 lakh crore came from individual investors like you and me, while the other half about ₹16.3 lakh crore came from corporates and institutions. It’s like a cricket stadium filled with both everyday fans and corporate sponsors each contributing to the energy of the game.
The Investor Base
Finally, consider the sheer number of people involved. By July 2021, there were about 2.39 crore unique investors in mutual funds. That’s nearly the population of a mid-sized state in India, all participating in this financial ecosystem. By mid-2026, the count had grown to about 6.2 crore. Each investor may hold multiple schemes, but this number reflects individuals who have chosen mutual funds as a path to grow their wealth.
Why These Numbers Matter
You don’t need to memorize these figures. They are meant to give you perspective. When you later look at a fund factsheet, you will realize that each scheme is just one small piece of this massive puzzle. Understanding the industry’s scale helps you appreciate the importance of regulation, transparency, and professional management.
In the next step, we’ll zoom in from this bird’s-eye view and learn how to read a fund factsheet,the document that tells you exactly what a scheme is about, how it invests, and whether it fits your financial goals.
The Role of the AMC
An Asset Management Company is like the engine room of the mutual fund industry. It designs, manages, and runs multiple schemes, each with its own purpose. Think of it as a film production house: one studio can produce many movies, but each movie has its own storyline, cast, and audience. Similarly, an AMC can launch several schemes, but each scheme has a distinct investment objective.
For instance, one scheme might aim to invest in India’s top 50 blue-chip companies, while another might chase opportunities in fast-growing smaller listed companies. Once the objective is declared, the fund manager is bound to follow that script throughout the life of the fund. Changing such a fundamental attribute requires SEBI’s clearance, written notice to investors and a window in which they can exit without any exit load. This consistency is what gives investors clarity and confidence.
8.2. Exploring a Factsheet
Every scheme comes with a factsheet, a concise document that tells you what the fund is all about. For example we’re looking at a scheme from SBI Mutual Fund. Suppose we pick the SBI Small Cap Fund. The factsheet is often called a “one-pager” because it condenses the most important details into a quick snapshot.
The very first section usually spells out the objective. For SBI Small Cap, it might say something like: “The fund seeks long-term capital growth by investing primarily in small-cap companies across diverse sectors.” From this single line, you already know three things:
- The goal is capital growth, not regular income.
- The investments will be in equity and equity-related instruments -stocks, warrants, etc.
- The focus is on small-cap companies, which are smaller listed firms ranked 251st and below by market capitalisation with high growth potential but also higher risk.
What the Objective Tells You
This objective is more than just a formal statement—it sets the boundaries for the fund manager. If the scheme says “small-cap,” it must keep at least 65% of its assets in small-cap stocks, so the manager cannot suddenly load the portfolio with large-cap giants like Reliance or Infosys. Investors choose the scheme because of its stated mandate, and SEBI ensures that AMCs stick to it.
So, when you read “SBI Small Cap Fund,” you immediately know the flavor of the investment: it’s adventurous, growth-oriented, and focused on emerging businesses rather than established giants.
The Research Approach
Most factsheets also give a glimpse into how the AMC selects stocks. This part can sound technical, but let’s break it down with simpler examples. A fund manager might look at:
- Promoter integrity: Is the leadership trustworthy? For example, a company run by promoters with a history of fraud would be avoided.
- Cash flow strength: Does the business generate surplus cash after expenses? A retailer like DMartis admired for its strong cash flows.
- Survival through cycles: Has the company weathered downturns? Firms like Maricoor Pidilite have proven resilience across decades.
- Simple business model: Easy-to-understand businesses are preferred. A company making paints or biscuits is simpler to analyze than a conglomerate dabbling in ten unrelated industries.
- Financial quality: Ratios like return on equity or debt-to-equity are checked. For instance, a debt-free company like Infosysscores high here.
- Low leverage: Companies with little or no borrowing are safer bets, especially in volatile markets.
These criteria are essentially filters. The AMC doesn’t expect investors to decode them—it’s their job. As an investor, you only need to know that the fund manager is applying a disciplined process to pick stocks.
Why Investors Don’t Need to Worry About the Details
Here’s the key point: you don’t need to master these metrics yourself. If you already knew how to evaluate promoters, cash flows, and leverage, you’d probably skip mutual funds altogether and invest directly in stocks. The whole reason mutual funds exist is to let professionals do the heavy lifting while you participate in the growth story.
The factsheet is simply a window into their thought process. It reassures you that there’s a method behind the madness, but you don’t have to get lost in the jargon.
Pulling It Together
So, when you pick up a factsheet—whether it’s Kotak, SBI, HDFC, or ICICI—the structure is broadly the same:
- Objective: What the fund aims to achieve.
- Category: Equity, debt, hybrid, liquid, etc.
- Research philosophy: How stocks are chosen.
- Portfolio snapshot: Which companies/sectors the fund currently holds.
- Performance data: Returns compared to benchmarks.
Each section is designed to help you decide whether the scheme matches your own financial goals.
8.3. Benchmark – The Yardstick

Every mutual fund needs a benchmark index to measure its performance. Think of it like a school exam: your marks only make sense when compared to the class average. For example, if we look at the HDFC Mid Cap Fund , its benchmark is the NIFTY Midcap 150 Total Return Index. This ensures that when you evaluate returns, you’re comparing apples to apples.
If a mid-cap fund were benchmarked against the Nifty 50, it would be misleading like comparing the lap time of a family hatchback to a Formula 1 car. The benchmark tells you whether the fund manager is genuinely adding value or just riding the market wave.
Type of Scheme – Open-ended, Equity, Growth
The factsheet also specifies the type of scheme, which usually has three parts:
- Open-ended: This means the fund has no expiry date. You can enter or exit anytime. For example, ICICI Prudential Large Cap Fund is open-ended, so you can invest today and redeem after 10 years—or even after 10 months. In contrast, a closed-ended fund like a Fixed Maturity Plan locks your money for a fixed term, say 3 years . Open-ended funds are more flexible for most investors.
- Equity: This indicates the asset class. Equity funds invest in company shares, while debt funds invest in bonds or government securities. Hybrid funds mix both. So, if you pick Axis Large Cap Fund, you know it’s focused on stocks, not bonds.
- Growth: This refers to how profits are treated. In the growth option, earnings are retained and reinvested in the fund, allowing compounding to work its magic. We’ll explore this more in a moment.
Fund Manager and Allotment Date
The fund manager is like the captain of the ship. For instance, if you’re considering SBI Equity Hybrid Fund, you would want to check who manages it, how long they have managed it, and their experience across equity and debt markets. A quick background check helps you gauge whether your money is in steady hands.
The allotment date tells you when the fund started. An older fund, say launched in 2005, has a long track record you can analyze. A newer fund launched in 2023 may not yet have proven itself across market cycles. It’s not a deal-breaker, but history makes analysis easier.
Plans – Regular vs Direct
This is one of the most important distinctions:
- Regular Plan: Imagine you buy mangoes from a local vendor. The farmer sells them at ₹60/kg, but the vendor charges you ₹70/kg because he earns a margin. Similarly, in a regular plan, the AMC pays a commission to the distributor who sold you the fund. That commission is built into the regular plan’s higher expense ratio, so it ultimately comes from your returns.
- Direct Plan: Here, you buy directly from the AMC—no middleman, no commission. For example, if you invest in UTI Flexi Cap Fundvia a direct plan, you save that extra cost, which means slightly higher returns over the long term. If you can select and monitor funds yourself, direct plans are usually the cheaper choice.
Options – IDCW vs Growth
Funds also offer options on how returns are handled:
- IDCW Payout (formerly “Dividend Payout”): Since April 2021, SEBI has called this option Income Distribution cum Capital Withdrawal (IDCW). Suppose you choose the IDCW payout option of a hybrid fund. The AMC may, at its discretion, distribute part of the scheme’s surplus to you. This is not the same as passing on dividends received from portfolio companies, and a payout can include part of your own capital. The NAV falls by the amount paid out, and the payout is taxed at your income-tax slab rate. It can still be useful if you want periodic cash.
- IDCW Reinvestment: Instead of cash, the distributed amount is used to buy more units of the same fund. This increases your holdings without you having to reinvest manually.
- Growth Option: No payouts are made. All profits stay in the fund, boosting the NAV. Over time, this creates a compounding effect. For long-term wealth creation, the growth option is often preferred because it maximises reinvestment and defers tax until you redeem.
SIP – Systematic Investment Plan
A SIP is like a monthly subscription to wealth creation. You commit to investing a fixed amount regularly. For example, you might invest ₹3,000 every month in Nippon India Small Cap Fund. Over 10–15 years, this disciplined approach averages out your purchase cost across market ups and downs (rupee-cost averaging) and can build a sizeable corpus.
Most AMCs specify a minimum SIP amount—now often ₹100 to ₹500 (SEBI and AMFI are also promoting ₹250 “Chhoti SIPs”)—and a minimum number of instalments, commonly 6 or 12. This makes SIPs accessible even for beginners.
Minimum Investment
If you don’t want to start with SIP, you can make a lump sum investment. For instance, Aditya Birla Sun Life Flexi Cap Fund sets its own minimums; across the industry these are commonly ₹100–₹1,000 per SIP instalment and ₹100–₹5,000 for a lump sum, so always check the scheme’s factsheet. This ensures accessibility while maintaining discipline.
Load Structure – Entry and Exit
Finally, the load structure tells you about charges when entering or exiting the fund:
- Entry Load: This used to be a fee for investing, but SEBI abolished it in August 2009. Funds now show “Nil” for entry load.
- Exit Load: This is a penalty for withdrawing too soon. For example, Kotak Midcap Fund may charge 1% if you redeem within 12 months, but nothing if you stay invested longer. This discourages short-term trading and encourages long-term commitment.
In short, the “other facts” section of a factsheet is where you learn about the rules of engagement: how the fund is structured, who runs it, how you can invest, and what costs you’ll bear. It’s like reading the fine print before signing a contract—essential for making informed decisions.
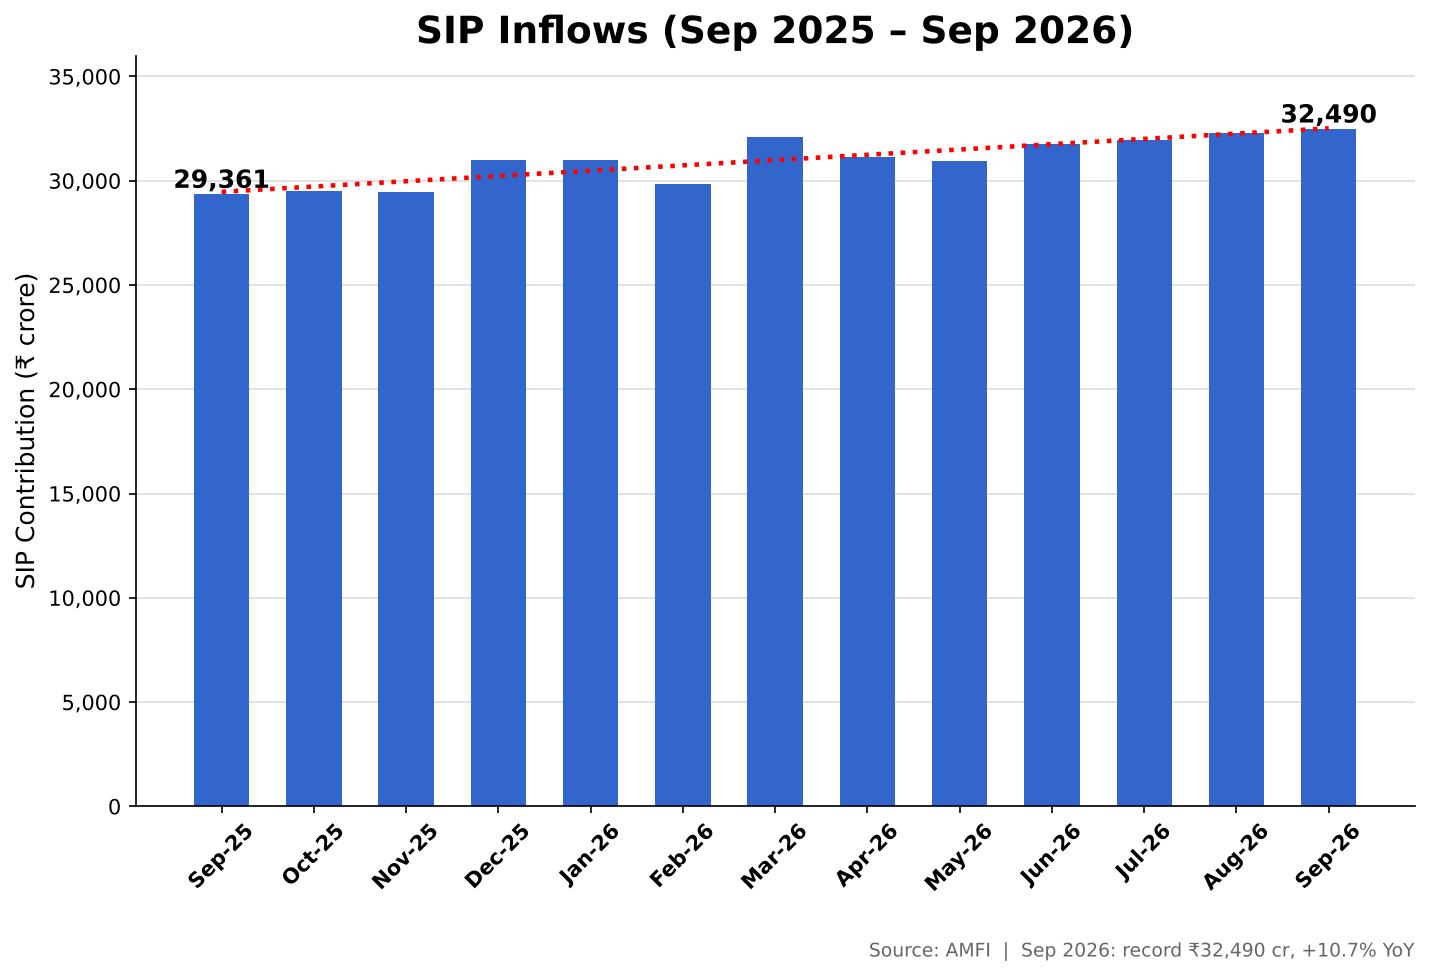
- SIP Assets: By November 2024, SIP AUM hit ₹13.54 lakh crore, rising further to ₹18.62 lakh crore by August 2026 (about 21% of industry AUM), with over 10 crore contributing SIP accounts.
- Monthly Inflows: Grew from ₹17,073 crore in Nov 2023 to ₹25,320 crore in Nov 2024, a 48% jump. In September 2026, they reached a record ₹32,490 crore.
- Regional Trends: Smaller states like Lakshadweep, Himachal Pradesh, and Puducherryrecorded SIP shares above 40% of their total AUM, while larger hubs like Delhi and Maharashtra had lower SIP penetration (<20%).
Category Trends
- Equity Funds: Equity AUM grew 55% in FY24, reaching ₹23.5 lakh crore. Flexi-cap funds led with ₹3.5 lakh crore, while multi-cap and small-cap funds grew fastest (85% and 82% respectively).
- Sectoral/Thematic Funds: These saw 79% growth in 2024, with AUM rising from ₹2.58 lakh crore to ₹4.61 lakh crore.
- ETFs and Index Funds: Expanded 28% in 2024, reaching ₹11.29 lakh crore, reflecting investor appetite for passive strategies.
Structural Shifts
- Domestic vs Foreign Ownership: Domestic institutional investors (mutual funds, insurers, pension funds and others) have owned a larger share of NSE-listed companies than foreign investors since early 2025; in the June 2026 quarter, they held 19.5% versus 15.1% for foreign portfolio investors. This marks a historic inversion in market ownership, driven by SIP inflows and declining foreign equity holdings.
- Market Share: Domestic mutual funds now hold a record 11.6% of NSE-listed companies, up from just 3.56% in 2015. Foreign investors’ share has dropped to a 17year low of 15.1%.
8.4 What is the Riskometer?
Every mutual fund carries a certain level of risk, and SEBI requires AMCs to self-assess and disclose this risk to investors. This is done through a simple visual tool called the Riskometer. Think of it as the speedometer in a car it tells you how fast the ride is.
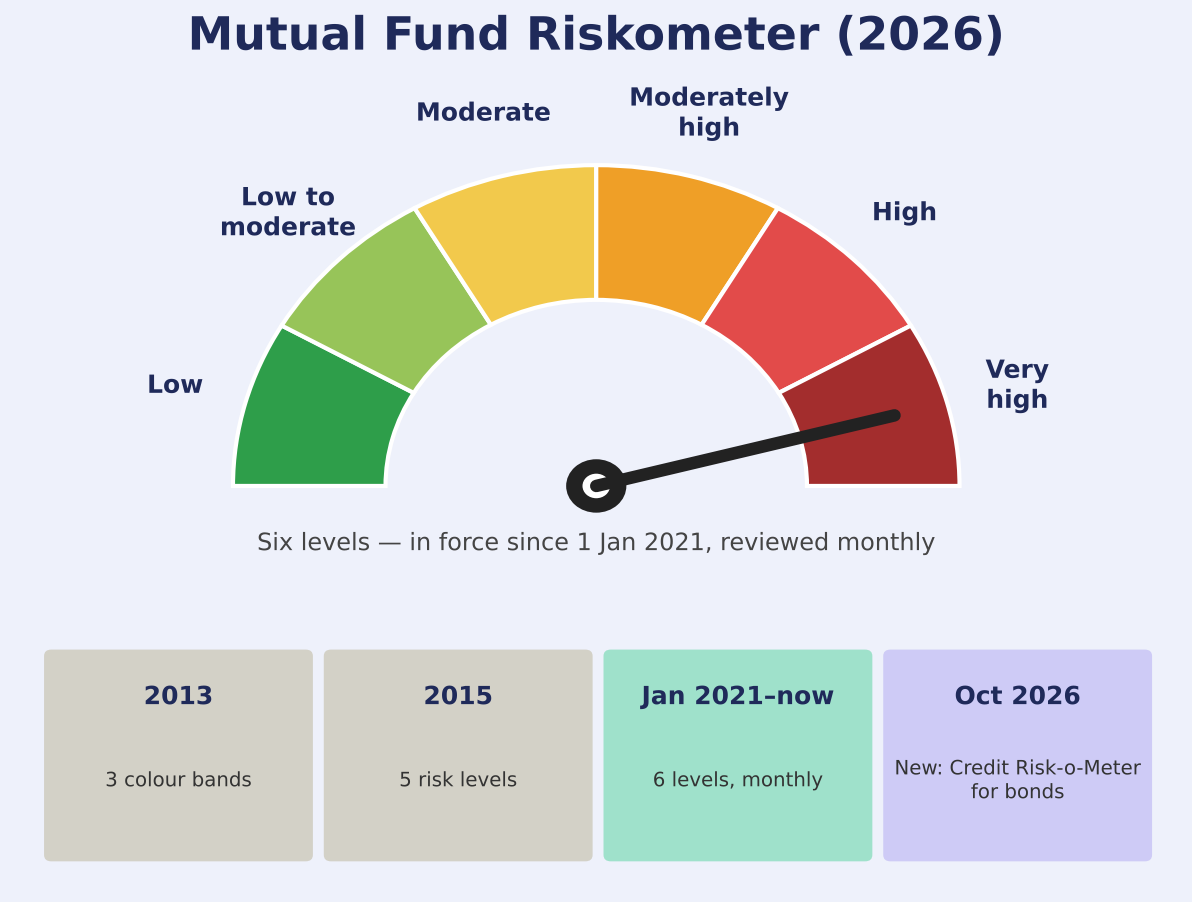
For example, if you look at the Axis Small Cap Fund, the Riskometer will point to “Very High,” the top of its six levels (Low, Low to Moderate, Moderate, Moderately High, High and Very High). That’s because small-cap companies are more volatile—they can grow rapidly but also fall sharply. On the other hand, a HDFC Liquid Fund will typically show “Low to Moderate” risk because it invests in short-term debt instruments, which are relatively stable.
Why Risk Disclosure Matters
This disclosure prevents mis-selling. Imagine if a small-cap fund were marketed as “safe” like a fixed deposit. That would mislead investors who expect stability but end up facing sharp ups and downs. The Riskometer ensures transparency: you know upfront whether you’re stepping into a roller coaster or a calm boat ride.
It’s similar to food packaging—if a packet of chips says “low fat” but is actually loaded with oil, that’s deceptive. SEBI’s rule ensures mutual funds don’t mislabel their risk profile.
High Risk Doesn’t Mean Avoidance
Now, just because a fund is marked “High Risk” doesn’t mean you should avoid it. Risk and reward are two sides of the same coin. Small-cap or sectoral funds may be risky, but they also carry the potential for higher returns.
The key is time horizon. If you invest in a small-cap fund for just six months, you’re gambling. But if you stay invested for 7–10 years, the ups and downs smooth out, and the probability of wealth creation increases. In mutual funds, time is the best antidote to volatility, though it never eliminates risk.
For example, investors who stayed invested in mid-cap funds through the 2008 financial crisis saw their portfolios recover and grow significantly by 2015. Those who exited early locked in losses.
Key Takeaways
From the factsheet and Riskometer, here are the main lessons:
- Investment objective: This is the guiding principle for how the fund manager invests.
- Open-ended vs Close-ended: Open-ended funds run indefinitely, while close-ended funds have a fixed maturity.
- Regular vs Direct plans: Regular plans involve distributor commissions, while direct plans save you that cost, boosting returns.
- IDCW vs Growth options: You can choose to receive IDCW payouts, reinvest them, or let profits compound in the growth option.
- Riskometer: A simple, SEBI-mandated tool that shows the risk level of the fund, helping investors make informed choices.