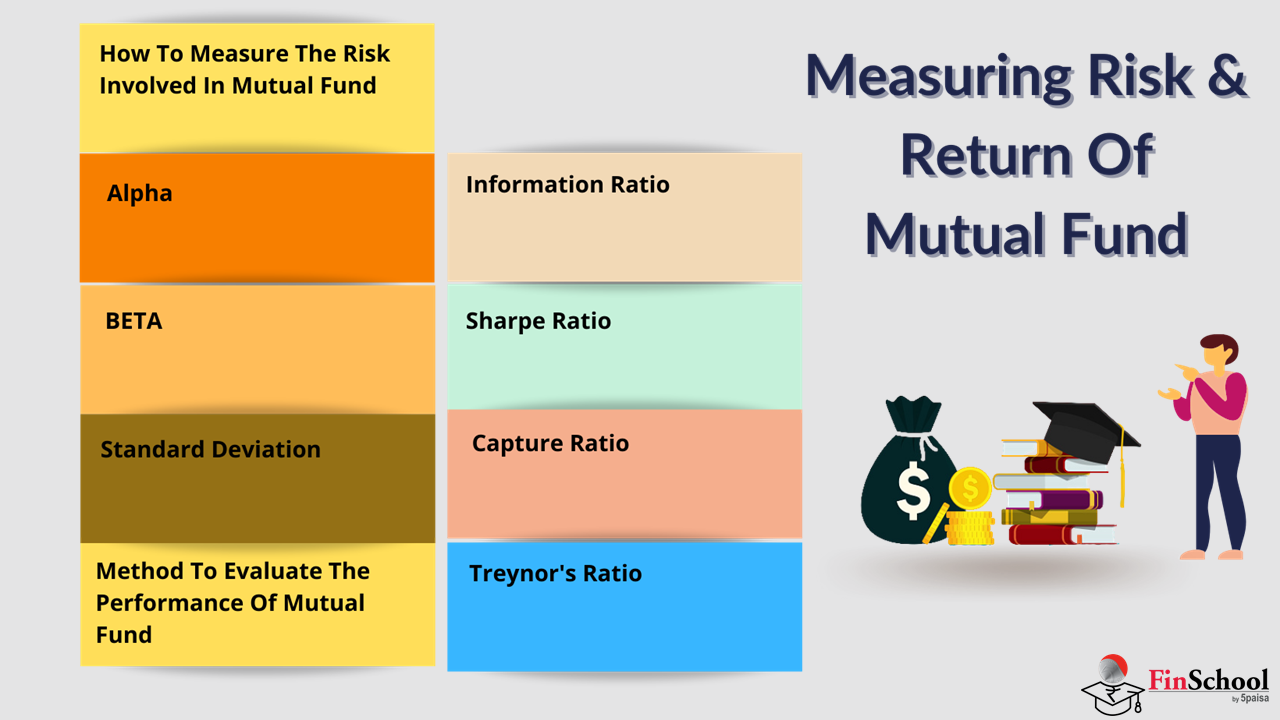

5.1 How To Measure The Risk Involved In Mutual Fund

Anand: How do we measure risk in funds?
Ridhima: We use ratios that show how volatile a fund is and how well it performs. These ratios help us compare funds based on more than their returns.
Most investors, when evaluating a mutual fund, instinctively chase the highest possible return. But returns alone are only half the story , every investment carries risk, and true success lies in whether the return earned actually justifies the risk taken. A fund that delivers solid returns without exposing investors to disproportionate volatility is far more valuable than one that simply posts an impressive number on paper.
A well-chosen mutual fund isn’t just about raw performance , it’s about efficiency: generating better returns than peers while taking on the same or lower risk. Judging that balance requires more than return figures alone; it calls for structured tools that quantify both risk and volatility. Fortunately, finance offers a set of statistical ratios built precisely for this purpose, letting investors look past marketing brochures and understand how a fund actually behaves across different market conditions, how consistent its performance really is, and whether the risk being taken is genuinely worth the reward.
Let’s explore the key measures that help decode risk in mutual funds.
5.2 Alpha

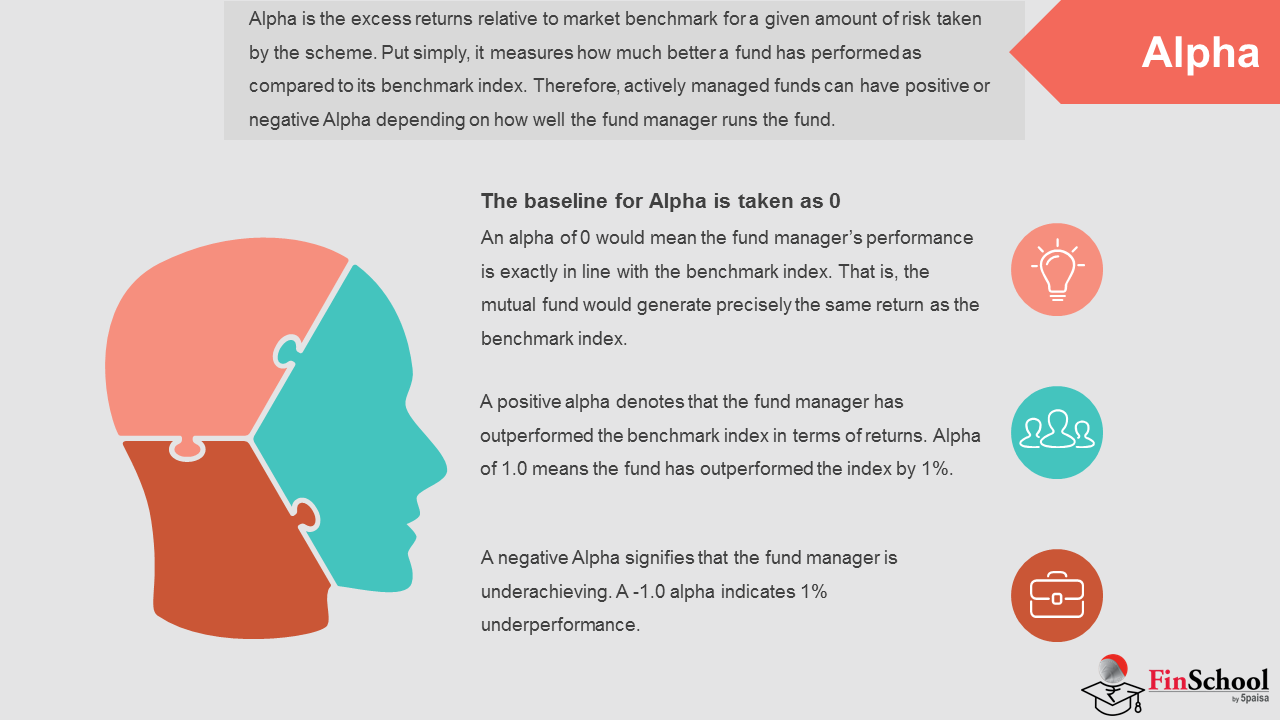
Alpha is one of the most important measures for evaluating actively managed funds. It represents the excess return a fund delivers relative to its benchmark, after accounting for the risk taken. In essence, Alpha answers a simple question:
Did the fund manager add value beyond what the market itself provided?
Definition
Alpha is expressed as a percentage.
- Alpha = 0→ The fund performed exactly in line with its benchmark.
- Positive Alpha→ The fund outperformed the benchmark.
- Negative Alpha→ The fund underperformed relative to the benchmark.
Why Alpha Matters
- For actively managed funds, Alpha is the ultimate test of skill — investors pay higher fees for active management precisely because they expect a manager to generate positive Alpha.
- For index funds, Alpha stays close to zero by design, since these funds aim to replicate the benchmark rather than beat it.
Illustrative Example
Suppose the NIFTY 50 index delivered 12% in a year.
- Fund A delivered 14% → Alpha = +2% (outperformance).
- Fund B delivered 10% → Alpha = −2% (underperformance).
This shows how Alpha isolates the manager’s genuine contribution beyond the market’s natural movement.
Real Fund Comparisons
Let’s consider two large-cap equity funds benchmarked against NIFTY 50:
|
Fund |
Benchmark Return |
Fund Return |
Alpha |
|
Axis Bluechip Fund |
12% |
16.21% |
+4.21% |
|
Canara Robeco Bluechip Equity Fund |
12% |
15.98% |
+3.98% |
Interpretation:
Axis Bluechip generated 4.21% more than the benchmark, reflecting strong fund management decisions.
Canara Robeco also outperformed, with 3.98% Alpha, indicating consistent value addition.
Both funds show that active management can justify itself when Alpha is meaningfully positive.
- Sustainability of Alpha: A single year’s Alpha could simply reflect luck or a temporary market anomaly. Consistently positive Alpha across multiple market cycles is a much stronger indicator of genuine manager skill.
- Risk Context: Alpha should always be read alongside Beta and the Sharpe Ratio — a high Alpha paired with excessive volatility may not suit a conservative investor.
- Investor Application: When comparing funds within the same category, Alpha helps identify which managers are truly adding value beyond a passive benchmark.
5.3 BETA
Anand: And what about Beta?
Ridhima: Beta measures how volatile a fund is compared to its benchmark.
Anand: If Beta is 1?
Ridhima: If the Beta is 1 then the fund moves like the benchmark. If it is than 1 then it means the fund has lower risk.. If it is more than 1 then it means the fund has higher volatility.
Understanding Beta and Its Role Alongside Alpha
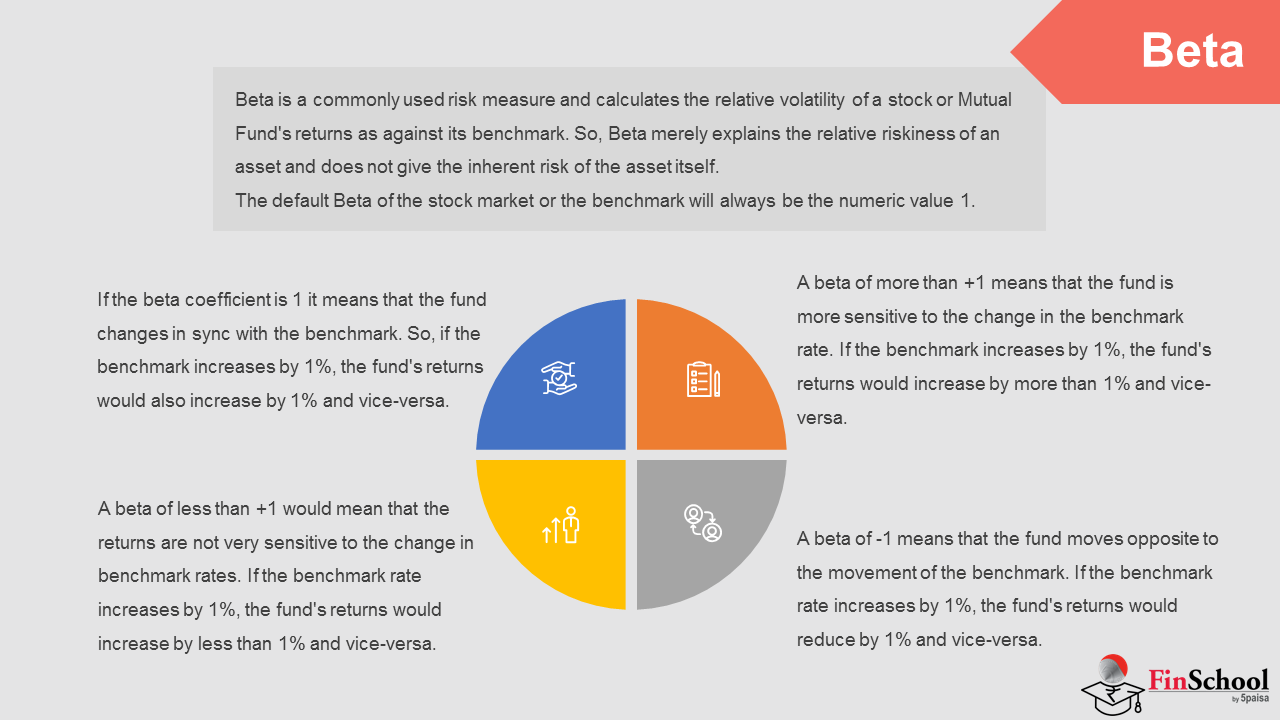
Beta is one of the most widely used measures of relative risk in mutual fund evaluation. It shows how volatile a fund is compared to its benchmark index. Where Alpha focuses on excess returns, Beta focuses purely on sensitivity to market movements.
How Beta Works
- Beta = 1→ The fund moves in lockstep with the benchmark — a 1% move in the benchmark implies roughly a 1% move in the fund.
- Beta < 1→ The fund is less volatile than the benchmark, cushioning losses during downturns but also capturing smaller gains during rallies.
- Beta > 1→ The fund is more volatile than the benchmark, magnifying both gains and losses.
- Beta = −1→ The fund moves inversely to the benchmark — if the benchmark rises 1%, the fund falls 1%.
Beta, then, doesn’t measure a fund’s absolute risk, but rather its riskiness relative to the market index.
Practical Example
Suppose the benchmark index falls by 1%:
- Fund X (Beta = 0.77) → Expected fall = 0.77%
- Fund Y (Beta = 0.86) → Expected fall = 0.86%
Both funds are less volatile than the benchmark, but Fund X is slightly more defensive since its Beta sits further below 1.
Combining Alpha and Beta
The real insight comes from analysing Alpha and Beta together:
|
Fund |
Alpha |
Beta |
Interpretation |
|
Axis Bluechip Fund |
+4.21 |
0.77 |
Outperformed benchmark significantly, with lower volatility |
|
Canara Robeco Bluechip Fund |
+3.98 |
0.86 |
Outperformed benchmark, but with slightly higher volatility |
Analysis:
- Axis Bluechip combines a higher Alpha (stronger excess returns) with a lower Beta (less volatility) — meaning investors are rewarded with superior returns while taking on relatively less risk.
- Canara Robeco also adds value, but with a Beta closer to 1, it’s more sensitive to market swings.
From a risk-adjusted perspective, Axis Bluechip is the more attractive option, since it pairs strong outperformance with reduced volatility.
5.4 Standard Deviation
Anand: What does Standard Deviation show?
Ridhima: Standard Deviation shows how much a funds returns vary. If the Standard Deviation is higher then it means the fund has ups and downs.
Anand: So a lower Standard Deviation is safer?
Ridhima: Exactly. A lower Standard Deviation means the fund has stable returns.
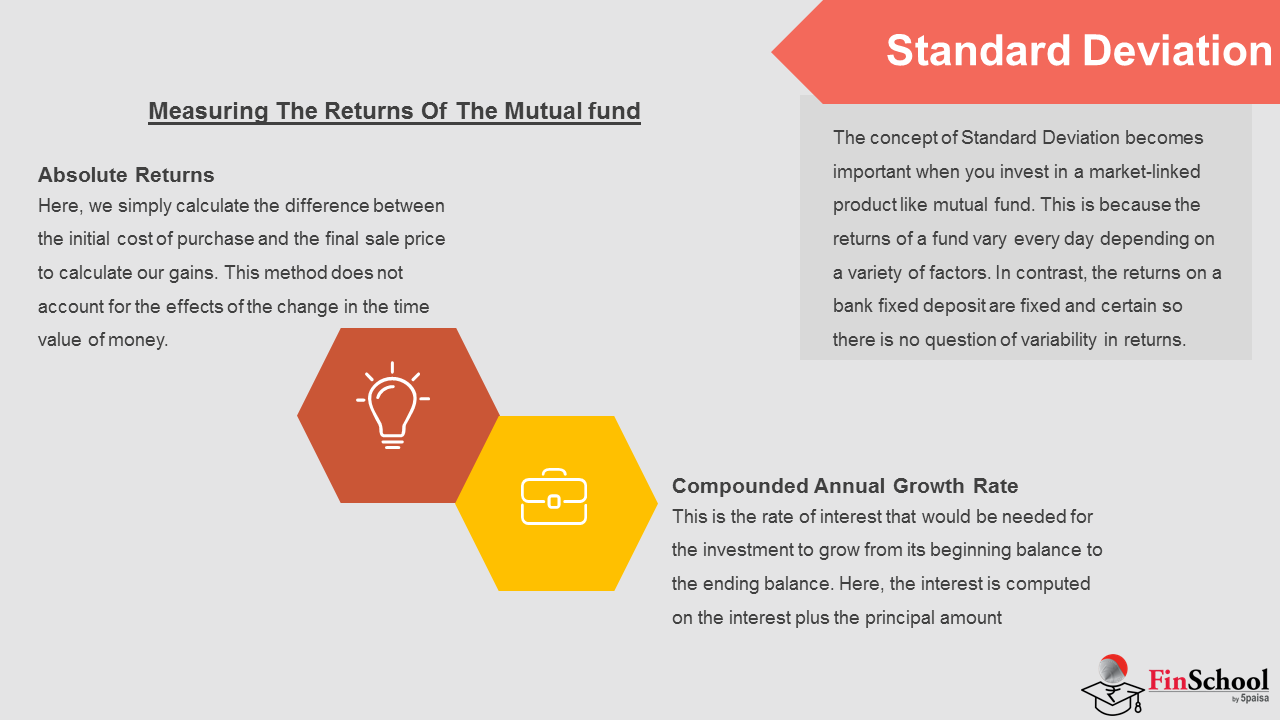
- Standard Deviation becomes especially relevant when you invest in a market-linked product like a mutual fund, since returns fluctuate daily based on a range of factors. A bank fixed deposit, by contrast, offers fixed and certain returns, so variability simply doesn’t come into play.
- Standard Deviation captures the volatility of a fund’s returns — a higher figure means greater variation, and vice versa. In technical terms, it measures the dispersion of returns from their average over a given period, generally calculated using trailing monthly total returns over 3, 5, or 10 years.
- For example, suppose a mutual fund delivers an average return of 10% over a period of time. As expected, it will have had some strong months and some weak ones, with returns swinging anywhere between +20% and −15%.
- This up-and-down trajectory in a fund’s NAV is precisely what Standard Deviation captures and expresses as an annualised figure.
For example, let’s consider the above two funds:
The Standard Deviation of the Axis fund is 17.43%, while that of the Canara Robeco fund is 18.64% — implying that the Canara fund carries somewhat more risk than the Axis fund.
To put this in context, if you invest ₹10,000 across both funds at the same time, by the end of the year the profit or loss could fall anywhere within this range:
Loss = Investment × (1 − SD)
Gains = Investment × (1 + SD)
The larger the Standard Deviation, the wider the range of possible gains or losses.
Measuring the Returns of the Mutual Fund
The following methods are used to measure the returns of a mutual fund investment:
Absolute Returns
- Here, gains are calculated simply as the difference between the initial purchase price and the final sale price. This method does not account for the time value of money.
Compounded Annual Growth Rate
- CAGR represents the rate of interest that would be needed for an investment to grow from its starting balance to its ending balance, with interest computed on both the principal and the accumulated interest.
- The formula for CAGR is: CAGR = (Ending Balance / Beginning Balance)^(1/number of years).
- For example, if ₹10,000 is invested and grows to ₹12,000 over 2 years, the CAGR is (12,000/10,000)^(1/2) = 9.54%.
- This method gives a more accurate picture of returns than absolute returns, since it accounts for the change in the value of money over time.
5.5 Method To Evaluate The Performance Of Mutual Fund

Anand: How do I check if a fund is performing well?
Ridhima: You should track if your portfolio value grows steadily. You should also compare it with similar funds monitor its consistency and see if it meets your goals.
- Selecting an investment is just the starting point — as time passes, you’ll need to keep monitoring how these investments are performing together within your portfolio to see whether you’re actually progressing toward your goals. Generally, progress simply means your portfolio’s overall value is rising steadily, even if one or two individual holdings have lost value along the way.
- If your investments show no gains, or your account value keeps slipping, you’ll need to figure out why and decide on your next step. Assessing performance properly means looking at your fund through several different lenses.
So let’s look at some of the most popular methods of evaluation for mutual funds:
5.6 Information Ratio
Anand: What’s the Information Ratio?
Ridhima: The Information Ratio measures the return a fund gives compared to its benchmark, adjusted for risk.
Anand: Is an Information Ratio better?
Ridhima: Yes that is right. A higher Information Ratio shows that the fund manager is consistently beating the benchmark.
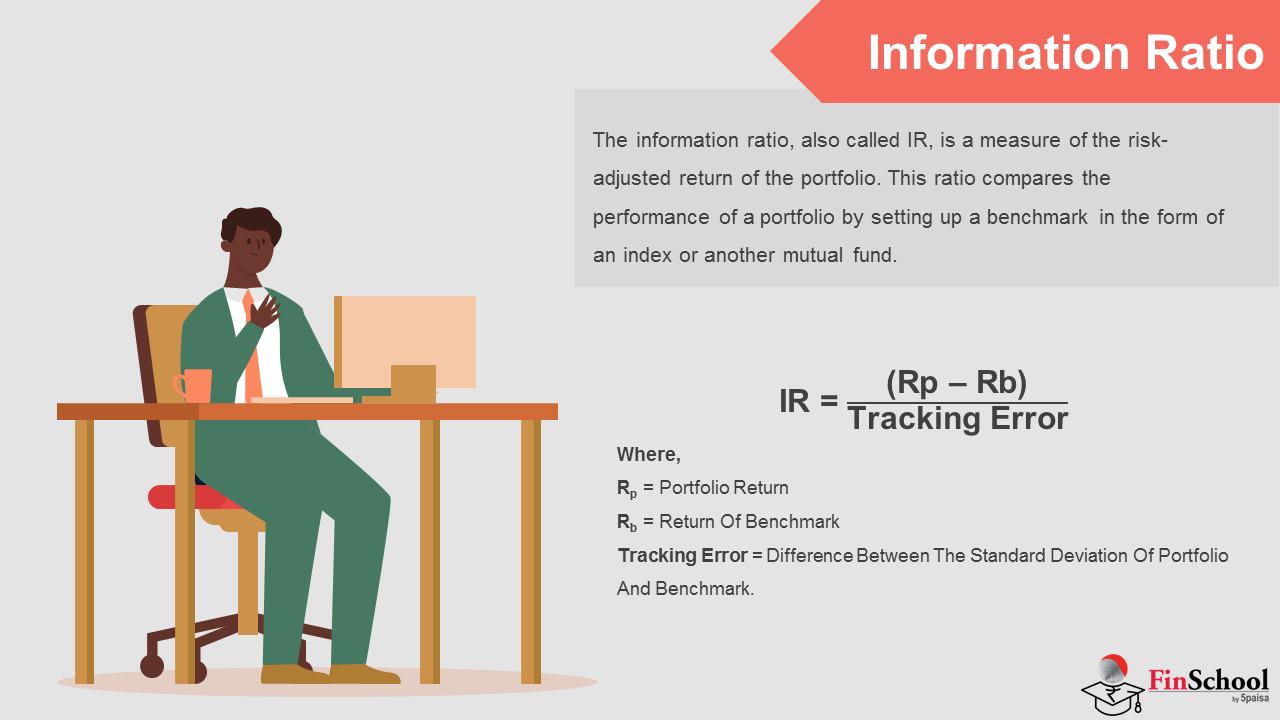
- The Information Ratio, often called IR, measures the risk-adjusted return of a portfolio by comparing its performance against a benchmark — usually a market index like the Nifty 50, though it could equally be an index representing a specific sector. In essence, it captures how well a portfolio is matching or exceeding its benchmark’s returns.
- It’s calculated by dividing the fund’s active return (the difference between the fund’s return and its benchmark’s return) by its tracking error (the standard deviation of that active return). The IR measures the fund’s performance relative to its benchmark while adjusting for the volatility of that gap — which is why it’s also known as the appraisal ratio.
IR = (Rp − Rb) / Tracking error, where
Rp = portfolio return
Rb = return of benchmark
Tracking error = standard deviation of the difference between portfolio and benchmark returns
Significance:
- Essentially, the Information Ratio tells an investor how much excess return was generated for the amount of excess risk taken relative to the benchmark. It tests a fund manager’s consistency, revealing whether they beat the benchmark by a wide margin in just a few months or by smaller margins consistently, month after month.
- For a given level of risk, a higher active return leads to a higher Information Ratio, reflecting greater consistency in a manager’s ability to deliver superior returns. The higher the ratio, the stronger the fund manager’s performance — and the ratio is especially useful when comparing funds that share a similar management style.
Example of Information Ratio
Suppose you’re deciding between two funds — Fund A and Fund B — and want to compare their Information Ratios using the Nifty 50 as the benchmark.
Fund A delivered 12% returns against a benchmark return of 10%, with a standard deviation of 6% for both fund and benchmark returns. Fund B also delivered 12% returns, but against a benchmark return of 8%, with a standard deviation of 9%.
Using the formula for Information Ratio:
- Fund A:IR = (12% − 10%) / 6% = 0.33
- Fund B:IR = (12% − 8%) / 9% = 0.44
Fund B’s Information Ratio is higher than Fund A’s, implying that Fund B is more consistent in its returns and has greater potential to deliver superior performance going forward.
Interpretation
A negative Information Ratio suggests the fund manager was unable to generate any excess return at all. An Information Ratio below 0.4 suggests the fund hasn’t produced meaningful excess returns over a sufficiently long period and may not be a strong investment choice. A ratio between 0.4 and 0.6 is generally considered good, while a ratio between 0.61 and 1 is regarded as an excellent investment.
5.7 Sharpe Ratio
Anand: And what about the Sharpe Ratio?
Ridhima: The Sharpe Ratio compares a funds returns with risk- returns, adjusted for volatility.
Anand: What’s a good Sharpe score?
Ridhima: A Sharpe score above 2 is really good.. A score above 3 is exceptional.
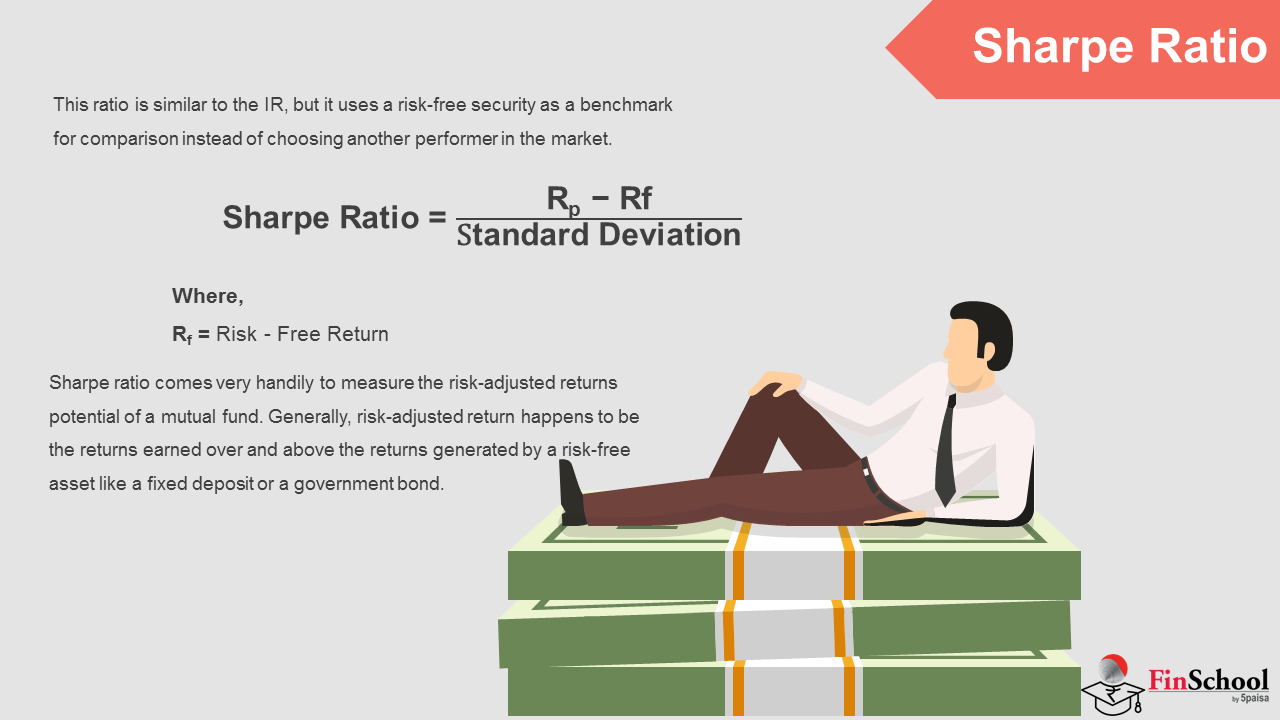
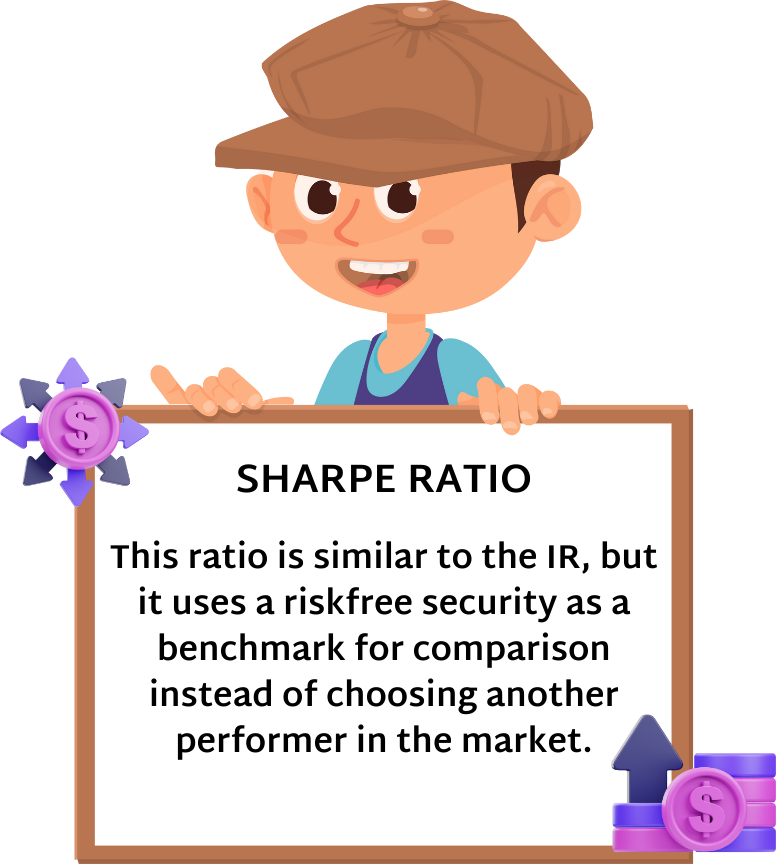
The Sharpe Ratio is similar to the Information Ratio, except it uses a risk-free security as its benchmark for comparison, rather than another actively managed fund.
Sharpe Ratio = (Rp − Rf) / Standard Deviation,
where Rf = risk-free return
- The Sharpe Ratio is a handy way to measure a fund’s risk-adjusted return potential. Risk-adjusted return, in essence, is the return earned above and beyond what a risk-free asset — such as a fixed deposit or government bond — would provide. This “extra” return is viewed in light of the additional risk an investor takes on by choosing something riskier, like an equity fund.
- The risk inherent in an investment is captured through its standard deviation, so a higher Sharpe Ratio indicates a fund is generating better returns for every additional unit of risk taken. It effectively justifies the fund’s underlying volatility, which is why the Sharpe Ratio is such a useful tool for comparing funds against one another.
Analysis and Interpretation
A higher Sharpe Ratio is always preferable to a lower one, since it shows the portfolio is making sound investment decisions rather than simply being swept along by the risk it carries. Here’s a general guide to interpreting Sharpe Ratio values:
Sharpe Ratio Grading Thresholds
- < 1: Not Good
- 1 – 1.99: Ok
- 2 – 2.99: Really Good
- > 3: Exceptional
Take a portfolio invested purely in Treasury bills, for example — these are considered risk-free, so there’s no volatility and no return above the risk-free rate, meaning the Sharpe Ratio would be zero.
Other portfolios that take on more risk might carry a Sharpe Ratio of 1, 2, or 3. Anything at or above 3 is generally considered an excellent measurement and, all else equal, a strong investment.
A ratio of 1, 2, or 3 essentially tells you how much additional return you’re earning for holding a riskier investment over a risk-free one — a direct measure of the compensation you’re receiving for taking on that extra risk.
Example — Growth Fund vs Conservative Fund
Growth Fund
- Portfolio Return: 18%
- Risk-Free Rate: 6%
- Standard Deviation: 8
Sharpe Ratio = (18 − 6) / 8 = 1.5
Conservative Fund
- Portfolio Return: 12%
- Risk-Free Rate: 6%
- Standard Deviation: 2
Sharpe Ratio = (12 − 6) / 2 = 3.0
Interpretation
At first glance, the Growth Fund looks more attractive, since it delivers a higher raw return (18% versus 12%). But once adjusted for risk, the Conservative Fund proves far more efficient — its Sharpe Ratio of 3.0 means it generates three units of excess return for every unit of risk taken, compared to just 1.5 for the Growth Fund. This illustrates that while aggressive funds may look appealing on the surface, conservative funds can sometimes deliver superior risk-adjusted performance, making them more reliable for long-term investors who value stability.
5.8 Capture Ratio
Anand: What is Capture Ratio?
Ridhima: The Capture Ratio shows how a fund performs in both bull and bear markets.
Anand: What’s Upside Capture?
Ridhima: Upside Capture measures how much a fund gains in rising markets.
Anand: And what about Downside Capture?
Ridhima: Downside Capture shows how much a fund limits its losses in falling markets. A lower Downside Capture is better.
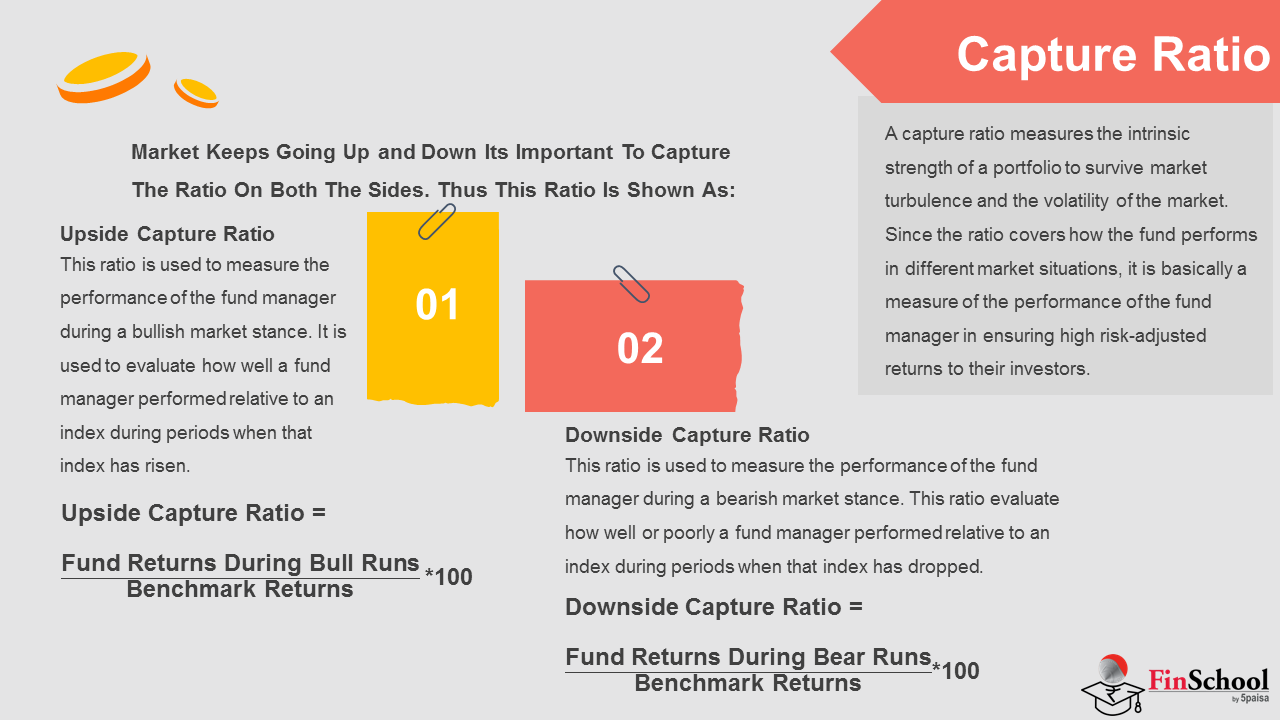
- The Capture Ratio measures a portfolio’s intrinsic strength in weathering market turbulence and volatility. Because it looks at how a fund performs across different market conditions, it’s fundamentally a measure of how well the fund manager delivers risk-adjusted returns to investors.
- Expressed as a percentage, it shows whether a fund has underperformed or outperformed a benchmark such as the Nifty or Sensex during market highs and lows, and is typically calculated over 1, 3, 5, or 10-year periods.
Since markets move in both directions, this ratio is broken into two components:
Upside Capture Ratio
- This ratio measures a fund manager’s performance during bullish periods — specifically, how well the fund performed relative to its benchmark index whenever that index rose. It’s calculated by dividing the fund’s return by the index’s return during up-market periods, then multiplying by 100: (Fund’s Return / Index Return) × 100. It’s typically computed using the fund’s monthly or annual returns during periods when the benchmark posted a positive return.
- A fund manager with an upside capture ratio above 100 has outperformed the index during rallies. An upside capture ratio of 125, for instance, means the manager outperformed the market by 25% during that period.
Upside Capture Ratio = (Fund returns during bull runs / Benchmark Returns) × 100
Downside Capture Ratio
- This ratio measures a fund manager’s performance during bearish periods — how well or poorly the fund did relative to its benchmark whenever that index fell. It’s calculated the same way, by dividing the fund’s return by the index’s return during down-market periods and multiplying by 100.
Downside Capture Ratio = (Fund returns during Bear runs / Benchmark Returns) × 100
- A downside capture ratio below 100 means the fund lost less than its benchmark during periods when the benchmark was in the red. A downside capture ratio of 82%, for instance, means the fund captured only 82% of the benchmark’s negative performance during that downturn.
- These ratios are typically published in a mutual fund’s fact sheet, and together they reveal a fund manager’s attitude toward risk and their ability to deliver stronger risk-adjusted returns.
Here is an example:
Consider the capture ratio of the Axis Bluechip Fund on a 3-year basis, sourced from the Morningstar India website.
- The fund has an upside capture ratio of 90, meaning it captured 90% of the index’s upward movement.
- Its downside capture ratio is 72, meaning it captured only 72% of the index’s downward movement.
In short, the upside capture ratio shows how much of the benchmark’s positive returns a fund captures, while the downside capture ratio shows how much of the benchmark’s negative returns it captures (or, ideally, avoids).
So what’s the ideal capture ratio? Investors generally want a fund that captures 100% of the upside, if not more, while keeping the downside capture ratio as low as possible.
In practice, a fund rarely excels at both simultaneously — in the example above, the fund’s upside capture is 90% while its downside capture is 72%. What matters most, whether you’re looking at upside or downside capture, is consistency across multiple years. The Axis Bluechip Fund’s downside capture ratios over 3, 5, and 10 years are 72, 69, and 76 respectively — a fairly consistent picture — while its upside capture ratios over the same periods are 90, 91, and 92, equally consistent.
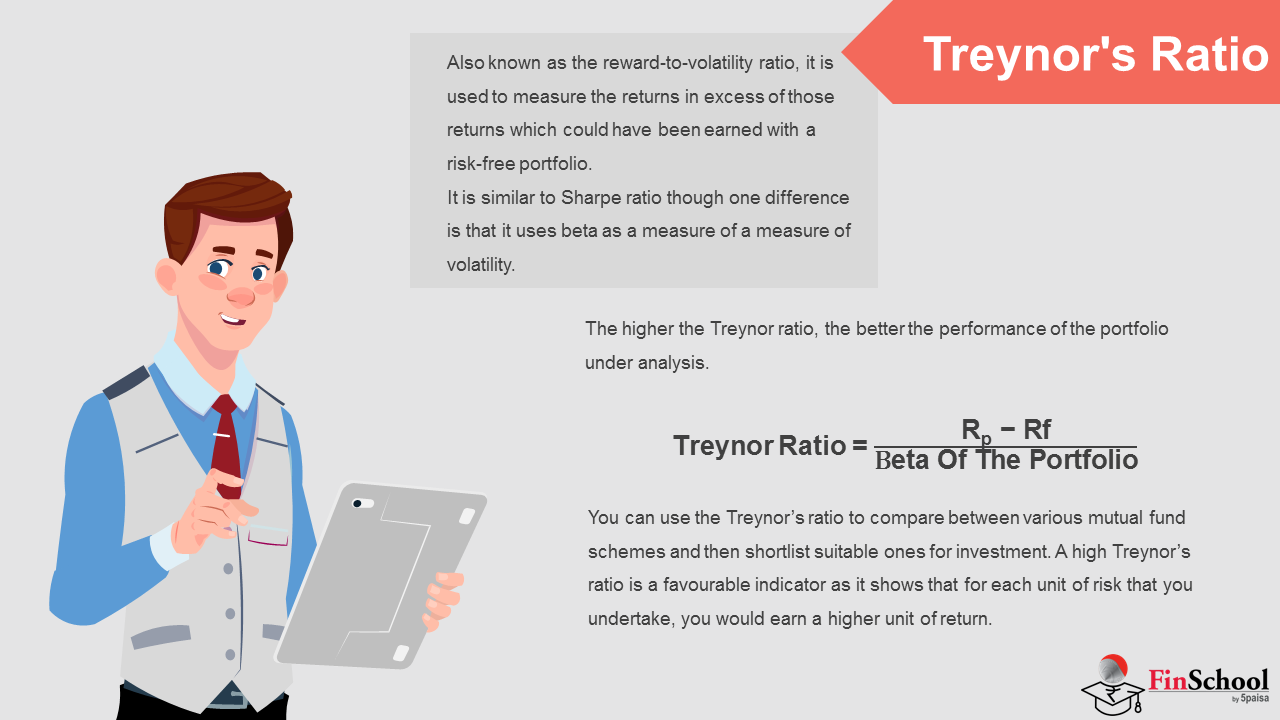
5.9 Treynor’s Ratio
Anand: Finally what’s Treynor’s Ratio?
Ridhima: Treynor’s Ratio measures returns per unit of risk using Beta.
Anand: So a Treynor’s Ratio means better?
Ridhima: Yes that is right. A Treynor’s Ratio shows that a fund gives more return, for the same level of systematic risk.
- Also known as the reward-to-volatility ratio, Treynor’s Ratio measures the returns earned in excess of what a risk-free portfolio would have delivered.
- It’s similar to the Sharpe Ratio, but uses Beta rather than standard deviation as its measure of volatility. Beta, as we’ve seen, captures a portfolio’s systematic risk — how closely a stock or portfolio moves with the index. A portfolio with a Beta greater than 1 is considered aggressive, while one with a Beta below 1 is considered defensive. The market index itself (Nifty or Sensex) always carries a Beta of 1.
- The higher the Treynor Ratio, the stronger the portfolio’s performance.
Treynor Ratio = (Rp − Rf) / Beta of the portfolio
- Treynor’s Ratio is a useful way to compare mutual fund schemes and shortlist suitable ones for investment. A high Treynor Ratio is a favourable sign, indicating that for each unit of risk taken, you’d earn a higher unit of return.
- For example, suppose one fund has a Treynor Ratio of 2 and another has a ratio of 3. In the first fund, taking on 1% of risk earns you a 2% return; in the second, that same 1% of risk earns you 3%. For the same amount of risk, the second fund offers greater return potential and is, therefore, the better alternative.
When to apply Sharpe and when to apply Treynor ratio?
- As mentioned earlier, the key difference between Sharpe and Treynor is that the former uses standard deviation as the denominator, while the latter uses Beta. Standard deviation captures a portfolio’s total risk, while Beta captures only its systematic risk.
- Every business carries unsystematic risks specific to that company or industry, alongside systematic risks — inflation, interest rates, government policy, and so on — that apply to the entire economy. As a result, the Sharpe Ratio works better for a portfolio that isn’t well diversified, while the Treynor Ratio is the better measure for portfolios that are well diversified.