11.1. પ્રતિરોધક

ટેક્નિકલ એનાલિસિસમાં, સપોર્ટ અને રેઝિસ્ટન્સ મૂળભૂત અને મહત્વપૂર્ણ કલ્પનાઓ છે જે વેપારીઓને સમજવામાં મદદ કરે છે કે કી લેવલ પર કિંમત કેવી રીતે વર્તે છે. ટેક્નિકલ એનાલિસિસમાં સપોર્ટ એ પ્રાઇસ ઝોનનો સંદર્ભ આપે છે જ્યાં સ્ટૉકને વધુ ઘટતા અટકાવવા માટે પૂરતું વ્યાજ ખરીદવાનું મજબૂત લાગે છે. તે ફ્લોર અથવા સુરક્ષા નેટ તરીકે કાર્ય કરે છે, અને જ્યારે કિંમત તેની નજીક આવે છે, ત્યારે ખરીદદારો સામાન્ય રીતે હસ્તક્ષેપ કરે છે, જે કિંમતને બૅકઅપ આપે છે. આનું કારણ એ છે કે વેપારીઓને પ્રવેશ માટે સ્ટૉક અપીલ મળે છે કારણ કે તેઓ માને છે કે તે લેવલ પર ઓછું મૂલ્ય ધરાવે છે.
બીજી તરફ, રેઝિસ્ટન્સ એ એક કિંમત ઝોન છે જ્યાં વેચાણનું દબાણ ખરીદવાના વ્યાજથી વધુ હોય છે, જે કિંમતને વધુ વધારવાથી અટકાવે છે. જ્યારે કિંમત આ સ્તરની નજીક હોય ત્યારે તે છતની જેમ કાર્ય કરે છે, વેચાણકર્તાઓ પ્રભુત્વ કરવાનું શરૂ કરે છે, જે ઘણીવાર રિવર્સલ અથવા એકત્રીકરણ તરફ દોરી જાય છે. વેપારીઓ આ લેવલને મોંઘા અથવા ઓવરબાઉટ તરીકે જુએ છે, જે તેમને નફો બુક કરવા અથવા ટૂંકા હોદ્દાઓ શરૂ કરવા માટે પ્રોત્સાહિત કરે છે.
આ લેવલ ફિક્સ્ડ પોઇન્ટ નથી પરંતુ તેના બદલે એવા ઝોન છે જે સમય જતાં વિકસિત થાય છે કારણ કે કિંમત ચોક્કસ લેવલ પર વારંવાર પ્રતિક્રિયા આપે છે. તેને ઐતિહાસિક કિંમતની કાર્યવાહી, ખાસ કરીને એવા વિસ્તારોમાં જોઈને ઓળખી શકાય છે જ્યાં કિંમત એકથી વધુ વખત પરત કરવામાં આવી છે. પાઇવટ પોઇન્ટ, મૂવિંગ એવરેજ અને ફિબોનાચી રિટ્રેસમેન્ટ લેવલ જેવા ટૂલ્સ ઘણીવાર સપોર્ટ અને રેઝિસ્ટન્સ ઝોન સાથે જોડાય છે, જે તેમની શક્તિમાં વધુ વિશ્વસનીયતા ઉમેરે છે.
વેપારીઓ આ લેવલનો વિવિધ રીતે ઉપયોગ કરે છે. ઉદાહરણ તરીકે, નજીકના સપોર્ટ અને વેચાણની નજીકની રેઝિસ્ટન્સની ખરીદી એક સામાન્ય વ્યૂહરચના છે. તેઓ લાંબા ટ્રેડ અને ટૂંકા ટ્રેડ માટે પ્રતિરોધક ઉપરના સપોર્ટ માટે સ્ટૉપ-લૉસ સેટ કરવા માટે તાર્કિક સ્થળો તરીકે પણ કામ કરે છે. જ્યારે કિંમત મજબૂત વૉલ્યુમ સાથે પ્રતિરોધક સ્તર દ્વારા તૂટી જાય છે, ત્યારે તે ઘણીવાર અપટ્રેન્ડની સંભવિત ચાલુ રાખવાનું સંકેત આપે છે. તેવી જ રીતે, નીચે આપેલ સપોર્ટનું બ્રેકડાઉન વધુ નુકસાન દર્શાવી શકે છે.
સારાંશમાં, સપોર્ટ અને રેઝિસ્ટન્સ ખરીદદારો અને વેચાણકર્તાઓ વચ્ચે મનોવૈજ્ઞાનિક યુદ્ધભૂમિ છે. તેમને ઓળખવાથી વેપારીઓને બજારના વર્તનની અપેક્ષા રાખવામાં, જોખમનું સંચાલન કરવામાં અને વધુ માહિતગાર નિર્ણયો લેવામાં મદદ મળે છે. જ્યારે વૉલ્યુમ, કેન્ડલસ્ટિક પેટર્ન અને ટ્રેન્ડલાઇન જેવા અન્ય સૂચકો સાથે જોડાય છે, ત્યારે તેઓ મજબૂત વેપાર સેટઅપ્સ બનાવવા માટે શક્તિશાળી સાધનો બની જાય છે. ચાલો આપણે તેમાંથી દરેકને વિગતવાર સમજીએ
રેઝિસ્ટન્સ, જેમ શબ્દનો અર્થ છે, તે એક કિંમત ઝોન છે જે સ્ટૉક અથવા ઇન્ડેક્સમાં ઉપરની હિલચાલને રોકવા અથવા ધીમી કરે છે. તે એક એવા સ્તરને રજૂ કરે છે જ્યાં વેચાણકર્તાઓ મોટી સંખ્યામાં ઉભરવાની અપેક્ષા છે, સપ્લાય-હેવી વાતાવરણ બનાવે છે જે કિંમતમાં વધારો કરવો મુશ્કેલ બનાવે છે. આ લેવલ સામાન્ય રીતે વર્તમાન બજાર કિંમતથી ઉપર સ્થિત છે અને બુલિશ મોમેન્ટમ માટે મનોવૈજ્ઞાનિક અવરોધ તરીકે કાર્ય કરે છે.
જ્યારે કોઈ સ્ટૉક તેના રેઝિસ્ટન્સ ઝોનનો સંપર્ક કરે છે, ત્યારે તે ઘણીવાર બજાર વેચાણના દબાણને શોષી લે છે અથવા તેને એકત્રિત કરે છે. જો પુરવઠો માંગથી વધુ હોય, તો કિંમત રિવર્સ થઈ શકે છે અને ઘટાડવાનું શરૂ કરી શકે છે. વેપારીઓ માટે, પ્રતિરોધ એ એક મહત્વપૂર્ણ સંદર્ભ બિંદુ છે-ખાસ કરીને અપટ્રેન્ડમાં-કારણ કે તે ઘણીવાર સંભવિત ટર્નિંગ પોઇન્ટ અથવા નફો બુક કરવાની તકને સંકેત આપે છે.
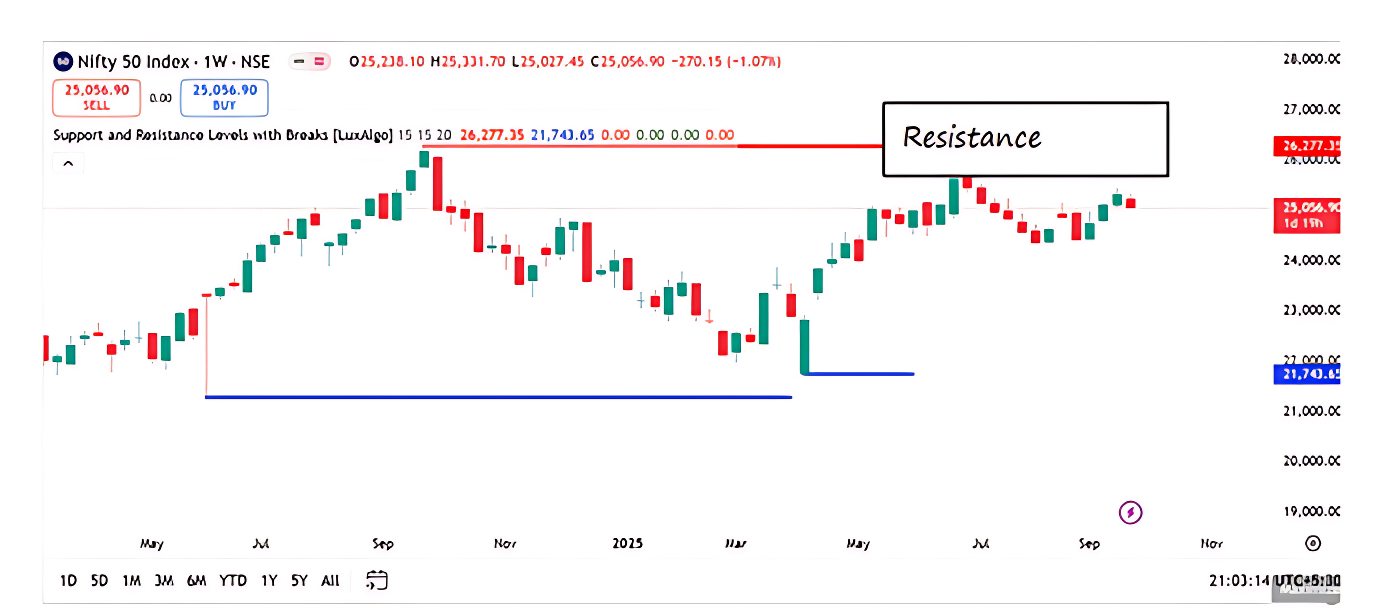
નિફ્ટી 50 વીકલી ચાર્ટ કૉન્સેપ્ટ ઑફ રેઝિસ્ટન્સના આધારે સ્પષ્ટપણે ₹26,277.35 નજીક ડ્રો કરેલ હોરિઝોન્ટલ લાઇન દ્વારા દર્શાવવામાં આવે છે. આ લેવલ એક પ્રાઇસ ઝોનને ચિહ્નિત કરે છે જ્યાં અનેક પ્રયત્નો હોવા છતાં ઇન્ડેક્સ અગાઉ વધુ આગળ વધવા માટે સંઘર્ષ કર્યો છે.
ટેક્નિકલ શબ્દોમાં, રેઝિસ્ટન્સ એ એક કિંમતનું સ્તર છે જ્યાં વેચાણનું દબાણ ખરીદવાના વ્યાજથી વધુ હોય છે, જે સ્ટૉક અથવા ઇન્ડેક્સ માટે વધતા જતા રહેવાનું મુશ્કેલ બનાવે છે. વેપારીઓ ઘણીવાર અપેક્ષા રાખે છે કે જ્યારે કિંમત આ ઝોનનો સંપર્ક કરે છે, ત્યારે તે ક્યાં તો સ્ટૉલ, કન્સોલિડેટ અથવા રિવર્સ ડાઉનવર્ડ કરી શકે છે. આ થાય છે કારણ કે ઘણા બજારના સહભાગીઓ નફો બુક કરવા અથવા ટૂંકા સ્થિતિઓ શરૂ કરવા માટે આ સ્તરને સારો બિંદુ તરીકે જુએ છે, જેના કારણે પુરવઠામાં વધારો થાય છે.
ચાર્ટ જોઈને, તમે જોઈ શકો છો કે ઇન્ડેક્સ ઉપરની ટ્રેજેક્ટરી પર છે, જે ગ્રીન કેન્ડલસ્ટિકની શ્રેણી બનાવે છે. જો કે, તે ₹26,277.35 ની નજીક છે. માર્ક, મોમેન્ટમ ફેડ થવાનું શરૂ થાય છે. આ રેઝિસ્ટન્સ પ્રાઇસ ટેસ્ટ લેવલની નજીકનું એક ક્લાસિક વર્તન છે, ઉપલબ્ધ માંગને શોષી લે છે, અને પછી ક્યાં તો પાછું ખેંચે છે અથવા એકીકૃત કરે છે.
આ રેઝિસ્ટન્સ ઝોન ખાસ કરીને વધતા બજારમાં વેપારીઓ માટે મહત્વપૂર્ણ બની જાય છે. તે નિર્ણય બિંદુ તરીકે કાર્ય કરે છે: જો કિંમત મજબૂત વૉલ્યુમ સાથે તેનાથી ઉપર બ્રેક કરે છે, તો તે અપટ્રેન્ડની ચાલુ રાખવાનું સંકેત આપી શકે છે. પરંતુ જો કિંમત તોડવામાં નિષ્ફળ જાય, તો તે ટૂંકા ગાળાના સુધારો અથવા રિવર્સલને ટ્રિગર કરી શકે છે.
સારાંશમાં, તમારા ચાર્ટ પર ₹26,277.35 નું લેવલ રેઝિસ્ટન્સનું એક ક્લાસિક ઉદાહરણ છે, જ્યાં કિંમત અગાઉ ટોચ પર છે અને જ્યાં વેપારીઓ બ્રેકઆઉટ અથવા રિવર્સલના ચિહ્નો માટે નજીકથી નજર રાખશે.
11.2 સપોર્ટ
ટેક્નિકલ એનાલિસિસમાં સપોર્ટ, એક કિંમતનું સ્તર દર્શાવે છે જ્યાં સ્ટૉક અથવા ઇન્ડેક્સ તેને વધુ ઘટતા અટકાવવા માટે પૂરતું વ્યાજ ખરીદવાનું વલણ ધરાવે છે. આ એક ઝોન છે જ્યાં માંગ સામાન્ય રીતે સપ્લાયથી વધુ હોય છે, જેના કારણે કિંમત સ્થિર થાય છે અથવા ઉપર પાછા બાઉન્સ થાય છે. વેપારીઓ એક પ્રકારના આધાર તરીકે સપોર્ટ જુએ છે, એક સ્તર જ્યાં બજારમાં અગાઉ ઘટાડા દરમિયાન ઉલટાવવામાં આવ્યો છે અથવા અટકાવવામાં આવ્યો છે.
જ્યારે કિંમત સપોર્ટ લેવલ પર પહોંચે છે, ત્યારે ઘણા સહભાગીઓ તેને હોલ્ડ કરવાની અપેક્ષા રાખે છે, અને તેઓ ખરીદી ઑર્ડર આપવાનું શરૂ કરે છે. આ સામૂહિક વર્તન સ્તરને મજબૂત બનાવે છે, જે તેને ભવિષ્યની કિંમતની ક્રિયા માટે એક મનોવૈજ્ઞાનિક એન્કર બનાવે છે. જો કિંમત સપોર્ટથી બાઉન્સ થાય છે, તો તે તે લેવલની તાકાતની પુષ્ટિ કરે છે. જો કે, જો કિંમત નિર્ણાયક રીતે તેની નીચે બ્રેક થાય છે, ખાસ કરીને ઉચ્ચ વૉલ્યુમ સાથે, તે ડાઉનટ્રેન્ડની ચાલુ રાખવાનું સંકેત આપી શકે છે, અને બ્રોકન સપોર્ટ પછી નવા પ્રતિરોધ તરીકે કાર્ય કરી શકે છે.
ઐતિહાસિક કિંમત ડેટા, પાઇવોટ પૉઇન્ટ, મૂવિંગ એવરેજ અથવા ફિબોનાચી રિટ્રેસમેન્ટ ઝોનનો ઉપયોગ કરીને સપોર્ટ લેવલની ઓળખ કરી શકાય છે. તેઓ ખાસ કરીને એન્ટ્રી પૉઇન્ટ, સ્ટૉપ-લૉસ પ્લેસમેન્ટ અને રિસ્ક મેનેજમેન્ટની યોજના બનાવવા માટે ઉપયોગી છે. ઉદાહરણ તરીકે, જો કોઈ વેપારી સ્ટૉક ખરીદવા માંગે છે, તો મજબૂત સપોર્ટ લેવલની નજીક દાખલ થવાથી સખત સ્ટૉપ-લોસ અને વધુ સારા રિવૉર્ડ-ટુ-રિસ્ક રેશિયોની મંજૂરી મળે છે.
સારાંશમાં, સપોર્ટ એ છે કે જ્યાં માર્કેટ કહે છે, આ કિંમત ખરીદદારોને આકર્ષિત કરવા માટે પૂરતી ઓછી છે. આ સ્તરને ઓળખવા અને આદર કરવાથી વેપારીઓને વધુ માહિતગાર અને આત્મવિશ્વાસપૂર્ણ નિર્ણયો લેવામાં મદદ મળે છે.

નિફ્ટી 50 વીકલી ચાર્ટ પર, ₹21,740.63 ની નજીક ડ્રો કરેલ હોરિઝોન્ટલ બ્લૂ લાઇન દ્વારા સપોર્ટની કલ્પના સ્પષ્ટપણે દર્શાવવામાં આવે છે. આ લેવલ એક પ્રાઇસ ઝોનનું પ્રતિનિધિત્વ કરે છે જ્યાં ઇન્ડેક્સને અગાઉ મજબૂત ખરીદીનું વ્યાજ મળ્યું છે, જે વધુ ઘટાડાને અટકાવે છે. ટેક્નિકલ એનાલિસિસમાં, સપોર્ટ એ એક મહત્વપૂર્ણ ક્ષેત્ર છે જ્યાં માંગ ઓવરપાવર સપ્લાય કરે છે, જેના કારણે કિંમત સ્થિર અથવા ઉપર ઉપર જાય છે. તે મનોવૈજ્ઞાનિક અને માળખાકીય માળ તરીકે કાર્ય કરે છે, જ્યારે ઇન્ડેક્સ આ લેવલ પર પહોંચે છે, ત્યારે વેપારીઓ રિન્યુ કરેલ સંચયને કારણે સંભવિત રિવર્સલ અથવા એકત્રીકરણની અપેક્ષા રાખે છે.
ચાર્ટ જોઈને, અમે દેખીએ છીએ કે કિંમતમાં નોંધપાત્ર ઘટાડો થયા પછી, ઇન્ડેક્સે ₹21,740.63 લેવલનો સંપર્ક કર્યો અને રિકવર કરવાનું શરૂ કર્યું. આ વર્તન સપોર્ટ ઝોનની નજીક સામાન્ય છે, જ્યાં બેરિશ મોમેન્ટમ ધીમી થાય છે અને કેન્ડલસ્ટિક પેટર્ન હેઝિટેશન અથવા રિવર્સલના લક્ષણો બતાવવાનું શરૂ કરે છે - જેમ કે લાંબા નીચલા વિક, નાના શરીરો અથવા બુલિશ એન્ગલ્ફિંગ ફોર્મેશન. આ સિગ્નલ સૂચવે છે કે વિક્રેતાઓ નિયંત્રણ ગુમાવી રહ્યા છે અને ખરીદદારો સ્તરને બચાવવા માટે આગળ વધી રહ્યા છે.
તાજેતરની કિંમતની ક્રિયામાં આ સપોર્ટ ઝોનનું મહત્વ તેની ભૂમિકા દ્વારા વધારે છે. જેમ ઇન્ડેક્સ ₹21,740.63 થી વધુનું એકત્રીકરણ કરે છે, તેમ તે પુષ્ટિ કરે છે કે આ લેવલને બજારના સહભાગીઓ દ્વારા આદર આપવામાં આવી રહ્યો છે. જો કિંમત આ ઝોનથી ઉપર હોલ્ડ કરવાનું ચાલુ રાખે છે અને વધતા વૉલ્યુમ સાથે બુલિશ પેટર્ન બનાવે છે, તો તે નવા ઉપરના પગની શરૂઆતને સૂચવી શકે છે. જો કે, જો કિંમત નિર્ણાયક રીતે આ સપોર્ટથી નીચે બ્રેક થાય છે, તો તે ઊંડા સુધારાને ટ્રિગર કરી શકે છે, જેમાં વેપારીઓ સંભવિત સ્થિરતા માટે આગામી નીચા સપોર્ટ લેવલ તરફ જોઈ રહ્યા છે.
સારાંશમાં, ₹21,740.63 નું લેવલ બજારની તાકાત અને આયોજનની એન્ટ્રીઓનું મૂલ્યાંકન કરતા વેપારીઓ માટે એક મહત્વપૂર્ણ સંદર્ભ બિંદુ તરીકે કાર્ય કરે છે. તે સામૂહિક બજાર મનોવિજ્ઞાનને પ્રતિબિંબિત કરે છે-જ્યાં ભય નબળો થવાનું શરૂ કરે છે અને આત્મવિશ્વાસ બનાવવાનું શરૂ કરે છે. આ જેવા સપોર્ટ ઝોન માત્ર ટેકનિકલ માર્કર નથી; તેઓ ડાયનેમિક બેટલગ્રાઉન્ડ છે જ્યાં ખરીદદારો અને વેચાણકર્તાઓ વચ્ચે સંતુલન, ઘણીવાર બજારની દિશાના આગામી તબક્કાને આકાર આપે છે.
11.3 સપોર્ટ અને રેઝિસ્ટન્સનું નિર્માણ

- ડેટા પૉઇન્ટ લોડ કરો :સપોર્ટ અને રેઝિસ્ટન્સ લેવલનું નિર્માણ શરૂ કરવા માટે, પ્રથમ પગલું તમારા ટ્રેડિંગ ઉદ્દેશના આધારે ઐતિહાસિક કિંમતના ડેટાની યોગ્ય રકમ લોડ કરવાનું છે. ટૂંકા ગાળાના વિશ્લેષણ માટે, જેમ કે ઇન્ટ્રાડે અથવા બાય-ટુડે-સેલ-ટુમોરો સ્ટ્રેટેજી, ઓછામાં ઓછા ત્રણથી છ મહિનાના ડેટાને લોડ કરવું આદર્શ છે. લાંબા ગાળાના વિશ્લેષણ માટે, ખાસ કરીને સ્વિંગ ટ્રેડિંગ માટે ઉપયોગી, બારથી અઢાર મહિનાની વ્યાપક વિન્ડોની ભલામણ કરવામાં આવે છે. જ્યારે વધુ ડેટા લોડ કરવામાં આવે છે, ત્યારે ચાર્ટ સંકુચિત દેખાય છે, જે સામાન્ય છે અને વ્યાપક કિંમતના વર્તનને ઓળખવામાં મદદ કરે છે.
- પ્રાઇસ ઍક્શન ઝોન ઓળખો : એકવાર ડેટા થયા પછી, આગળનું પગલું પ્રાઇસ ઍક્શન ઝોનને ઓળખવાનું છે. આ ચાર્ટ પરના વિસ્તારો છે જ્યાં કિંમતમાં સંકોચ અથવા રિવર્સલ દર્શાવવામાં આવ્યું છે. જ્યારે કિંમત ઉપરની ચાલ પછી વધુ આગળ વધવા માટે સંઘર્ષ કરે છે, નીચેની ચાલ પછી આગળ વધવામાં અચકાવે છે, અથવા કોઈ ચોક્કસ સ્તરે દિશામાં તીવ્ર રીવર્સ કરે છે ત્યારે પ્રાઇસ ઍક્શન ઝોનને ઓળખી શકાય છે. આ ઝોન એવા વિસ્તારોને પ્રતિબિંબિત કરે છે જ્યાં બજારના સહભાગીઓએ મજબૂત પ્રતિક્રિયા આપી છે, જે તેમને સમર્થન અથવા પ્રતિરોધ માટે સંભવિત ઉમેદવારો બનાવે છે.

એકથી વધુ કિંમતના ઍક્શન ઝોનને જોયા પછી, કી તેમાંથી ઓછામાં ઓછા ત્રણને સંરેખિત કરવું છે જે સમાન કિંમતના સ્તરની આસપાસ થાય છે. આ સંરેખન તે સ્તર માટે સમર્થન અથવા પ્રતિરોધ તરીકે કાર્ય કરવા માટે કેસને મજબૂત બનાવે છે. જો કે, આ ઝોન સમય જતાં બહાર આવે તે મહત્વપૂર્ણ છે. ઉદાહરણ તરીકે, જો મેની શરૂઆતમાં એક ઝોનની ઓળખ કરવામાં આવે છે, તો આગળ આદર્શ રીતે મેના અંતથી અથવા તેનાથી આગળ હોવું જોઈએ. આ ઝોન વચ્ચે સમયનો વધુ અંતર, વધુ વિશ્વસનીય સ્તર બની જાય છે.
ક્ષૈતિજ લાઇન સાથે ઝોનને ગોઠવો: અંતિમ પગલું એ સંરેખિત કિંમત ક્રિયા ઝોનને જોડતી હોરિઝોન્ટલ લાઇન દોરવાનું છે. જો આ લાઇન વર્તમાન બજાર કિંમતથી નીચે છે, તો તેને સપોર્ટ લેવલ માનવામાં આવે છે. જો તે ઉપર હોય, તો તે પ્રતિરોધક સ્તર બની જાય છે. તકનીકી વિશ્લેષણમાં વિઝ્યુઅલ અર્થઘટનનો સમાવેશ થાય છે, તેથી હંમેશા અંદાજિત માર્જિન હોય છે. તેથી, ચોક્કસ કિંમતને સૂચવવાને બદલે, ઓળખાયેલ સ્તરની આસપાસની શ્રેણીને વ્યાખ્યાયિત કરવું વધુ વ્યવહારુ છે. આ રેન્જ એક બફર તરીકે કાર્ય કરે છે, જે સ્વીકારે છે કે કિંમત ભાગ્યે જ એક નંબર પર પરંતુ ઝોનને બદલે પ્રતિક્રિયા આપે છે.
સ્તર વ્યાખ્યાયિત કરો: જ્યારે આ પદ્ધતિનો ઉપયોગ કરીને સપોર્ટ અને રેઝિસ્ટન્સ લેવલ બંનેની ઓળખ કરવામાં આવે છે, ત્યારે તેઓ વેપાર આયોજન માટે મૂલ્યવાન માહિતી પ્રદાન કરી શકે છે. ઉદાહરણ તરીકે, જો વર્તમાન કિંમત સપોર્ટ અને રેઝિસ્ટન્સ ઝોન વચ્ચે સ્થિત હોય, તો વેપારી સપોર્ટ પર લક્ષ્ય સાથે નજીકના પ્રતિરોધને ટૂંકાવવાનું વિચારી શકે છે, અથવા પ્રતિરોધક લક્ષ્ય સાથે લાંબા સમય સુધી સપોર્ટ જવાનું વિચારી શકે છે. આ અભિગમની અસરકારકતા વિશ્લેષણમાં ઉપયોગમાં લેવાતા પ્રાઇસ ઍક્શન ઝોનની સ્પષ્ટતા અને જગ્યા પર આધારિત છે
11.4 સપોર્ટ અને રેઝિસ્ટન્સની વિશ્વસનીયતા

સપોર્ટ અને રેઝિસ્ટન્સ લેવલ મેજિક લાઇન્સ નથી જે રિવર્સલની ગેરંટી આપે છે-તેઓ સંભવિતતા ઝોન જેવા વધુ છે. તેઓ સૂચવે છે કે કિંમત ક્યાં પ્રતિક્રિયા કરી શકે છે, તે ક્યાં જ જોઈએ નહીં. તેમને હવામાનની આગાહી તરીકે વિચારો: જો આકાશમાં અંધકાર અને ભેજ વધે છે, તો વરસાદની સંભાવના છે-પરંતુ ચોક્કસ નથી. તેવી જ રીતે, જ્યારે કિંમત જાણીતા પ્રતિરોધ અથવા સપોર્ટનો સંપર્ક કરે છે, ત્યારે રિવર્સલ શક્ય છે, પરંતુ વચન આપવામાં આવતું નથી.
₹684 માં ટાટા મોટર્સ ટ્રેડિંગનું ઉદાહરણ લો. જો ઐતિહાસિક ડેટા દર્શાવે છે કે જ્યારે પણ સ્ટૉક ₹710 નજીક હોય, ત્યારે તે વધુ આગળ વધવા માટે સંઘર્ષ કરે છે અને ઘણીવાર પાછા ખેંચે છે, તો વેપારીઓ રેઝિસ્ટન્સ ઝોન તરીકે ₹710 ની સારવાર કરવાનું શરૂ કરે છે. પરંતુ અહીં કેચ-શું ગેરંટી છે કે વિક્રેતાઓ ફરીથી ₹710 માં દેખાશે? એક નથી. માર્કેટ ડાયનેમિક્સમાં ફેરફાર, સેન્ટિમેન્ટમાં ફેરફાર અને કેટલીકવાર રેઝિસ્ટન્સ ઝોન મજબૂત ખરીદીની ગતિને કારણે બુલડોઝ થાય છે.
આ સ્તરની વિશ્વસનીયતા શું આપે છે તે ઐતિહાસિક વર્તન છે. જો કિંમતએ સારી રીતે જગ્યાએની સમયસીમા કરતાં અનેક વખત લેવલ પર પ્રતિક્રિયા આપી છે, તો તે પ્રાઇસ ઍક્શન ઝોન-એક પ્રદેશ બનાવે છે જ્યાં બજારના સહભાગીઓએ સતત નિર્ણયો લીધા છે. આ જગ્યાએ ટેક્નિકલ એનાલિસિસનો પ્રથમ સિદ્ધાંત શરૂ થાય છે: "ઇતિહાસ પોતાને પુનરાવર્તિત કરે છે." તેથી જ્યારે આપણે ખાતરી કરી શકતા નથી, ત્યારે આપણે વાજબી રીતે વિશ્વાસ રાખી શકીએ છીએ કે કિંમત આ ઝોનનો આદર કરશે-ખાસ કરીને જો તેઓ વિવિધ માર્કેટ સાઇકલમાં રહેલા હોય.
અનુભવ, સારી રીતે બાંધવામાં આવેલ સહાય અને પ્રતિરોધક સ્તરથી - જે સંદર્ભ, સ્પષ્ટતા અને પુષ્ટિકરણ સાથે આવે છે તેઓને ઘણીવાર આદર આપવામાં આવે છે. પરંતુ તેમને હંમેશા માર્ગદર્શિકા તરીકે ગણવામાં આવવી જોઈએ, ગેરંટી નથી.
ઑપ્ટિમાઇઝેશન અને ટ્રેડ સેટઅપ ફ્રેમવર્ક
હવે એવા ભાગ આવે છે જે શિસ્તબદ્ધ વેપારીઓ પાસેથી કેઝુઅલ ચાર્ટ વૉચરને અલગ કરે છે: ઑપ્ટિમાઇઝેશન. ટ્રેડિંગમાં, ઑપ્ટિમાઇઝેશનનો અર્થ એ છે કે ઉચ્ચ-ગુણવત્તાવાળા સેટઅપ્સને ઓળખવા માટે તમારી પ્રક્રિયાને રિફાઇન કરવું, પછી ભલે તેનો અર્થ એ છે કે વારંવાર ટ્રેડિંગ કરવું. તે ક્લાસિક ક્વૉલિટી-ઓવર-ક્વૉન્ટિટી સિદ્ધાંત છે. મજબૂત તર્ક દ્વારા સમર્થિત કેટલાક સૉલિડ ટ્રેડ્સ આકર્ષક એન્ટ્રીઝની ફ્લરી કરતાં વધુ સારી છે.
ચાલો કેન્ડલસ્ટિક પેટર્નની ફરીથી મુલાકાત લઈએ. ધારો કે તમે ઇન્ફોસિસના ચાર્ટ પર બુલિશ મારુબોઝુ શોધી રહ્યા છો. મીણબત્તી ₹1,420 માં ખુલે છે, ₹1,448 માં બંધ થાય છે, અને તેમાં ₹1,418 ની ઓછી રકમ છે. આ પેટર્ન બુલિશ શક્તિ સૂચવે છે, અને ઓછા (₹1,418) પર સ્ટૉપલૉસ સાથે નજીકના (₹1,448) નજીક લાંબા વેપાર તાર્કિક લાગે છે.
હવે કલ્પના કરો કે ₹1,418 સમય-પરીક્ષિત સપોર્ટ લેવલ-એ ઝોન સાથે પણ સંરેખિત થાય છે જ્યાં ઇન્ફોસિસએ ભૂતકાળમાં અનેક વખત બાઉન્સ કર્યો છે. આ એક શક્તિશાળી સંગમ છે. તમે માત્ર કેન્ડલસ્ટિક પેટર્ન પર આધાર રાખતા નથી; તમને ઐતિહાસિક કિંમતના વર્તન દ્વારા પણ ટેકો આપવામાં આવે છે. આ બેવડી પુષ્ટિ તમારા વિશ્વાસને મજબૂત બનાવે છે અને તમારા અવરોધોમાં સુધારો કરે છે.
આ અમને એક મુખ્ય વિચાર લાવે છે: દરેક ટ્રેડને માનસિક ચેકલિસ્ટમાંથી પસાર થવું જોઈએ. તેને ફિલ્ટર તરીકે વિચારો જે આકર્ષક નિર્ણયોને બહાર કાઢે છે. વેપારમાં પ્રવેશ કરતા પહેલાં, પૂછો:
- શું ચાર્ટ માન્ય કેન્ડલસ્ટિક પૅટર્ન બતાવે છે?
- શું સ્ટૉપલૉસ લેવલ જાણીતા સપોર્ટ અથવા રેઝિસ્ટન્સ ઝોન સાથે સંરેખિત છે?
જો બંને જવાબો હા હોય, તો ટ્રેડ સેટઅપ વિશ્વસનીયતા મેળવે છે. જો નહીં, તો સ્વચ્છ તકની રાહ જોવી વધુ સારું છે. આ પ્રકારની શિસ્ત એ છે કે અનુભવી વેપારીઓને ભાવનાત્મક વ્યક્તિઓથી અલગ કરે છે. ચેકલિસ્ટ માત્ર માર્ગદર્શન આપતું નથી, તે સુરક્ષિત કરે છે. તે તમને ઇરાદા સાથે અટકાવવા, મૂલ્યાંકન કરવા અને કાર્ય કરવા માટે દબાણ કરે છે.
જેમ જેમ તમે મૂવિંગ એવરેજ, વૉલ્યુમ એનાલિસિસ અથવા ટ્રેન્ડલાઇન જેવા વધુ ટેકનિકલ ટૂલ્સ શીખો છો, તેમ તમે આ ચેકલિસ્ટને વિસ્તૃત કરી શકો છો. આખરે, તમારી પાસે પુષ્ટિના બહુવિધ સ્તરો સાથે એક મજબૂત ફ્રેમવર્ક હશે. કેટલાક પરિબળો અન્ય કરતાં વધુ વજન ધરાવે છે, પરંતુ દરેક તમને ધ્યાન કેન્દ્રિત કરવામાં અને વિક્ષેપને ટાળવામાં મદદ કરશે.
તમારા માટે ઍક્ટિવિટી

ચાર્ટ ₹821.15 પર સપોર્ટ લેવલ અને ₹1018.85 પર રેઝિસ્ટન્સ લેવલ બતાવે છે. વર્તમાન કિંમત ₹950.45 છે, આ બે લેવલ વચ્ચે ટ્રેડિંગ.
પ્રશ્ન: જો તમે વેપારી છો અને સ્થિર અપટ્રેન્ડ પછી કિંમત પ્રતિરોધક સ્તરનો અભિગમ કરો છો, તો આગામી પગલું શું સાવચેત રહેશે?
- A) આક્રમક રીતે લાંબા સ્થિતિ દાખલ કરો
- B) રેઝિસ્ટન્સ નજીક બ્રેકઆઉટ અથવા રિવર્સલ માટે મૉનિટર કરો
- C) પ્રતિરોધક સ્તરને અવગણો-તે મહત્વપૂર્ણ નથી
- D) વિશ્લેષણ વગર તરત જ વેચો
સાચો જવાબ: B) રેઝિસ્ટન્સ નજીક બ્રેકઆઉટ અથવા રિવર્સલ માટે મૉનિટર કરો શા માટે: રેઝિસ્ટન્સ લેવલ ઘણીવાર વધુ કિંમતમાં વધારો કરવા માટે અવરોધો તરીકે કાર્ય કરે છે. વેપારીઓ માહિતગાર નિર્ણયો લેવા માટે રેઝિસ્ટન્સ ઉપરના બ્રેકઆઉટ અથવા રિવર્સલ ડાઉનવર્ડના સંકેતોની જોશ કરે છે.
11.5 મુખ્ય ટેકઅવે

- સપોર્ટ અને રેઝિસ્ટન્સ મૂળભૂત ખ્યાલો છેટેક્નિકલ એનાલિસિસમાં જે વેપારીઓને સમજવામાં મદદ કરે છે કે કી લેવલ પર કિંમતો કેવી રીતે વર્તે છે. તેઓ નિશ્ચિત બિંદુઓ નથી પરંતુ તેના બદલે એવા ઝોન છે જે સમય જતાં વિકસિત થાય છે કારણ કે કિંમત વારંવાર ચોક્કસ સ્તરો પર પ્રતિક્રિયા આપે છે.
- સપોર્ટએક પ્રાઇસ ઝોન છે જ્યાં સ્ટૉકને વધુ પડતા અટકાવવા માટે પૂરતું વ્યાજ ખરીદવાનું મજબૂત લાગે છે. તે "ફ્લોર" અથવા "સેફ્ટી નેટ" તરીકે કાર્ય કરે છે જ્યાં ખરીદદારો હસ્તક્ષેપ કરે છે, કિંમતને બૅકઅપ આપે છે.
- પ્રતિરોધએક પ્રાઇસ ઝોન છે જ્યાં વેચાણનું દબાણ ખરીદવાથી વધારે છે, જે કિંમતને વધુ વધારવાથી અટકાવે છે. તે "સીલિંગ" ની જેમ કાર્ય કરે છે જ્યાં વિક્રેતાઓ પ્રભુત્વ કરે છે, જે ઘણીવાર રિવર્સલ અથવા એકત્રીકરણ તરફ દોરી જાય છે.
- વેપારીઓ નિર્ણયો લેવા માટે આ લેવલનો ઉપયોગ કરે છે, જેમ કે નજીકના સપોર્ટની ખરીદી અને નજીકના રેઝિસ્ટન્સનું વેચાણ. તેનો ઉપયોગ સ્ટૉપ-લૉસ સેટ કરવા માટે પણ કરવામાં આવે છે, જેમાં નીચે આપેલા લાંબા ટ્રેડ માટે સ્ટૉપ-લૉસ અને રેઝિસ્ટન્સથી ઉપરના ટૂંકા ટ્રેડ માટે પણ કરવામાં આવે છે.
- એક બ્રેકઆઉટમજબૂત વૉલ્યુમ સાથે પ્રતિરોધક સ્તર દ્વારા અપટ્રેન્ડની ચાલુ રાખવાનું સંકેત આપી શકે છે. તેવી જ રીતે, સપોર્ટ લેવલની નીચેનું બ્રેકડાઉન વધુ નુકસાનને સૂચવી શકે છે.
- સપોર્ટ અને રેઝિસ્ટન્સ લેવલનું નિર્માણ કરવા માટે, તમારે યોગ્ય માત્રામાં ઐતિહાસિક ડેટા લોડ કરવો જોઈએ, પ્રાઇસ ઍક્શન ઝોનને ઓળખવું જોઈએ જ્યાં કિંમતમાં અચકાવ અથવા પરત કરવામાં આવી છે, અને સમય જતાં આમાંથી ઓછામાં ઓછા ત્રણ ઝોનને સંરેખિત કરવું જોઈએ.
- આ સ્તરોની વિશ્વસનીયતાઐતિહાસિક વર્તન પર આધારિત છે. વધુ વખત કિંમતએ સારી રીતે જગ્યાની સમયસીમા પર ચોક્કસ સ્તર પર પ્રતિક્રિયા આપી છે, વધુ વિશ્વસનીય તે સ્તર સપોર્ટ અથવા રેઝિસ્ટન્સ ઝોન તરીકે બની જાય છે.
- સપોર્ટ અને રેઝિસ્ટન્સ ગેરંટી નથી, પરંતુ તેના બદલે "સંભવિતતા ઝોન" જે સૂચવે છે કે કિંમત ક્યાં પ્રતિક્રિયા આપી શકે છે. માર્કેટ ડાયનેમિક્સ અને સેન્ટિમેન્ટ બદલાઈ શકે છે, અને આ લેવલ તોડી શકાય છે.
- શ્રેષ્ઠ ટ્રેડિંગ માટે, ટ્રેડ સેટઅપમાં પુષ્ટિકરણના બહુવિધ સ્તરો હોવા જોઈએ. ઉદાહરણ તરીકે, જો સ્ટૉપ-લૉસ લેવલ સમય-પરીક્ષિત સપોર્ટ લેવલ સાથે સંરેખિત હોય તો બુલિશ કેન્ડલસ્ટિક પેટર્ન મજબૂત કરવામાં આવે છે.
- સપોર્ટ અને રેઝિસ્ટન્સને ઓળખવુંવેપારીઓને બજારના વર્તણૂકની અપેક્ષા રાખવામાં, જોખમનું સંચાલન કરવામાં અને મજબૂત વેપાર સેટઅપ બનાવવા માટે ફ્રેમવર્ક પ્રદાન કરીને વધુ માહિતગાર નિર્ણયો લેવામાં મદદ કરે છે.