6.1 स्पिनिंग टॉप
स्पिनिंग टॉप कैंडलस्टिक एक सूक्ष्म लेकिन अंतर्दृष्टिपूर्ण पैटर्न है जो मार्केट के उतार-चढ़ाव को दर्शाता है. आप देखेंगे कि इसमें एक छोटा सा वास्तविक निकाय है, जिसका अर्थ है कि ओपनिंग और क्लोजिंग प्राइस काफी करीब और लंबी ऊपरी और निचले विक हैं, जो दर्शाता है कि सेशन के दौरान दोनों दिशाओं में प्राइस मूव हो गया है. यह हमें बताता है कि न तो खरीदार और न ही विक्रेता नियंत्रण लेने में सक्षम थे. दिलचस्प बात यह है कि मोमबत्ती का रंग, चाहे वह हरा हो या लाल, यहां मुख्य कारक नहीं है. यह वह संरचना है जो महत्वपूर्ण है: विस्तारित छाया वाला एक संकीर्ण शरीर मार्केट में अनिश्चितता का संकेत देता है.
ट्रेडर के नज़रिए से, एक स्पिनिंग टॉप विराम और पुनर्मूल्यांकन का संकेत है. यह अक्सर एक मजबूत ट्रेंड के बाद दिखाई देता है और यह सुझाव दे सकता है कि मोमेंटम स्टीम खो रहा है. उदाहरण के लिए, अगर यह एक तेज रैली के बाद दिखाई देता है, तो यह संकेत हो सकता है कि बुलिश स्ट्रेंथ फेडिंग हो रही है और रिवर्सल क्षितिज पर हो सकता है. फ्लिप साइड पर, अगर यह डाउनट्रेंड के दौरान बनता है, तो यह संकेत दे सकता है कि सेलिंग प्रेशर कम हो रहा है. किसी भी तरह से, तुरंत कार्रवाई करना कोई संकेत नहीं है; यह देखने के लिए एक प्रॉम्प्ट है कि आगे क्या आता है. कोई भी ट्रेडिंग निर्णय लेने से पहले निम्नलिखित कैंडल से कन्फर्मेशन आवश्यक है.

आइए देखते हैं कि जब एक स्पिनिंग टॉप फॉर्म होता है तो दृश्यों के पीछे क्या होता है. सबसे पहले, छोटे वास्तविक शरीर पर एक नज़र डालें, यह हमें बताता है कि बाजार लगभग एक ही स्तर पर खुला और बंद हुआ. उदाहरण के लिए, एक स्टॉक ₹520 पर खुला और ₹523 पर बंद हुआ. या हो सकता है कि यह ₹520 पर खोला गया और ₹517 पर बंद हुआ. दोनों मामलों में, कीमत बहुत कम बढ़ जाती है, और यह संकीर्ण अंतर छोटे शरीर का निर्माण करता है. चाहे कैंडल ग्रीन हो या रेड, यहां बहुत मायने नहीं रखता है कि मार्केट स्पष्ट दिशा में प्रतिबद्ध नहीं है.
अब, ऊपरी छाया पर ध्यान दें. यह वास्तविक शरीर को दिन के उच्च स्तर से जोड़ता है. अगर यह लाल मोमबत्ती है, तो खोलने के लिए उच्च लिंक; अगर यह हरा है, तो बंद करने के लिए उच्च लिंक. किसी भी तरह से, एक लंबी ऊपरी छाया की मौजूदगी हमें बताती है कि खरीदारों ने कीमत को अधिक बढ़ाने की कोशिश की, शायद ₹540 तक, लेकिन इसे होल्ड नहीं कर सका. अगर वे सफल हो गए हैं, तो हम एक बड़ी बॉडी के साथ एक मजबूत बुलिश कैंडल देखेंगे. इसलिए, यह छाया बैल के विफल प्रयास का प्रमाण है.
इसके बाद, निचले छाया पर नज़र डालें, जो वास्तविक शरीर को दिन के निचले स्तर से जोड़ता है. रेड कैंडल के लिए, यह कम से बंद होने के लिए लिंक करता है; ग्रीन कैंडल के लिए, यह खोलने के लिए कम से कम लिंक करता है. मान लीजिए कि सेशन के दौरान कीमत ₹505 तक कम हो गई है. इसका मतलब है कि विक्रेताओं ने बाजार को नीचे खींचने की कोशिश की, लेकिन बुल की तरह, वे इस कदम को बनाए नहीं रख सके. अगर वे थे, तो हम इसके बजाय एक लंबी बीयरिश कैंडल देखेंगे.
इन सभी टुकड़ों को छोटे शरीर, लंबी ऊपरी और निचले शैलियों को एक साथ रखें, और आपको एक स्पष्ट चित्र मिलता है: कोई भी पक्ष प्रभुत्व नहीं कर सकता. बुल्स ने कोशिश की और असफल. बियर की कोशिश की गई और विफल. इसका परिणाम tug-of-war में फंस गया है, जिसमें कोई स्पष्ट विजेता नहीं है. यही वह चीज़ है जो स्पिनिंग टॉप दर्शाती है: अविवेक और अनिश्चितता.
अब, अगर आप आइसोलेशन में स्पिनिंग टॉप देखते हैं, तो यह केवल एक न्यूट्रल सिग्नल है. लेकिन जब आप इसे संदर्भ में देखते हैं, तो एक मजबूत रैली या भारी गिरावट के बाद, यह अधिक सार्थक हो जाता है. अपट्रेंड के बाद, यह सुझाव दे सकता है कि बुलिश मोमेंटम फेडिंग हो रहा है. डाउनट्रेंड के बाद, यह संकेत दे सकता है कि सेलिंग प्रेशर स्टीम खो रहा है. दोनों मामलों में, इसे रोकने, देखने और तैयार करने का संकेत है, तुरंत जंप न करें. आकाश जैसे जोखिम से बचने वाले ट्रेडर, काम करने से पहले अगली कैंडल की दिशा की पुष्टि करने का इंतजार करेंगे, जबकि जोखिम लेने वाले अर्जुन का फायदा उठाने के उतार-चढ़ाव के संकेतों पर पहले से ही नजर हो सकता है.
6.2 स्पिन द टॉप इन डाउनट्रेंड

जब कोई स्टॉक डाउनट्रेंड में होता है, तो आमतौर पर वह होता है जो मार्केट को संचालित कर रहे होते हैं, जिससे लगातार बिकने वाले दबाव के साथ कीमतें कम हो जाती हैं. लेकिन जब इस गिरावट के बीच में कोई स्पिनिंग टॉप दिखाई देता है, तो यह कुछ अलग होने का संकेत देता है: एक विराम, संकोच का एक क्षण. मोमबत्ती हमें बताती है कि भले ही बीयर अभी भी एक्टिव हैं, लेकिन वे गति खो सकती हैं, और बुल्स जल की जांच करना शुरू कर रहे हैं, जो गिरने को रोकने की कोशिश कर रहे हैं. हालांकि, उनके प्रयास अभी तक ट्रेंड को रिवर्स करने के लिए पर्याप्त मजबूत नहीं हैं, अगर वे थे, तो हम एक संकीर्ण-बॉडीड स्पिनिंग टॉप के बजाय एक ठोस बुलिश कैंडल देखेंगे.
तो व्यापारी को इसका क्या करना चाहिए?
डाउनट्रेंड में स्पिनिंग टॉप्स की उपस्थिति दो समान रूप से विश्वसनीय परिणामों को खोलती है:
- या तो मार्केट अपनी डाउनवर्ड जर्नी को जारी रखता है, या
- यह वापस आना शुरू हो जाता है.
चूंकि मोमबत्ती स्वयं दिशा की पुष्टि नहीं करती है, इसलिए व्यापारी को दोनों संभावनाओं के लिए तैयार रहना चाहिए. अगर कोई लंबे समय तक जाने की प्रतीक्षा कर रहा है, तो यह एक रणनीतिक प्रवेश बिंदु हो सकता है, लेकिन सावधानी महत्वपूर्ण है. पूरे एक्सपोज़र के साथ जंपिंग करने के बजाय, ट्रेडर आधी इच्छित मात्रा के साथ दर्ज करने का विकल्प चुन सकता है, जैसे प्लान किए गए 200 में से 100 शेयर. इस तरह, अगर मार्केट ऊपर की ओर जाता है, तो वे औसत बढ़ा सकते हैं और धीरे-धीरे पोजीशन बना सकते हैं. और अगर डाउनट्रेंड दोबारा शुरू होता है, तो नुकसान सिर्फ आधे हिस्से तक सीमित है.
यह दृष्टिकोण एक संतुलित मानसिकता को दर्शाता है, जो निष्क्रिय नहीं है, लेकिन लापरवाही नहीं है. यह सतर्क रहने के लिए सिग्नल के रूप में स्पिनिंग टॉप का उपयोग करने के बारे में है, उत्साहपूर्वक कार्य न करने के लिए. मोमबत्ती निश्चितता प्रदान नहीं करती है, लेकिन यह संदर्भ प्रदान करती है. और जब इसे व्यापक चार्ट में रखा जाता है, विशेष रूप से लंबे समय तक गिरने के बाद, यह संभावित बदलाव का पहला विस्पर हो सकता है.
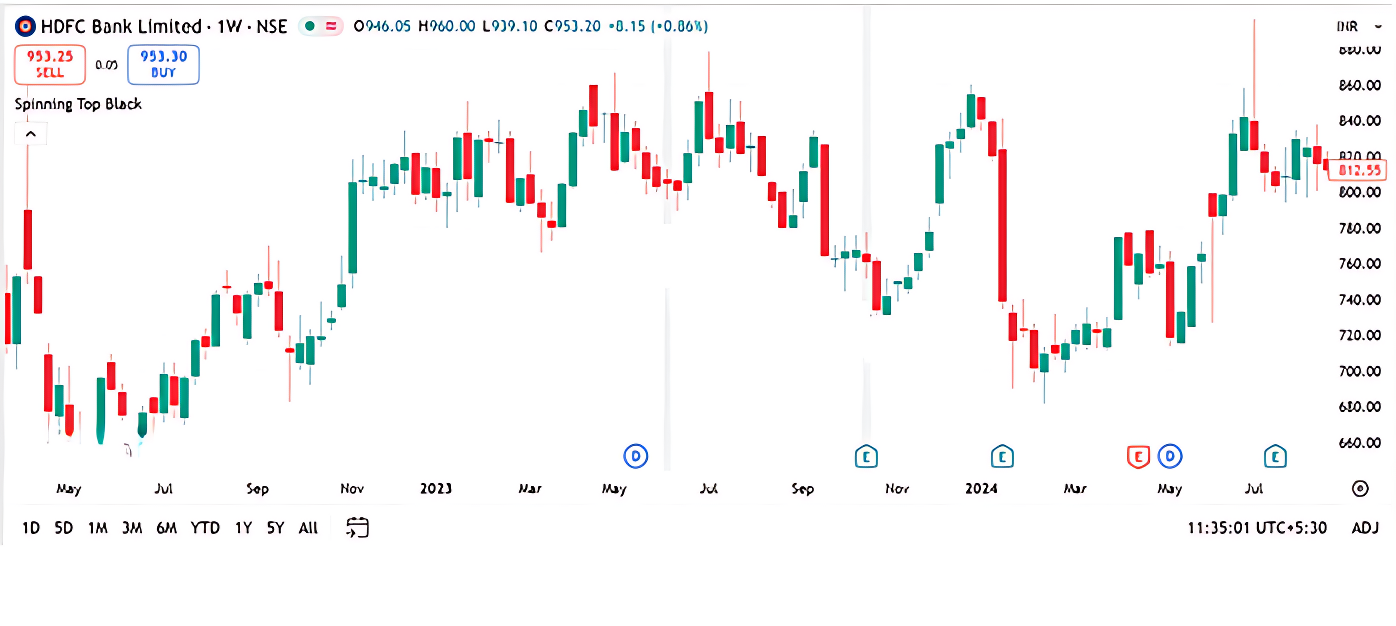
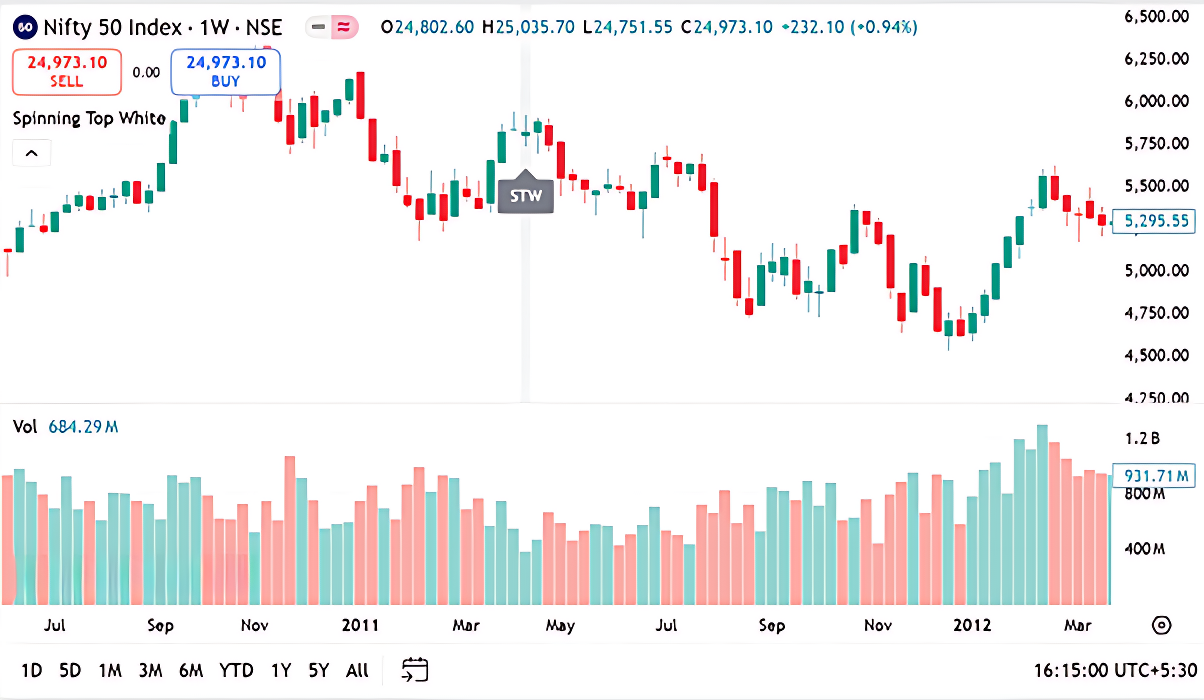
नीचे दिया गया यह चार्ट स्पष्ट प्रारंभिक डाउनट्रेंड को दर्शाता है, जो मार्केट के उतार-चढ़ाव का संकेत देता है. दिखने के कुछ ही समय बाद, स्टॉक दिशा बदलता है और रैली शुरू करता है, जिससे यह पता चलता है कि स्पिनिंग टॉप सेंटिमेंट में एक संभावित टर्निंग पॉइंट है.

नीचे दिया गया चार्ट एक ऐसा परिदृश्य प्रस्तुत करता है जहां स्पिनिंग टॉप कैंडल की उपस्थिति के बावजूद, डाउनट्रेंड जारी रहता है-यह संकेत देता है कि मार्केट के उतार-चढ़ाव से रिवर्सल नहीं हुआ, और मंदी की गति बरकरार रही.

आपके लिए छोटी गतिविधि
नीचे दिए गए चार्ट से डाउनट्रेंड में स्पॉट स्पिनिंग टॉप
यहां आपका जवाब है
6.3 अपट्रेंड में स्पिनिंग टॉप

अपट्रेंड के दौरान दिखाई देने वाला एक स्पिनिंग टॉप, डाउनट्रेंड-मार्केट इंडेक्स में बनने वाले मैसेज के समान होता है. हालांकि, व्याख्या थोड़ी बदलती है. बढ़ते बाजार के संदर्भ में, स्पिनिंग टॉप से यह पता चलता है कि बुलिश मोमेंटम स्टीम खो सकता है. अगर आप नीचे दिए गए चार्ट को देखते हैं, तो आप देखेंगे कि ऊपर की ओर मूवमेंट के बावजूद, मोमबत्ती संकोच को दर्शाती है. इसका मतलब यह हो सकता है कि खरीदार रुक रहे हैं, विक्रेता प्रतिरोध का परीक्षण करना शुरू कर रहे हैं, या दोनों. यहां मुख्य अनुमान यह है कि ट्रेंड एक क्रॉसरोड में हो सकता है, या तो जारी रहने की तैयारी करना या आगामी रिवर्सल का संकेत देना.
जब आप चार्ट पर नजर डालते हैं, तो एक बात तुरंत स्पष्ट हो जाती है: स्टॉक एक मजबूत अपट्रेंड में रहा है, जिसमें पिछले कुछ सत्रों पर बुल का सख्ती से नियंत्रण रहा है. लेकिन अब, कुछ स्पिनिंग टॉप मोमबत्तियां दिखाई गई हैं, और यह टोन बदल देती है. ये मोमबत्तियां यह दर्शाती हैं कि बुलिश वर्चस्व छोड़ना शुरू हो रहा है. अगर बुल्स अभी भी पूरी तरह से चार्ज में थे, तो हम स्पिनिंग टॉप नहीं देखेंगे, तो हम लंबी बॉडी वाली बुलिश मोमबत्तियां देखेंगे. उनके दिखने के संकेत हैं कि भालू ने दृश्य में प्रवेश किया है, भले ही वे अभी तक नहीं ले गए हों. महत्वपूर्ण बात यह है कि बुल्स ने पानी का परीक्षण करने के लिए कुछ जगह की अनुमति दी है.
आपके व्यापार के रुख के लिए इसका क्या मतलब है? स्पिनिंग टॉप अनिश्चितताओं का एक क्लासिक संकेत है, और न ही पक्ष मार्केट को निर्णायक रूप से आगे बढ़ाने में सक्षम है. अपट्रेंड के संदर्भ में, यह दो समान संभावनाएँ खोलता है:
(क) बुल किसी अन्य लेग को ऊपर से शुरू करने से पहले समेकित कर सकते हैं, या (ख) वे स्टीम से समाप्त हो सकते हैं, जिससे संभावित सुधार का मार्ग मिल सकता है.
क्योंकि दोनों परिणाम समान रूप से संभव हैं, इसलिए स्मार्ट कदम दोनों के लिए तैयार करना है.
मान लें कि आपने पहले रैली में ट्रेड किया था और अब आपके पास 500 शेयर हैं. यह आंशिक लाभ बुक करने का अच्छा समय हो सकता है-संभवतः लाभ को लॉक करने के लिए 250 शेयर बेचें. इस तरह, अगर मार्केट नीचे चला जाता है, तो आपको सुरक्षित किया जाता है, और आपने उच्च स्तर पर लाभ प्राप्त किया है. अगर बियर नियंत्रण लेते हैं और कीमतें गिरती हैं, तो आप शेष शेयरों से बाहर निकल सकते हैं और फिर भी आगे आ सकते हैं. दूसरी ओर, अगर बुल्स अपना चार्ज दोबारा शुरू करते हैं और रैली जारी रहती है, तो आप अभी भी अपने शेष 250 शेयरों के साथ गेम में हैं.
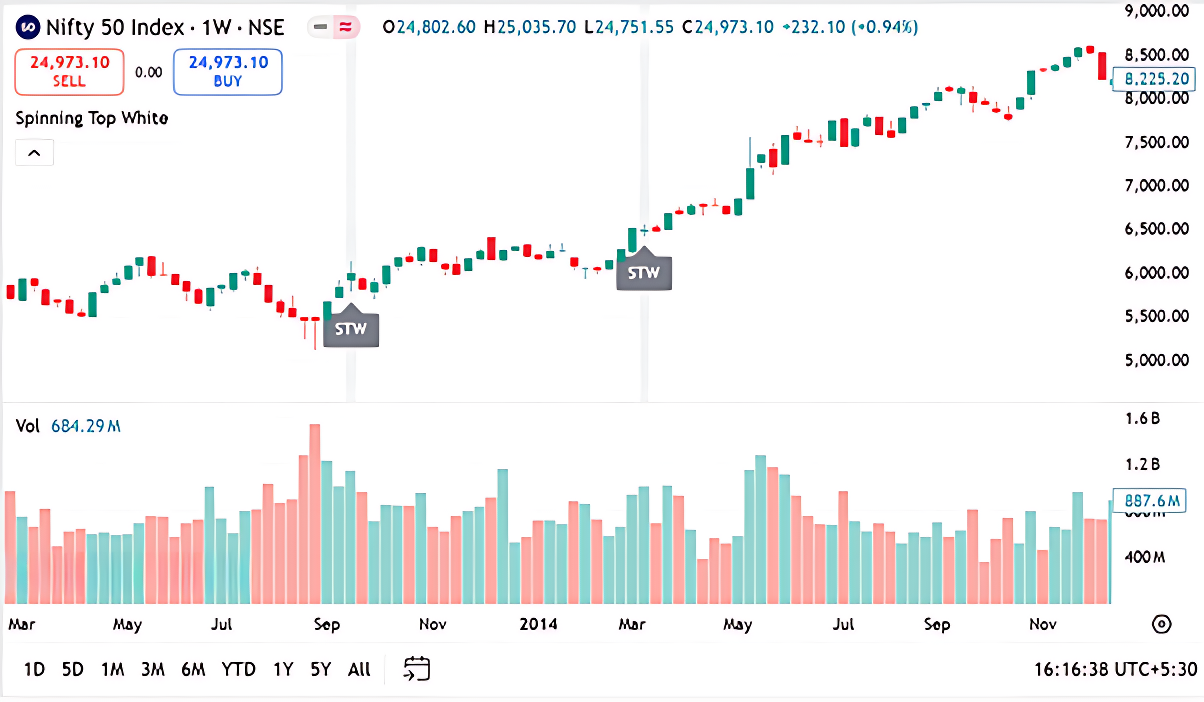
इस प्रकार का संतुलित दृष्टिकोण आपको लचीला रहने और मार्केट के किसी भी दिशा को चुनने के लिए प्रतिक्रिया देने की अनुमति देता है. वास्तव में, नीचे दिया गया चार्ट ठीक यह दिखाता है कि: स्पिनिंग टॉप की एक श्रृंखला के बाद, स्टॉक ने अपने ऊपर की ओर कदम फिर से शुरू किया. आंशिक रूप से निवेश करके, आपको अपने जोखिम को मैनेज करते समय रैली का लाभ मिलता रहेगा.
संक्षेप में, स्पिनिंग टॉप कैंडलस्टिक मार्केट में अनिश्चितता के एक चरण को दर्शाता है, जहां न तो खरीदारों और न ही विक्रेताओं के पास स्पष्ट लाभ है. ट्रेंड रिवर्सल या निरंतरता की समान संभावनाओं के साथ, ट्रेडर को सावधानी के साथ आगे बढ़ने की सलाह दी जाती है. ऐसे समय में, पूरी तरह से ट्रेड करने से पहले पोजीशन साइज़ को कम करना और स्पष्ट सिग्नल की प्रतीक्षा करना बुद्धिमानी है.
आपके लिए छोटे व्यायाम
नीचे दिए गए चार्ट से अपट्रेंड में प्लॉट स्पिनिंग टॉप
यहां आपका जवाब है

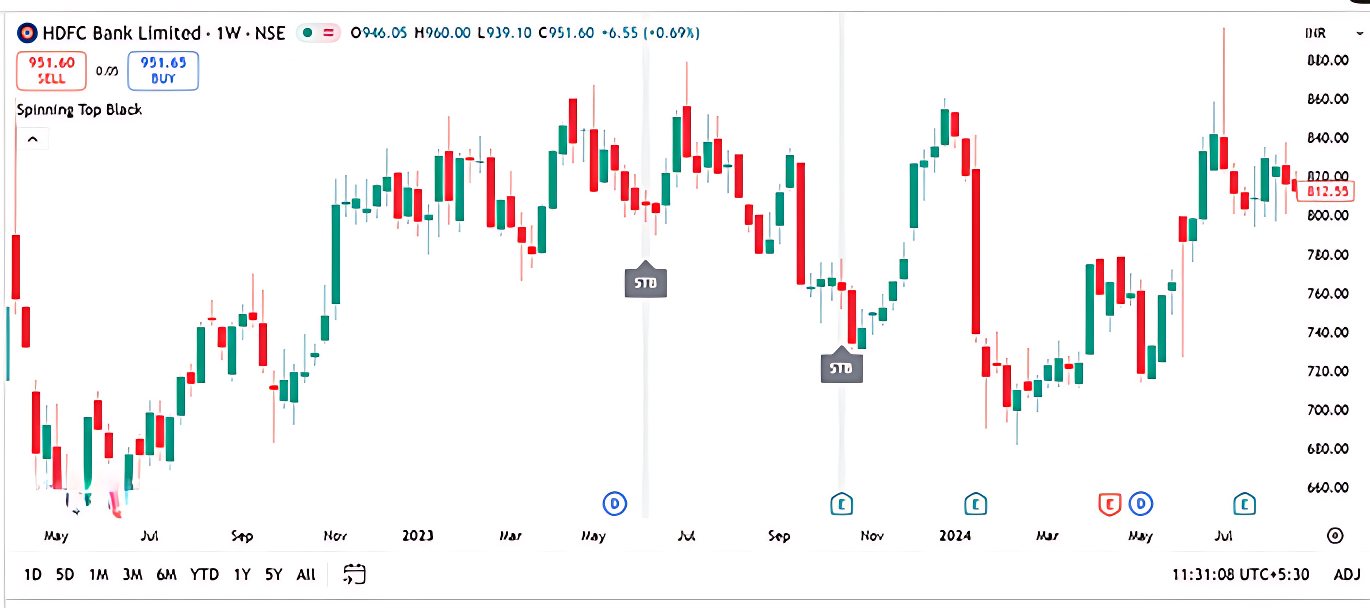
अपट्रेंड में टॉप स्पिन करना: यह पैटर्न आमतौर पर मार्केट में अनिश्चितताओं का संकेत देता है. यह एक मजबूत कदम के बाद दिखाई देता है, जो अक्सर संभावित रिवर्सल या कंसोलिडेशन पर संकेत देता है. इस चार्ट में, STW हाल ही के हाई के पास दिखाई देता है, जिसका मतलब है कि खरीदार मोमेंटम खो रहे हैं.
6.5 डोजी कैंडलस्टिक पैटर्न
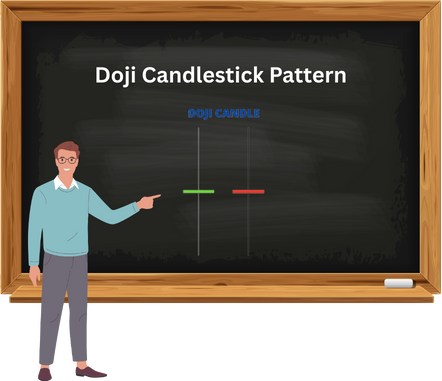
डोजी मोमबत्तियां देखने में स्पिनिंग टॉप के समान होती हैं, लेकिन एक प्रमुख अंतर के साथ-उनमें कोई वास्तविक शरीर नहीं होता है. यह तब होता है जब ओपनिंग और क्लोजिंग प्राइस वर्चुअल रूप से समान होते हैं, जिससे चार्ट पर क्रॉस-जैसे आकार बनता है. अपनी सरलता के बावजूद, डॉजी का तकनीकी विश्लेषण में महत्वपूर्ण महत्व होता है, क्योंकि वे मार्केट में पूरी अनिश्चितताओं के एक क्षण को दर्शाते हैं. वे शिफ्टिंग सेंटिमेंट के बारे में मूल्यवान जानकारी प्रदान करते हैं और अक्सर ट्रेंड में संभावित रिवर्सल या पॉज़ के शुरुआती संकेतकों के रूप में काम करते हैं, जिससे वे ट्रेडर्स के लिए एक आवश्यक पैटर्न बन जाते हैं.
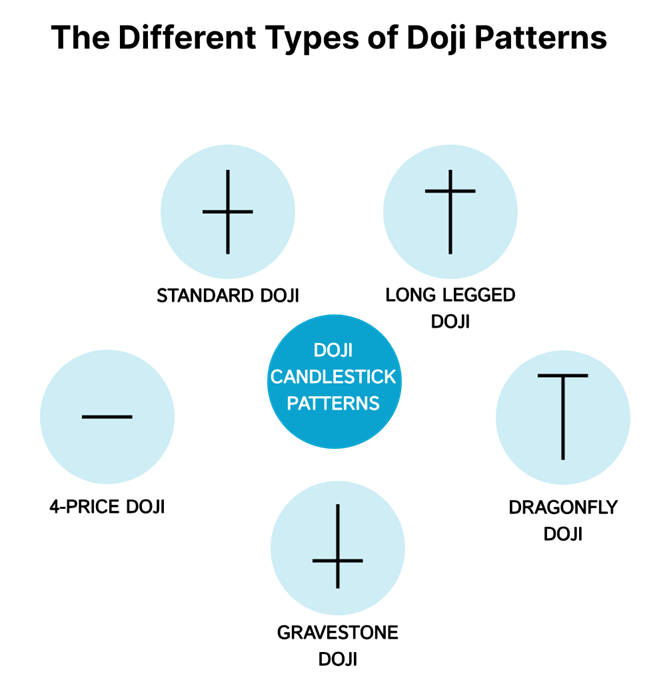
डोजी कैंडलस्टिक्स कई अलग-अलग रूपों में आते हैं, प्रत्येक मार्केट सेंटीमेंट और संभावित टर्निंग पॉइंट्स के बारे में सूक्ष्म जानकारी प्रदान करते हैं. मूल रूप से, जब ओपनिंग और क्लोजिंग प्राइस लगभग समान होते हैं, तो सभी डॉजी अनिश्चितताओं को दर्शाते हैं.
स्टैंडर्ड डोजी सबसे बुनियादी प्रकार है, जिसमें एक छोटा या गैर-मौजूदा शरीर और अपेक्षाकृत समान ऊपरी और निचले शैडो हैं. यह खरीदारों और विक्रेताओं के बीच संतुलन का संकेत देता है और अक्सर समेकन के दौरान या मजबूत ट्रेंड के अंत में दिखाई देता है.
लंबे समय तक चलने वाले डोजी ने ऊपरी और निचले विक को बढ़ाया है, जिससे पता चलता है कि सेशन के दौरान मार्केट बहुत अस्थिर था, लेकिन अंततः खुले के पास सेटल हो गया. इस प्रकार के कारण अत्यधिक अनिश्चितता का संकेत मिलता है और अक्सर इसे प्रमुख सपोर्ट या रेजिस्टेंस जोन के पास देखा जाता है.
ड्रैगनफ्लाई डोजी को एक "टी" की तरह आकार दिया गया है, जिसमें लंबी निचली छाया और कोई ऊपरी विक नहीं है, यह दर्शाता है कि सत्र के शुरू में विक्रेताओं का वर्चस्व था, लेकिन खरीदार कीमत को बंद करने में सफल रहे. इस पैटर्न को बुलिश रिवर्सल सिग्नल माना जाता है, विशेष रूप से जब यह डाउनट्रेंड के बाद बनता है.
फ्लिप साइड पर, ग्रेवेस्टोन डोजी एक उलटा हुआ "" जैसा दिखता है, जिसमें लंबी ऊपरी छाया होती है और कोई निचला विक नहीं होता है. इससे पता चलता है कि खरीदार शुरुआत में कीमतों में वृद्धि करते हैं, लेकिन विक्रेताओं ने नियंत्रण को बंद कर दिया, जब यह अपट्रेंड के बाद दिखाई देता है तो अक्सर बेयरिश सिग्नल होता है.
अंत में, चार-कीमत डोजी बहुत कम होती है और तब होती है जब खुले, उच्च, निम्न और बंद सभी समान होते हैं. यह एक फ्लैट लाइन के रूप में दिखाई देता है और मार्केट की पूरी निष्क्रियता या संतुलन को दर्शाता है, आमतौर पर इलिक्विड या रुकने वाली ट्रेडिंग स्थितियों में. प्रत्येक प्रकार का डोजी अपनी बारीकियों का पालन करता है, और हालांकि कोई भी स्टैंडअलोन ट्रेडिंग सिग्नल प्रदान नहीं करता है, लेकिन ट्रेंड और वॉल्यूम के व्यापक संदर्भ के भीतर व्याख्या करने पर वे शक्तिशाली टूल बन जाते हैं.
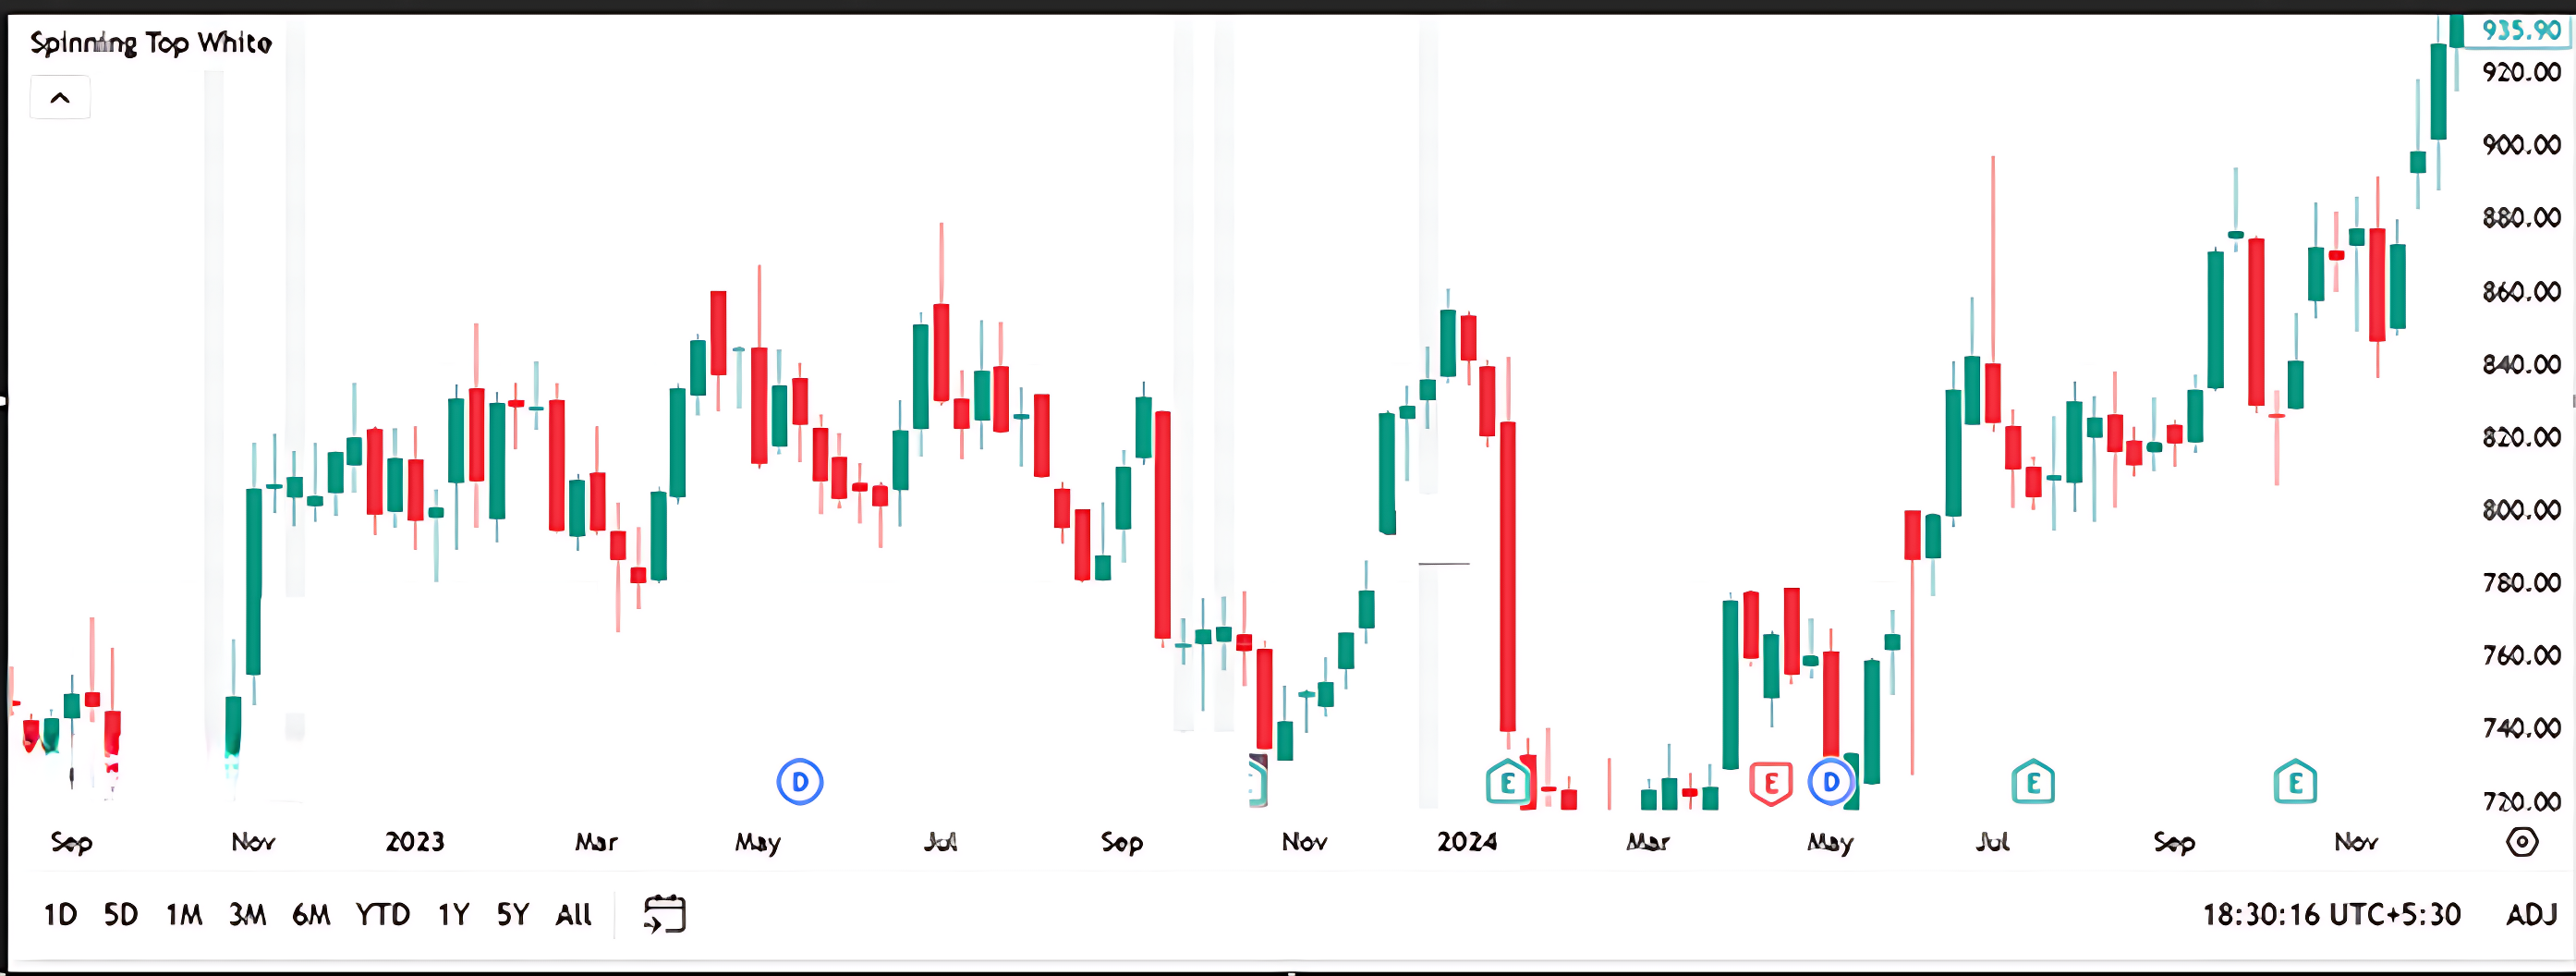
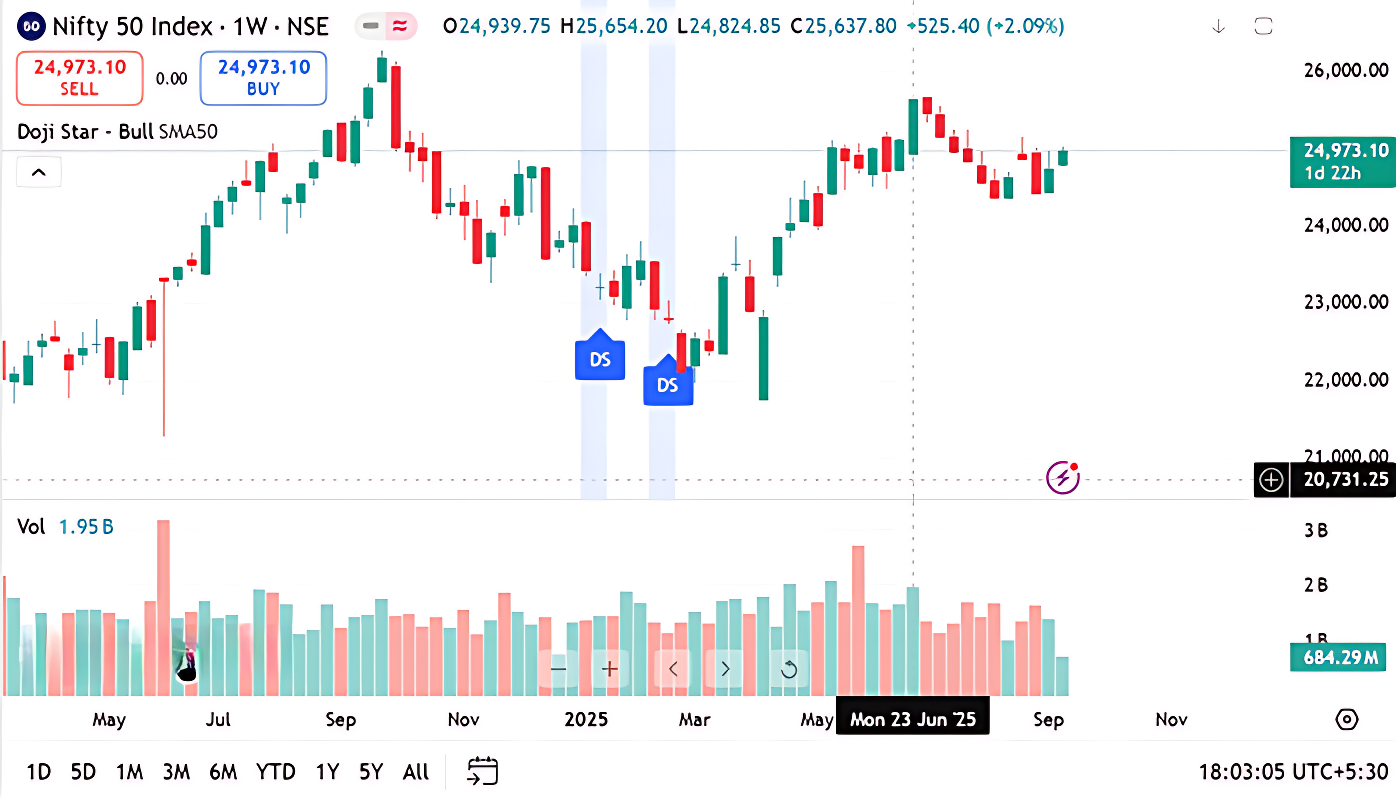
यहां एक और चार्ट दिया गया है जो एक मजबूत अपट्रेंड दिखाता है और उसके बाद डोजी कैंडल दिखाई देता है, जो बुलिश मोमेंटम में संकोच का संकेत देता है. कुछ ही देर बाद, बाजार दिशा बदलता है और एक सुधारात्मक चरण में प्रवेश करता है, जिससे पता चलता है कि डॉजी ने टर्निंग पॉइंट को चिह्नित कर दिया है.

मौजूदा डाउनट्रेंड के दौरान नीचे दिए गए डोजी के चार्ट पर एक नज़र डालें, जो मार्केट के अनिश्चित होने के एक चरण का संकेत देता है, जो अक्सर एक महत्वपूर्ण दिशात्मक कदम से पहले होता है.
अगली बार जब आप किसी स्पिनिंग टॉप या डोजी को देखते हैं, चाहे वह सिंगल कैंडल हो या क्लस्टर हो - इसे मार्केट के अनिश्चित होने के संकेत के रूप में मान्यता दें. यह एक ऐसा क्षण है जहां न तो बुल्स और न ही बीयर्स का ऊपरी हाथ होता है, और कीमत दोनों दिशाओं में आगे बढ़ सकती है. ऐसी परिस्थितियों में, एक लचीला रुख अपनाना आवश्यक है, जो आपको संभावित रिवर्सल और ट्रेंड की निरंतरता दोनों के लिए तैयार करता है. सावधानी बरतने और उसके अनुसार अपनी पोजीशन का साइज़ एडजस्ट करने से आपको आत्मविश्वास के साथ अनिश्चितता का सामना करने में मदद मिल सकती है.
आपके लिए छोटी गतिविधि
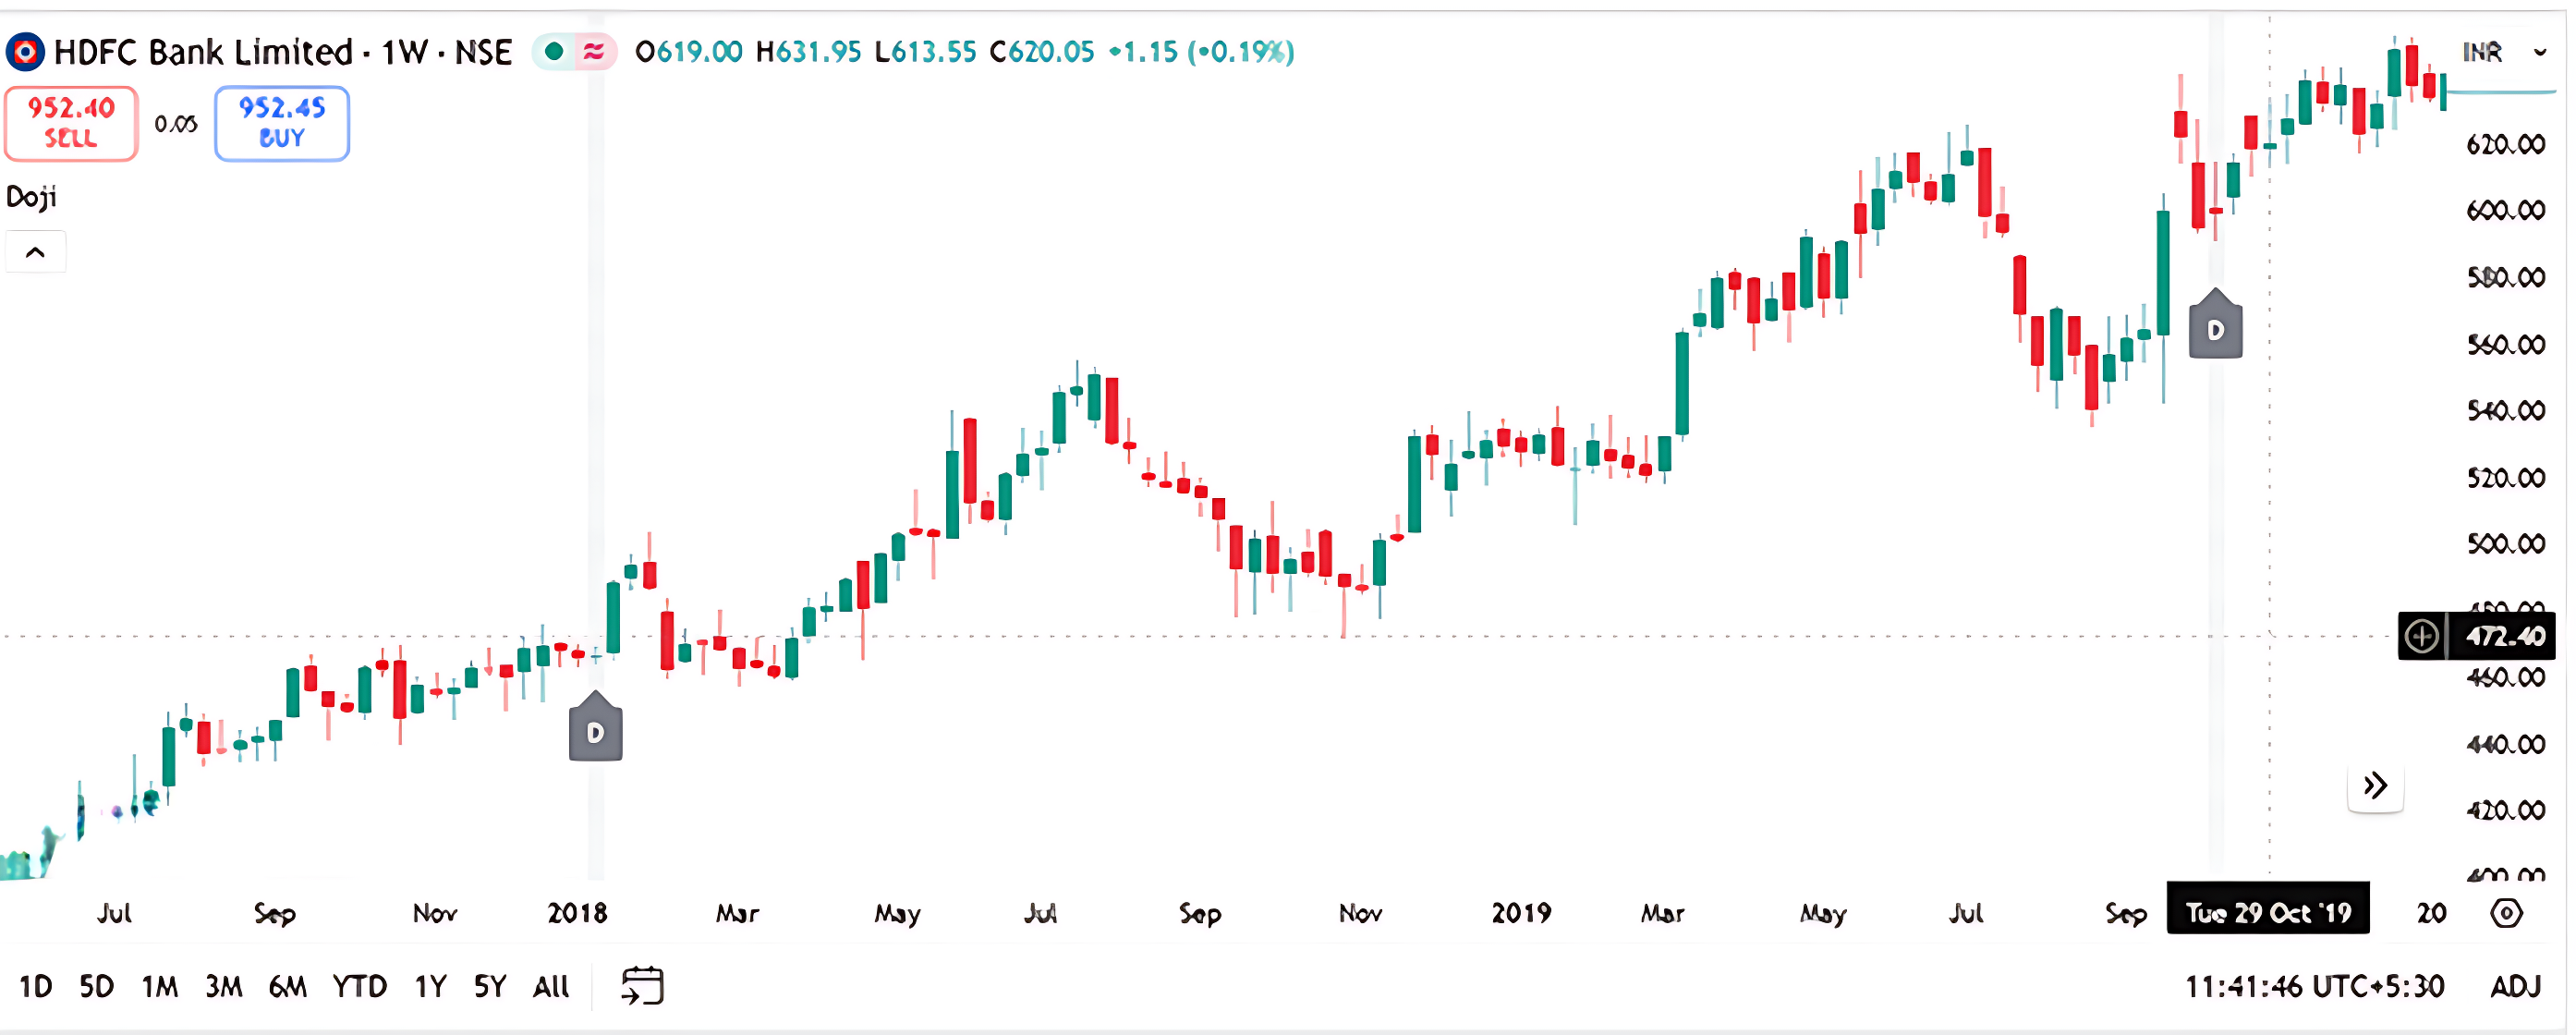
एच डी एफ सी बैंक के साप्ताहिक चार्ट पर, डोजी कैंडलस्टिक को अपनी पोजीशन और उसके आसपास की मोमबत्ती के आधार पर चिह्नित किया जाता है, यह पैटर्न मार्केट सेंटीमेंट के बारे में क्या दर्शाता है, और एक सतर्क ट्रेडर ट्रेंड जारी रखने या रिवर्सल के मामले में इसकी व्याख्या कैसे कर सकता है?
यहां आपका जवाब है
एच डी एफ सी बैंक के साप्ताहिक चार्ट पर डोजी कैंडलस्टिक मार्केट में उतार-चढ़ाव का संकेत देता है - न तो खरीदारों और न ही विक्रेताओं का उस सप्ताह के दौरान स्पष्ट नियंत्रण था. अगर यह मजबूत अपट्रेंड के बाद दिखाई देता है, तो यह बुलिश मोमेंटम में संभावित थकान या विराम का सुझाव दे सकता है.
एक सतर्क ट्रेडर के लिए, विशेष रूप से अगर बेयरिश कैंडल का पालन किया जाता है, तो यह संभावित रिवर्सल या कंसोलिडेशन का चेतावनी संकेत हो सकता है. वह किसी भी कदम को उठाने से पहले अगली मोमबत्ती में कन्फर्मेशन की प्रतीक्षा कर सकता है, न कि आवेगी. यह अनुशासित ट्रेडिंग मनोविज्ञान को दर्शाता है: ध्यान रखना, प्रतिक्रिया न देना.
6.6 मुख्य टेकअवे

- स्पिनिंग टॉप = अनिर्दिष्ट:
लंबी ऊपरी और निचले छाया वाले एक छोटे से शरीर से पता चलता है कि न तो खरीदारों और न ही विक्रेताओं का नियंत्रण होता है. - रंग गौण है:
क्या स्पिनिंग टॉप लाल है या हरा है, इसकी संरचना से कम महत्वपूर्ण है. - संदर्भ संबंधी मामले:
अपने आप, एक स्पिनिंग टॉप तटस्थ होता है, लेकिन मजबूत अपट्रेंड या डाउनट्रेंड के बाद, यह संभावित मोमेंटम लॉस का संकेत देता है. - कन्फर्मेशन की आवश्यकता:
ट्रेडर को हमेशा काम करने से पहले दिशा की पुष्टि करने के लिए अगली मोमबत्ती की प्रतीक्षा करनी चाहिए. - डाउनट्रेंड अंतर्भाव:
डाउनट्रेंड में एक स्पिनिंग टॉप यह संकेत दे सकता है कि बीयर की ताकत कम हो रही है, लेकिन रिवर्सल निश्चित नहीं है. - सावधानीपूर्वक एंट्री स्ट्रेटजी:
डाउनट्रेंड में, ट्रेडर जोखिम और अवसर को संतुलित करने के लिए आंशिक पोजीशन के साथ प्रवेश कर सकते हैं. - अपट्रेंड प्रभाव:
अपट्रेंड में एक स्पिनिंग टॉप से पता चलता है कि बुल्स धीमी हो रहे हैं, और बियर रेजिस्टेंस का परीक्षण कर रहे हैं. - आंशिक लाभ बुकिंग:
अपट्रेंड के दौरान, स्पिनिंग टॉप पर आंशिक लाभ बुक करने से ट्रेड में रहने के दौरान लाभ को लॉक करने में मदद मिलती है. - डोजी = मजबूत उदासीनता:
स्पिनिंग टॉप्स के विपरीत, डोजी मोमबत्तियों में वास्तव में कोई शरीर नहीं है (≈ बंद खोलें), जो गहरी हिचकिचाहट का संकेत देता है. - डोजी के विभिन्न प्रकार:
- स्टैंडर्ड डोजी:संतुलित उदासीनता.
- लॉन्ग-लेगेड डोजी:उच्च अस्थिरता लेकिन कोई स्पष्ट परिणाम नहीं.
- ड्रैगनफ्लाई डोजी:बुलिश रिवर्सल (डाउनट्रेंड के बाद).
- ग्रेवेस्टोन डोजी:बियरिश रिवर्सल (अपट्रेंड के बाद).
- फोर-प्राइस डोजी:दुर्लभ, संकेत पूरी तरह से मार्केट स्टैंडस्टिल.