
13.1 Understanding Open Interest and Its Calculation

In futures and options trading, one of the most frequently asked questions is:
What is Open Interest (OI)?
How is it different from traded volume, and how can traders use this data to make informed decisions?
Open Interest refers to the total number of active contracts that have been entered into but not yet settled or closed. Every time a new buyer and a new seller agree on a contract, a fresh contract is created and OI rises. When an existing position is transferred from one trader to another (one side closes, a new side opens), OI stays the same. When both sides of an existing contract close out together, OI falls.
To see this in action, let’s follow five traders — Ramesh, Priya, Kunal, Meera, and Dev — trading Bank Nifty futures over one week.
Monday — Fresh contracts create OI
Ramesh buys 5 contracts and Kunal buys 3, both from Priya, who sells all 8. Since these are brand-new positions on both sides, OI is created for the first time this week.
| Trader | Buy | Sell | Position Held |
|---|---|---|---|
| Ramesh | 5L | – | 5L |
| Kunal | 3L | – | 3L |
| Priya | – | 8S | 8S |
| Meera | – | – | – |
| Dev | – | – | – |
| Total OI | 8 |
Tuesday — A transfer leaves OI unchanged
Priya closes 5 of her 8 short contracts by buying them back. On the other side, Meera opens a brand-new short position of 5. One trader closes while another opens — a transfer — so OI doesn’t move.
| Trader | Buy | Sell | Position Held |
|---|---|---|---|
| Ramesh | – | – | 5L |
| Kunal | – | – | 3L |
| Priya | 5L | – | 3S |
| Meera | – | 5S | 5S |
| Dev | – | – | – |
| Total OI | 8 |
Wednesday — New contracts and a transfer, in the same day
Two things happen:
- Dev sells 6 fresh contracts, bought by Ramesh (4) and Kunal (2) — new interest on both sides, so OI rises by 6.
- Priya closes out her remaining 3 short contracts by buying them back. Meera takes the other side, opening 3 new short contracts to absorb that exposure — a transfer, so this part doesn’t change OI.
| Trader | Buy | Sell | Position Held |
|---|---|---|---|
| Ramesh | 4L | – | 9L |
| Kunal | 2L | – | 5L |
| Priya | 3L | – | 0 |
| Meera | – | 3S | 8S |
| Dev | – | 6S | 6S |
| Total OI | 14 |
(Check: Longs = 9 + 5 + 0 = 14. Shorts = 8 + 6 = 14. ✓)
Thursday — Dev’s 10 contracts split between “new” and “transfer”
Dev sells 10 more contracts, but they don’t all behave the same way:
- 6 of them are bought by Ramesh as brand-new longs → fresh contracts, OI rises by 6.
- The other 4 are bought by Meera specifically to close out 4 of her existing 8 short contracts → a transfer (Meera closes, Dev opens), no change to OI from this part.
| Trader | Buy | Sell | Position Held |
|---|---|---|---|
| Ramesh | 6L | – | 15L |
| Kunal | – | – | 5L |
| Priya | – | – | 0 |
| Meera | 4L | – | 4S |
| Dev | – | 10S | 16S |
| Total OI | 20 |
(Check: Longs = 15 + 5 = 20. Shorts = 4 + 16 = 20. ✓)
Friday — A genuine close-out reduces OI
Kunal decides to exit entirely, selling his full 5-contract long position. Dev buys those 5 back, covering part of his short. Both sides are closing existing exposure — nobody is opening anything new — so OI falls by 5.
| Trader | Buy | Sell | Position Held |
|---|---|---|---|
| Ramesh | – | – | 15L |
| Kunal | – | 5L | 0 |
| Priya | – | – | 0 |
| Meera | – | – | 4S |
| Dev | 5L | – | 11S |
| Total OI | 15 |
(Check: Longs = 15. Shorts = 4 + 11 = 15. ✓)
Final Observations
Open Interest is a dynamic figure that reflects the number of live contracts in the market. It rises only when both a new buyer and new seller create a contract, stays flat when a position simply changes hands (a transfer), and falls only when both sides of an existing contract close out together.
Notice that at every single point in the week, if you assign a positive sign to long positions and a negative sign to short positions, the net sum across all five traders is exactly zero: on Friday, Ramesh (+15) and Dev (−11) and Meera (−4) net to zero, with Kunal and Priya flat. This is why derivatives trading is often called a zero-sum game — every gain for one participant is matched by a loss for another.
Understanding OI alongside volume can help traders gauge market sentiment, liquidity, and potential reversals:
- Rising OI + rising price → new money flowing in on the long side, suggesting strong bullish conviction.
- Rising OI + falling price → new short positions being built, suggesting bearish conviction.
- Falling OI (regardless of price direction) → traders are closing out, meaning the prevailing trend may be losing steam.
13.2 What Are Volume and Open Interest?
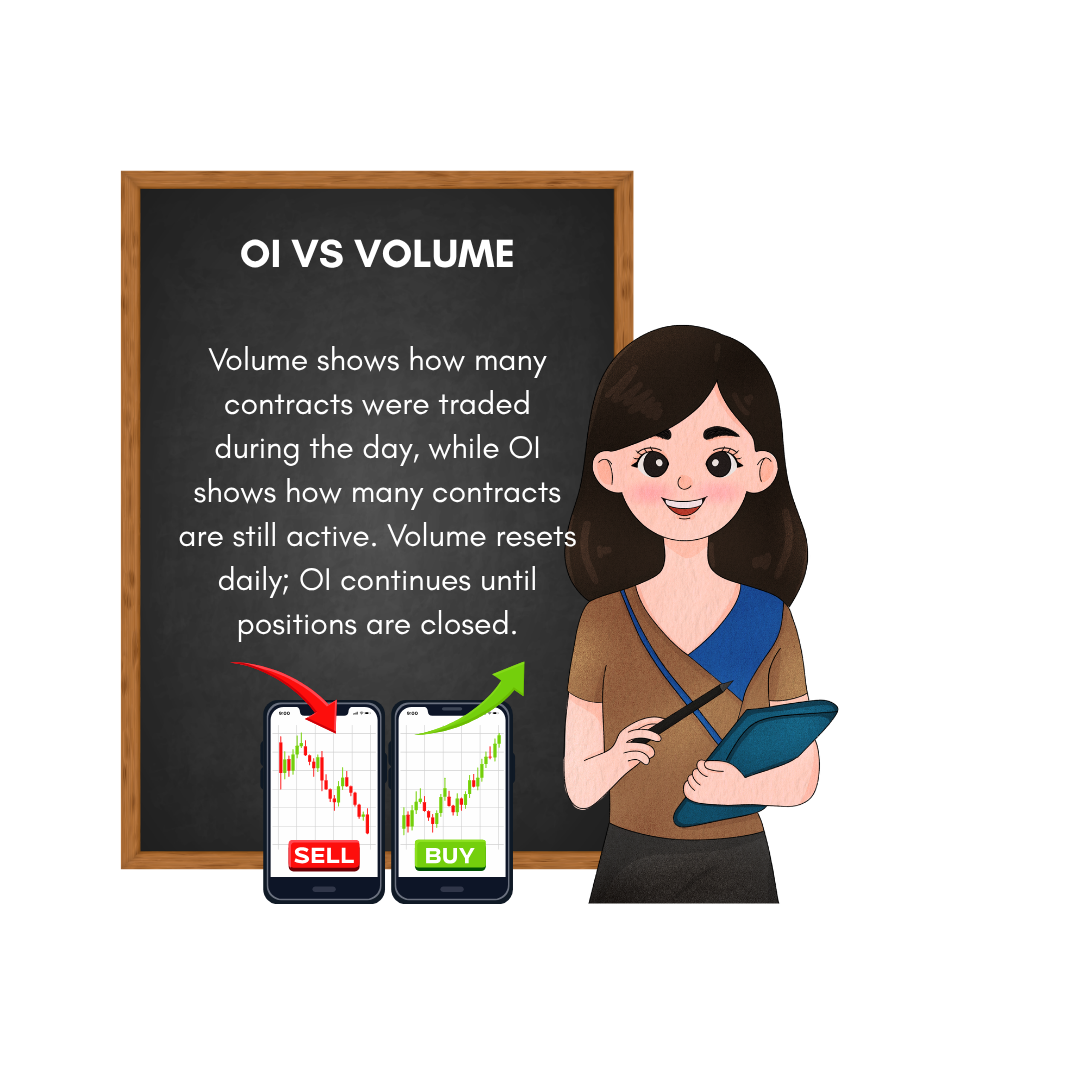
In derivatives trading, Volume and Open Interest (OI) are two key metrics that help traders understand market activity. While they may look similar, they measure very different things:
- Volume tells us how many contracts were traded during the day. It resets to zero every morning and accumulates as trades happen.
- Open Interest tells us how many contracts are currently active — that is, not yet squared off. It reflects the total number of open positions in the market at any point in time, and it carries over from one day to the next.
If, on a given day, 500 contracts are bought and 500 are sold, the volume for the day is 500 (not 1,000), because each buy-sell pair counts as one trade. Whether OI changes depends on who is on each side of that trade: if both the buyer and seller are opening brand-new positions, OI rises by 500. If one side is simply closing an old position while the other opens a new one, OI stays flat. If both sides are closing existing positions against each other, OI falls by 500.
Daily Example: Volume vs OI
Let’s walk through a week of trading activity in Nifty Futures using five fictional traders: Amit, Riya, Kabir, Sneha, and Dev. Each day shows one clean transaction, so you can see exactly how OI is built, transferred, and unwound.
| Day | Buyer | Seller | Quantity (Lots) | Nature of Trade | Volume | OI |
|---|---|---|---|---|---|---|
| Monday | Amit (new) | Riya (new) | 10 | Fresh contract — both sides opening | 10 | 10 |
| Tuesday | Kabir (new) | Sneha (new) | 8 | Fresh contract — both sides opening | 8 | 18 |
| Wednesday | Dev (new) | Riya (closing) | 10 | Transfer — Riya exits her short fully, Dev opens a new short | 10 | 18 |
| Thursday | Sneha (closing) | Amit (partial close) | 8 | Close — Sneha exits her short fully; Amit reduces his long from 10 to 2 | 8 | 10 |
| Friday | Dev (partial close) | Kabir (closing) | 8 | Close — Kabir exits his long fully; Dev reduces his short from 10 to 2 | 8 | 2 |
Position tracker (so you can verify the OI figures yourself):
| Trader | End of Mon | End of Tue | End of Wed | End of Thu | End of Fri |
|---|---|---|---|---|---|
| Amit | 10L | 10L | 10L | 2L | 2L |
| Riya | 10S | 10S | 0 | 0 | 0 |
| Kabir | – | 8L | 8L | 8L | 0 |
| Sneha | – | 8S | 8S | 0 | 0 |
| Dev | – | – | 10S | 10S | 2S |
| Total Longs | 10 | 18 | 18 | 10 | 2 |
| Total Shorts | 10 | 18 | 18 | 10 | 2 |
| OI | 10 | 18 | 18 | 10 | 2 |
Notice that Total Longs always equals Total Shorts always equals OI — that identity holds on every single day, which is how you can sanity-check any OI table.
Also notice how volume never accumulates (it’s a fresh count each day: 10, 8, 10, 8, 8), while OI carries forward and only moves based on the nature of that day’s trade — rising on fresh contracts (Mon, Tue), holding steady on a transfer (Wed), and falling on genuine close-outs (Thu, Fri).
Interpreting Price, Volume, and OI Together
Traders rarely look at volume or OI in isolation. Combining them with price movement reveals much more about market conviction.
Price vs Volume
| Price Movement | Volume Movement | Trader’s Perception |
|---|---|---|
| Increase | Increase | Bullish — strong buying interest |
| Decrease | Decrease | Bearish trend may be ending — possible reversal |
| Decrease | Increase | Bearish — aggressive selling |
| Increase | Decrease | Bullish trend may be ending — possible reversal |
Explanation:
- Price ↑ + Volume ↑ = Strong bullish conviction. New buyers are entering with confidence.
- Price ↓ + Volume ↑ = Strong bearish conviction. Sellers are active and aggressive.
- Price ↓ + Volume ↓ = Weak selling. Could signal exhaustion and a reversal.
- Price ↑ + Volume ↓ = Weak buying. Could signal a topping out.
This table is useful for trend traders who want to know whether a move is sustainable or fading.
Price vs Open Interest
| Price Movement | OI Movement | Trader’s Perception |
|---|---|---|
| Increase | Increase | Bullish — new long positions being added |
| Decrease | Decrease | Bearish trend may be ending — possible reversal |
| Decrease | Increase | Bearish — new shorts being added |
| Increase | Decrease | Bullish trend may be ending — possible reversal |
Explanation:
- Price ↑ + OI ↑ = New long positions are being added. Strong bullish signal.
- Price ↓ + OI ↑ = New short positions are being added. Strong bearish signal.
- Price ↓ + OI ↓ = Shorts are exiting (covering). Bearish trend may be ending.
- Price ↑ + OI ↓ = Longs are exiting (unwinding). Bullish trend may be ending.
This table is especially useful for futures traders who want to know whether the market is building fresh positions or winding down — something price and volume alone can’t tell you, since only OI distinguishes a new position from an existing one changing hands.
Volume vs Open Interest (confirming conviction)
Price tells you direction; volume and OI together tell you how much fresh commitment is behind that move, independent of which way price is going.
| Volume Movement | OI Movement | Trader’s Perception |
|---|---|---|
| Increase | Increase | High participation with fresh positions — the move is well-supported and more likely to continue |
| Increase | Decrease | High participation, but it’s existing positions unwinding or covering — an aggressive but potentially short-lived move |
| Decrease | Increase | Positions still building, but quietly — a slow accumulation phase |
| Decrease | Decrease | Low participation and positions shrinking — the market is going quiet, often near the end of a trend |
Explanation:
- Volume ↑ + OI ↑ = Fresh money is entering aggressively. Combined with a price direction, this is the strongest confirmation of that trend.
- Volume ↑ + OI ↓ = A lot of activity, but it’s people closing out (covering shorts or unwinding longs), not new conviction — treat the move with caution.
- Volume ↓ + OI ↑ = Positions are still being built, just without much fanfare. Can precede a bigger move once volume picks up.
- Volume ↓ + OI ↓ = Interest is drying up on both fronts — a classic sign that a trend is losing steam.
Important: Volume and OI, on their own, only tell you how much activity and how many positions exist — never which side (long or short) is building. To know whether it’s longs or shorts driving the OI change, you always need to read OI together with price direction, as in the Price vs OI table above.
If you see very high OI along with rapid price movement, it often means the market is highly leveraged — many traders have taken large positions. In such cases, even a small news event or shock can trigger panic, leading to sharp reversals. This is why experienced traders monitor OI not just for direction, but for risk buildup.
13.3 Physical Settlement Overview

Earlier, futures and options on individual stocks in India were cash-settled. This meant that when the contract expired, traders didn’t actually receive or deliver shares; instead, the profit or loss was adjusted in cash. But on April 11, 2018, SEBI announced a shift: stock F&O contracts would gradually move to physical delivery. The idea was to reduce speculative trading that often caused sharp swings in stock prices.
13.4 What is Physical Settlement?

Physical settlement means that when a stock F&O contract expires, the trader will have to give or take delivery of the underlying shares if the position has not been squared off or rolled over. This applies only to stock derivatives and not index futures or options (like Nifty or Bank Nifty) which continue to be cash-settled.
SEBI transitioned it in a phased manner based on the market capitalisation of the stocks between April and October 2019 with the remaining eligible stocks moving to physical settlement by the expiry in October 2019.
What this means in practice depends on your point of view:
Long futures (for example you have taken a buy position in SBI futures at expiry): You have to pay whole value of contract (lot size × closing price) and shares are credited to your Demat account.
Short futures: You have to deliver the shares – if you don’t already own them you will need to buy them on the market or pay penalties.
The obligation is calculated at the strike price and not at the closing market price . A long in-the-money call/put holder pays/delivers per the strike; the option seller (writer) on the other side has the matching delivery obligation.
Until this rule, all of these results were settled strictly in cash, with no shares ever changing hands. Most traders either square off or roll over stock F&O positions before expiry. This way, they avoid the complexity and the far larger amount of money involved as compared to just the margin you would normally post.
13.5 Why was Physical Settlement introduced?

Physical settlement means that when a stock F&O contract expires, if the position hasn’t been squared off or rolled over, the trader must give or take delivery of the underlying shares — this applies only to stock derivatives, not to index futures or options (like Nifty or Bank Nifty), which remain cash-settled.
This shift was phased in by SEBI between April and October 2019, based on stocks’ market capitalization, with all remaining eligible stocks moving to physical settlement by the October 2019 expiry.
What this means in practice depends on your position:
- Long futures (e.g., you’re holding a buy position in SBI futures at expiry): you must pay the full contract value (lot size × closing price), and shares are credited to your Demat account.
- Short futures: you must deliver the shares — if you don’t already hold them, you’ll need to buy them in the market or face penalties.
- Options: the obligation is calculated using the strike price, not the closing market price. A long in-the-money call/put holder pays/delivers based on the strike; the option seller (writer) on the other side has the matching delivery obligation.
Before this rule, all these outcomes were settled purely in cash, with no shares ever changing hands. To avoid the complexity — and the far larger amount of money involved compared to just the margin you’d normally post — most traders square off or roll over stock F&O positions before expiry.
13.6 How are positions settled?

At expiry, physical settlement (for stock F&O only — index contracts remain cash-settled) works out as follows:
Take Delivery (shares credited to your Demat account):
- Long Futures
- Long In-the-Money (ITM) Call
- Short ITM Put
Give Delivery (you must deliver shares to the exchange):
- Short Futures
- Short ITM Call
- Long ITM Put
Only ITM options trigger physical settlement — the obligation is calculated at the strike price, not the market price. Out-of-the-Money (OTM) options simply expire worthless, with no delivery on either side.
Note: for options that are only marginally ITM, exchanges also check whether you have sufficient funds to honor the resulting delivery obligation — if not, the position may be marked “do not exercise” and allowed to lapse worthless instead.
13.7 Netted Off Positions

If you hold multiple positions in the same stock for the same expiry, they may cancel each other out. This is called netting off.
Examples:
- Long Futures + Long ITM Put → obligations offset each other.
- Short Futures + Long ITM Call → obligations offset each other.
- Long ITM Call + Long ITM Put → obligations offset each other.
So, if you had SBI June long futures and a long ITM Put (strike 200, spot at 180), one position requires you to take delivery, the other requires you to give delivery. Since they balance out, you don’t need to deliver or receive shares.
13.8 Margins under Physical Settlement

Normally in F&O trading:
- For futures and short options, you only need to maintain margin (SPAN + exposure).
- For long options, you just pay the premium.
But with physical settlement, things change:
- If your position runs till expiry, you must arrange 100% of the contract value to take delivery, or ensure you have the shares ready to give delivery.
- Brokers usually demand extra margins as expiry approaches, to make sure traders can meet these obligations.
13.9 Key Takeaways

- OI Increases with New Contracts
- When fresh buy-sell pairs are created, OI rises.
- Example: Dev sells 6 contracts to Ramesh and Kunal → OI increases by 6.
-
- OI Decreases when Contracts Close
- Squaring off positions reduces OI.
- Example: Meera sells back 8 contracts to Dev → OI drops by 8.
-
- Transfers Don’t Change OI: If one trader passes contracts to another, OI remains the same (positions shift but don’t vanish).
- Zero-Sum Nature: Assigning + to longs and – to shorts, the net sum of all contracts is always zero. Gains for one side = losses for the other.
- Interpreting Price + Volume
- Price ↑ + Volume ↑ = strong bullish conviction.
- Price ↓ + Volume ↑ = strong bearish conviction.
- Price moves with falling volume often signal trend exhaustion.
- Interpreting Price + OI
- Price ↑ + OI ↑ = new longs added (bullish).
- Price ↓ + OI ↑ = new shorts added (bearish).
- Falling OI suggests traders are closing positions, weakening the trend.
- Physical Settlement in India: Since Oct 2019, stock F&O contracts require actual delivery of shares at expiry, not just cash settlement.
- Delivery Obligations at Expiry
- Long futures, long ITM calls, and short ITM puts → take delivery.
- Short futures, short ITM calls, and long ITM puts → give delivery.
- Netted-off positions can cancel obligations, reducing delivery requirements.
13.10 Fun Activity

Five traders – Ramesh, Priya, Kunal, Meera, and Dev – are trading Bank Nifty Futures. You need to track how Open Interest (OI) changes as trades happen.
Day 1
- Ramesh buys 5 contracts.
- Kunal buys 3 contracts.
- Priya sells 8 contracts.
Question: What is the total OI?
Day 2
- Priya transfers 5 short contracts to Meera.
Question: Does OI increase, decrease, or remain the same?
Day 3
- Dev sells 6 new contracts.
- Ramesh buys 4, Kunal buys 2.
- Priya closes 3 shorts by buying from Meera.
Question: What is the new OI?
Answers
- Day 1:OI = 8 (fresh contracts created).
- Day 2:OI = 8 (transfer only, no new contracts).
- Day 3:OI = 11 (6 new contracts added).
13.1 Understanding Open Interest and Its Calculation
In futures and options trading, one of the most frequently asked questions is:
What is Open Interest (OI)?
How is it different from traded volume, and how can traders use this data to make informed decisions?
Open Interest refers to the total number of active contracts that have been entered into but not yet settled or closed. Every time a new buyer and a new seller agree on a contract, a fresh contract is created and OI rises. When an existing position is transferred from one trader to another (one side closes, a new side opens), OI stays the same. When both sides of an existing contract close out together, OI falls.
To see this in action, let’s follow five traders — Ramesh, Priya, Kunal, Meera, and Dev — trading Bank Nifty futures over one week.
Monday — Fresh contracts create OI
Ramesh buys 5 contracts and Kunal buys 3, both from Priya, who sells all 8. Since these are brand-new positions on both sides, OI is created for the first time this week.
| Trader | Buy | Sell | Position Held |
|---|---|---|---|
| Ramesh | 5L | – | 5L |
| Kunal | 3L | – | 3L |
| Priya | – | 8S | 8S |
| Meera | – | – | – |
| Dev | – | – | – |
| Total OI | 8 |
Tuesday — A transfer leaves OI unchanged
Priya closes 5 of her 8 short contracts by buying them back. On the other side, Meera opens a brand-new short position of 5. One trader closes while another opens — a transfer — so OI doesn’t move.
| Trader | Buy | Sell | Position Held |
|---|---|---|---|
| Ramesh | – | – | 5L |
| Kunal | – | – | 3L |
| Priya | 5L | – | 3S |
| Meera | – | 5S | 5S |
| Dev | – | – | – |
| Total OI | 8 |
Wednesday — New contracts and a transfer, in the same day
Two things happen:
- Dev sells 6 fresh contracts, bought by Ramesh (4) and Kunal (2) — new interest on both sides, so OI rises by 6.
- Priya closes out her remaining 3 short contracts by buying them back. Meera takes the other side, opening 3 new short contracts to absorb that exposure — a transfer, so this part doesn’t change OI.
| Trader | Buy | Sell | Position Held |
|---|---|---|---|
| Ramesh | 4L | – | 9L |
| Kunal | 2L | – | 5L |
| Priya | 3L | – | 0 |
| Meera | – | 3S | 8S |
| Dev | – | 6S | 6S |
| Total OI | 14 |
(Check: Longs = 9 + 5 + 0 = 14. Shorts = 8 + 6 = 14. ✓)
Thursday — Dev’s 10 contracts split between “new” and “transfer”
Dev sells 10 more contracts, but they don’t all behave the same way:
- 6 of them are bought by Ramesh as brand-new longs → fresh contracts, OI rises by 6.
- The other 4 are bought by Meera specifically to close out 4 of her existing 8 short contracts → a transfer (Meera closes, Dev opens), no change to OI from this part.
| Trader | Buy | Sell | Position Held |
|---|---|---|---|
| Ramesh | 6L | – | 15L |
| Kunal | – | – | 5L |
| Priya | – | – | 0 |
| Meera | 4L | – | 4S |
| Dev | – | 10S | 16S |
| Total OI | 20 |
(Check: Longs = 15 + 5 = 20. Shorts = 4 + 16 = 20. ✓)
Friday — A genuine close-out reduces OI
Kunal decides to exit entirely, selling his full 5-contract long position. Dev buys those 5 back, covering part of his short. Both sides are closing existing exposure — nobody is opening anything new — so OI falls by 5.
| Trader | Buy | Sell | Position Held |
|---|---|---|---|
| Ramesh | – | – | 15L |
| Kunal | – | 5L | 0 |
| Priya | – | – | 0 |
| Meera | – | – | 4S |
| Dev | 5L | – | 11S |
| Total OI | 15 |
(Check: Longs = 15. Shorts = 4 + 11 = 15. ✓)
Final Observations
Open Interest is a dynamic figure that reflects the number of live contracts in the market. It rises only when both a new buyer and new seller create a contract, stays flat when a position simply changes hands (a transfer), and falls only when both sides of an existing contract close out together.
Notice that at every single point in the week, if you assign a positive sign to long positions and a negative sign to short positions, the net sum across all five traders is exactly zero: on Friday, Ramesh (+15) and Dev (−11) and Meera (−4) net to zero, with Kunal and Priya flat. This is why derivatives trading is often called a zero-sum game — every gain for one participant is matched by a loss for another.
Understanding OI alongside volume can help traders gauge market sentiment, liquidity, and potential reversals:
- Rising OI + rising price → new money flowing in on the long side, suggesting strong bullish conviction.
- Rising OI + falling price → new short positions being built, suggesting bearish conviction.
- Falling OI (regardless of price direction) → traders are closing out, meaning the prevailing trend may be losing steam.
13.2 What Are Volume and Open Interest?
In derivatives trading, Volume and Open Interest (OI) are two key metrics that help traders understand market activity. While they may look similar, they measure very different things:
- Volume tells us how many contracts were traded during the day. It resets to zero every morning and accumulates as trades happen.
- Open Interest tells us how many contracts are currently active — that is, not yet squared off. It reflects the total number of open positions in the market at any point in time, and it carries over from one day to the next.
If, on a given day, 500 contracts are bought and 500 are sold, the volume for the day is 500 (not 1,000), because each buy-sell pair counts as one trade. Whether OI changes depends on who is on each side of that trade: if both the buyer and seller are opening brand-new positions, OI rises by 500. If one side is simply closing an old position while the other opens a new one, OI stays flat. If both sides are closing existing positions against each other, OI falls by 500.
Daily Example: Volume vs OI
Let’s walk through a week of trading activity in Nifty Futures using five fictional traders: Amit, Riya, Kabir, Sneha, and Dev. Each day shows one clean transaction, so you can see exactly how OI is built, transferred, and unwound.
| Day | Buyer | Seller | Quantity (Lots) | Nature of Trade | Volume | OI |
|---|---|---|---|---|---|---|
| Monday | Amit (new) | Riya (new) | 10 | Fresh contract — both sides opening | 10 | 10 |
| Tuesday | Kabir (new) | Sneha (new) | 8 | Fresh contract — both sides opening | 8 | 18 |
| Wednesday | Dev (new) | Riya (closing) | 10 | Transfer — Riya exits her short fully, Dev opens a new short | 10 | 18 |
| Thursday | Sneha (closing) | Amit (partial close) | 8 | Close — Sneha exits her short fully; Amit reduces his long from 10 to 2 | 8 | 10 |
| Friday | Dev (partial close) | Kabir (closing) | 8 | Close — Kabir exits his long fully; Dev reduces his short from 10 to 2 | 8 | 2 |
Position tracker (so you can verify the OI figures yourself):
| Trader | End of Mon | End of Tue | End of Wed | End of Thu | End of Fri |
|---|---|---|---|---|---|
| Amit | 10L | 10L | 10L | 2L | 2L |
| Riya | 10S | 10S | 0 | 0 | 0 |
| Kabir | – | 8L | 8L | 8L | 0 |
| Sneha | – | 8S | 8S | 0 | 0 |
| Dev | – | – | 10S | 10S | 2S |
| Total Longs | 10 | 18 | 18 | 10 | 2 |
| Total Shorts | 10 | 18 | 18 | 10 | 2 |
| OI | 10 | 18 | 18 | 10 | 2 |
Notice that Total Longs always equals Total Shorts always equals OI — that identity holds on every single day, which is how you can sanity-check any OI table.
Also notice how volume never accumulates (it’s a fresh count each day: 10, 8, 10, 8, 8), while OI carries forward and only moves based on the nature of that day’s trade — rising on fresh contracts (Mon, Tue), holding steady on a transfer (Wed), and falling on genuine close-outs (Thu, Fri).
Interpreting Price, Volume, and OI Together
Traders rarely look at volume or OI in isolation. Combining them with price movement reveals much more about market conviction.
Price vs Volume
| Price Movement | Volume Movement | Trader’s Perception |
|---|---|---|
| Increase | Increase | Bullish — strong buying interest |
| Decrease | Decrease | Bearish trend may be ending — possible reversal |
| Decrease | Increase | Bearish — aggressive selling |
| Increase | Decrease | Bullish trend may be ending — possible reversal |
Explanation:
- Price ↑ + Volume ↑ = Strong bullish conviction. New buyers are entering with confidence.
- Price ↓ + Volume ↑ = Strong bearish conviction. Sellers are active and aggressive.
- Price ↓ + Volume ↓ = Weak selling. Could signal exhaustion and a reversal.
- Price ↑ + Volume ↓ = Weak buying. Could signal a topping out.
This table is useful for trend traders who want to know whether a move is sustainable or fading.
Price vs Open Interest
| Price Movement | OI Movement | Trader’s Perception |
|---|---|---|
| Increase | Increase | Bullish — new long positions being added |
| Decrease | Decrease | Bearish trend may be ending — possible reversal |
| Decrease | Increase | Bearish — new shorts being added |
| Increase | Decrease | Bullish trend may be ending — possible reversal |
Explanation:
- Price ↑ + OI ↑ = New long positions are being added. Strong bullish signal.
- Price ↓ + OI ↑ = New short positions are being added. Strong bearish signal.
- Price ↓ + OI ↓ = Shorts are exiting (covering). Bearish trend may be ending.
- Price ↑ + OI ↓ = Longs are exiting (unwinding). Bullish trend may be ending.
This table is especially useful for futures traders who want to know whether the market is building fresh positions or winding down — something price and volume alone can’t tell you, since only OI distinguishes a new position from an existing one changing hands.
Volume vs Open Interest (confirming conviction)
Price tells you direction; volume and OI together tell you how much fresh commitment is behind that move, independent of which way price is going.
| Volume Movement | OI Movement | Trader’s Perception |
|---|---|---|
| Increase | Increase | High participation with fresh positions — the move is well-supported and more likely to continue |
| Increase | Decrease | High participation, but it’s existing positions unwinding or covering — an aggressive but potentially short-lived move |
| Decrease | Increase | Positions still building, but quietly — a slow accumulation phase |
| Decrease | Decrease | Low participation and positions shrinking — the market is going quiet, often near the end of a trend |
Explanation:
- Volume ↑ + OI ↑ = Fresh money is entering aggressively. Combined with a price direction, this is the strongest confirmation of that trend.
- Volume ↑ + OI ↓ = A lot of activity, but it’s people closing out (covering shorts or unwinding longs), not new conviction — treat the move with caution.
- Volume ↓ + OI ↑ = Positions are still being built, just without much fanfare. Can precede a bigger move once volume picks up.
- Volume ↓ + OI ↓ = Interest is drying up on both fronts — a classic sign that a trend is losing steam.
Important: Volume and OI, on their own, only tell you how much activity and how many positions exist — never which side (long or short) is building. To know whether it’s longs or shorts driving the OI change, you always need to read OI together with price direction, as in the Price vs OI table above.
If you see very high OI along with rapid price movement, it often means the market is highly leveraged — many traders have taken large positions. In such cases, even a small news event or shock can trigger panic, leading to sharp reversals. This is why experienced traders monitor OI not just for direction, but for risk buildup.
13.3 Physical Settlement Overview
Earlier, futures and options on individual stocks in India were cash-settled. This meant that when the contract expired, traders didn’t actually receive or deliver shares; instead, the profit or loss was adjusted in cash. But on April 11, 2018, SEBI announced a shift: stock F&O contracts would gradually move to physical delivery. The idea was to reduce speculative trading that often caused sharp swings in stock prices.
13.4 What is Physical Settlement?
Physical settlement means that when a stock F&O contract expires, the trader will have to give or take delivery of the underlying shares if the position has not been squared off or rolled over. This applies only to stock derivatives and not index futures or options (like Nifty or Bank Nifty) which continue to be cash-settled.
SEBI transitioned it in a phased manner based on the market capitalisation of the stocks between April and October 2019 with the remaining eligible stocks moving to physical settlement by the expiry in October 2019.
What this means in practice depends on your point of view:
Long futures (for example you have taken a buy position in SBI futures at expiry): You have to pay whole value of contract (lot size × closing price) and shares are credited to your Demat account.
Short futures: You have to deliver the shares – if you don’t already own them you will need to buy them on the market or pay penalties.
The obligation is calculated at the strike price and not at the closing market price . A long in-the-money call/put holder pays/delivers per the strike; the option seller (writer) on the other side has the matching delivery obligation.
Until this rule, all of these results were settled strictly in cash, with no shares ever changing hands. Most traders either square off or roll over stock F&O positions before expiry. This way, they avoid the complexity and the far larger amount of money involved as compared to just the margin you would normally post.
13.5 Why was Physical Settlement introduced?
Physical settlement means that when a stock F&O contract expires, if the position hasn’t been squared off or rolled over, the trader must give or take delivery of the underlying shares — this applies only to stock derivatives, not to index futures or options (like Nifty or Bank Nifty), which remain cash-settled.
This shift was phased in by SEBI between April and October 2019, based on stocks’ market capitalization, with all remaining eligible stocks moving to physical settlement by the October 2019 expiry.
What this means in practice depends on your position:
- Long futures (e.g., you’re holding a buy position in SBI futures at expiry): you must pay the full contract value (lot size × closing price), and shares are credited to your Demat account.
- Short futures: you must deliver the shares — if you don’t already hold them, you’ll need to buy them in the market or face penalties.
- Options: the obligation is calculated using the strike price, not the closing market price. A long in-the-money call/put holder pays/delivers based on the strike; the option seller (writer) on the other side has the matching delivery obligation.
Before this rule, all these outcomes were settled purely in cash, with no shares ever changing hands. To avoid the complexity — and the far larger amount of money involved compared to just the margin you’d normally post — most traders square off or roll over stock F&O positions before expiry.
13.6 How are positions settled?
At expiry, physical settlement (for stock F&O only — index contracts remain cash-settled) works out as follows:
Take Delivery (shares credited to your Demat account):
- Long Futures
- Long In-the-Money (ITM) Call
- Short ITM Put
Give Delivery (you must deliver shares to the exchange):
- Short Futures
- Short ITM Call
- Long ITM Put
Only ITM options trigger physical settlement — the obligation is calculated at the strike price, not the market price. Out-of-the-Money (OTM) options simply expire worthless, with no delivery on either side.
Note: for options that are only marginally ITM, exchanges also check whether you have sufficient funds to honor the resulting delivery obligation — if not, the position may be marked “do not exercise” and allowed to lapse worthless instead.
13.7 Netted Off Positions
If you hold multiple positions in the same stock for the same expiry, they may cancel each other out. This is called netting off.
Examples:
- Long Futures + Long ITM Put → obligations offset each other.
- Short Futures + Long ITM Call → obligations offset each other.
- Long ITM Call + Long ITM Put → obligations offset each other.
So, if you had SBI June long futures and a long ITM Put (strike 200, spot at 180), one position requires you to take delivery, the other requires you to give delivery. Since they balance out, you don’t need to deliver or receive shares.
13.8 Margins under Physical Settlement
Normally in F&O trading:
- For futures and short options, you only need to maintain margin (SPAN + exposure).
- For long options, you just pay the premium.
But with physical settlement, things change:
- If your position runs till expiry, you must arrange 100% of the contract value to take delivery, or ensure you have the shares ready to give delivery.
- Brokers usually demand extra margins as expiry approaches, to make sure traders can meet these obligations.
13.9 Key Takeaways
- OI Increases with New Contracts
- When fresh buy-sell pairs are created, OI rises.
- Example: Dev sells 6 contracts to Ramesh and Kunal → OI increases by 6.
-
- OI Decreases when Contracts Close
- Squaring off positions reduces OI.
- Example: Meera sells back 8 contracts to Dev → OI drops by 8.
-
- Transfers Don’t Change OI: If one trader passes contracts to another, OI remains the same (positions shift but don’t vanish).
- Zero-Sum Nature: Assigning + to longs and – to shorts, the net sum of all contracts is always zero. Gains for one side = losses for the other.
- Interpreting Price + Volume
- Price ↑ + Volume ↑ = strong bullish conviction.
- Price ↓ + Volume ↑ = strong bearish conviction.
- Price moves with falling volume often signal trend exhaustion.
- Interpreting Price + OI
- Price ↑ + OI ↑ = new longs added (bullish).
- Price ↓ + OI ↑ = new shorts added (bearish).
- Falling OI suggests traders are closing positions, weakening the trend.
- Physical Settlement in India: Since Oct 2019, stock F&O contracts require actual delivery of shares at expiry, not just cash settlement.
- Delivery Obligations at Expiry
- Long futures, long ITM calls, and short ITM puts → take delivery.
- Short futures, short ITM calls, and long ITM puts → give delivery.
- Netted-off positions can cancel obligations, reducing delivery requirements.
13.10 Fun Activity
Five traders – Ramesh, Priya, Kunal, Meera, and Dev – are trading Bank Nifty Futures. You need to track how Open Interest (OI) changes as trades happen.
Day 1
- Ramesh buys 5 contracts.
- Kunal buys 3 contracts.
- Priya sells 8 contracts.
Question: What is the total OI?
Day 2
- Priya transfers 5 short contracts to Meera.
Question: Does OI increase, decrease, or remain the same?
Day 3
- Dev sells 6 new contracts.
- Ramesh buys 4, Kunal buys 2.
- Priya closes 3 shorts by buying from Meera.
Question: What is the new OI?
Answers
- Day 1:OI = 8 (fresh contracts created).
- Day 2:OI = 8 (transfer only, no new contracts).
- Day 3:OI = 11 (6 new contracts added).
13.1 Understanding Open Interest and Its Calculation
In futures and options trading, one of the most frequently asked questions is: What is Open Interest (OI)? How is it different from traded volume, and how can traders use this data to make informed decisions? Open Interest refers to the total number of active contracts that have been entered into but not yet settled or closed. Every time a new buyer and a new seller agree on a contract, a fresh contract is created and OI rises. When an existing position is transferred from one trader to another (one side closes, a new side opens), OI stays the same. When both sides of an existing contract close out together, OI falls. To see this in action, let’s follow five traders — Ramesh, Priya, Kunal, Meera, and Dev — trading Bank Nifty futures over one week. Monday — Fresh contracts create OIRamesh buys 5 contracts and Kunal buys 3, both from Priya, who sells all 8. Since these are brand-new positions on both sides, OI is created for the first time this week.
Tuesday — A transfer leaves OI unchangedPriya closes 5 of her 8 short contracts by buying them back. On the other side, Meera opens a brand-new short position of 5. One trader closes while another opens — a transfer — so OI doesn’t move.
Wednesday — New contracts and a transfer, in the same dayTwo things happen:
(Check: Longs = 9 + 5 + 0 = 14. Shorts = 8 + 6 = 14. ✓) Thursday — Dev’s 10 contracts split between “new” and “transfer”Dev sells 10 more contracts, but they don’t all behave the same way:
(Check: Longs = 15 + 5 = 20. Shorts = 4 + 16 = 20. ✓) Friday — A genuine close-out reduces OIKunal decides to exit entirely, selling his full 5-contract long position. Dev buys those 5 back, covering part of his short. Both sides are closing existing exposure — nobody is opening anything new — so OI falls by 5.
(Check: Longs = 15. Shorts = 4 + 11 = 15. ✓) Final ObservationsOpen Interest is a dynamic figure that reflects the number of live contracts in the market. It rises only when both a new buyer and new seller create a contract, stays flat when a position simply changes hands (a transfer), and falls only when both sides of an existing contract close out together. Notice that at every single point in the week, if you assign a positive sign to long positions and a negative sign to short positions, the net sum across all five traders is exactly zero: on Friday, Ramesh (+15) and Dev (−11) and Meera (−4) net to zero, with Kunal and Priya flat. This is why derivatives trading is often called a zero-sum game — every gain for one participant is matched by a loss for another. Understanding OI alongside volume can help traders gauge market sentiment, liquidity, and potential reversals:
13.2 What Are Volume and Open Interest?
In derivatives trading, Volume and Open Interest (OI) are two key metrics that help traders understand market activity. While they may look similar, they measure very different things:
If, on a given day, 500 contracts are bought and 500 are sold, the volume for the day is 500 (not 1,000), because each buy-sell pair counts as one trade. Whether OI changes depends on who is on each side of that trade: if both the buyer and seller are opening brand-new positions, OI rises by 500. If one side is simply closing an old position while the other opens a new one, OI stays flat. If both sides are closing existing positions against each other, OI falls by 500. Daily Example: Volume vs OILet’s walk through a week of trading activity in Nifty Futures using five fictional traders: Amit, Riya, Kabir, Sneha, and Dev. Each day shows one clean transaction, so you can see exactly how OI is built, transferred, and unwound.
Position tracker (so you can verify the OI figures yourself):
Notice that Total Longs always equals Total Shorts always equals OI — that identity holds on every single day, which is how you can sanity-check any OI table. Also notice how volume never accumulates (it’s a fresh count each day: 10, 8, 10, 8, 8), while OI carries forward and only moves based on the nature of that day’s trade — rising on fresh contracts (Mon, Tue), holding steady on a transfer (Wed), and falling on genuine close-outs (Thu, Fri). Interpreting Price, Volume, and OI TogetherTraders rarely look at volume or OI in isolation. Combining them with price movement reveals much more about market conviction. Price vs Volume
Explanation:
This table is useful for trend traders who want to know whether a move is sustainable or fading. Price vs Open Interest
Explanation:
This table is especially useful for futures traders who want to know whether the market is building fresh positions or winding down — something price and volume alone can’t tell you, since only OI distinguishes a new position from an existing one changing hands. Volume vs Open Interest (confirming conviction)Price tells you direction; volume and OI together tell you how much fresh commitment is behind that move, independent of which way price is going.
Explanation:
Important: Volume and OI, on their own, only tell you how much activity and how many positions exist — never which side (long or short) is building. To know whether it’s longs or shorts driving the OI change, you always need to read OI together with price direction, as in the Price vs OI table above. If you see very high OI along with rapid price movement, it often means the market is highly leveraged — many traders have taken large positions. In such cases, even a small news event or shock can trigger panic, leading to sharp reversals. This is why experienced traders monitor OI not just for direction, but for risk buildup. 13.3 Physical Settlement Overview
Earlier, futures and options on individual stocks in India were cash-settled. This meant that when the contract expired, traders didn’t actually receive or deliver shares; instead, the profit or loss was adjusted in cash. But on April 11, 2018, SEBI announced a shift: stock F&O contracts would gradually move to physical delivery. The idea was to reduce speculative trading that often caused sharp swings in stock prices. 13.4 What is Physical Settlement? |