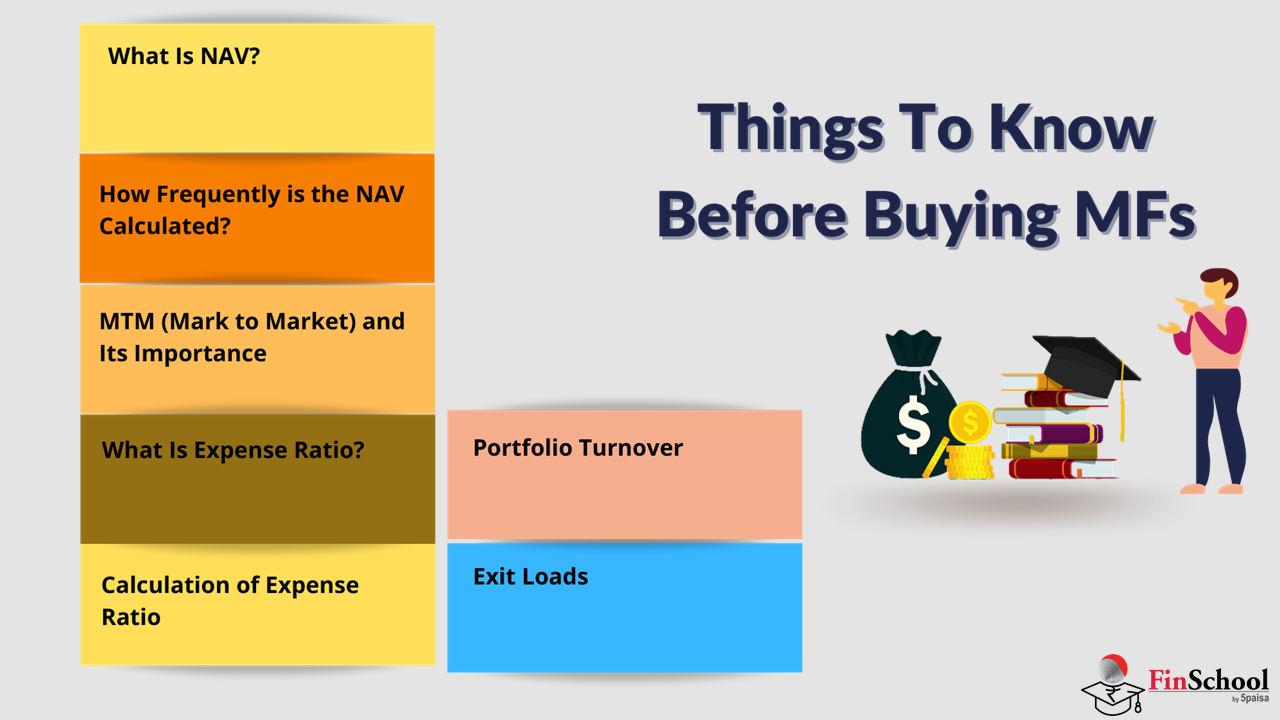

4.1 What is NAV?
Anand: What is NAV in funds?
Ridhima: The NAV in funds is the value of each unit of the mutual fund. It is calculated by taking the assets of the mutual fund and subtracting the liabilities then dividing that by the total number of units that have been issued.
Anand: Does the NAV in funds change daily?
Ridhima: Yes the NAV in funds does change daily because the prices of the assets that the mutual fund owns and the liabilities of the mutual fund change every day. That is why the NAV in funds is updated every day.
Anand: Why is mark-to-market so important for funds?
Ridhima: Mark-to-market is important for funds because it values the securities that the mutual fund owns at the current market price, which makes sure that investors who are buying or redeeming units of the mutual fund are getting a fair value for their money.
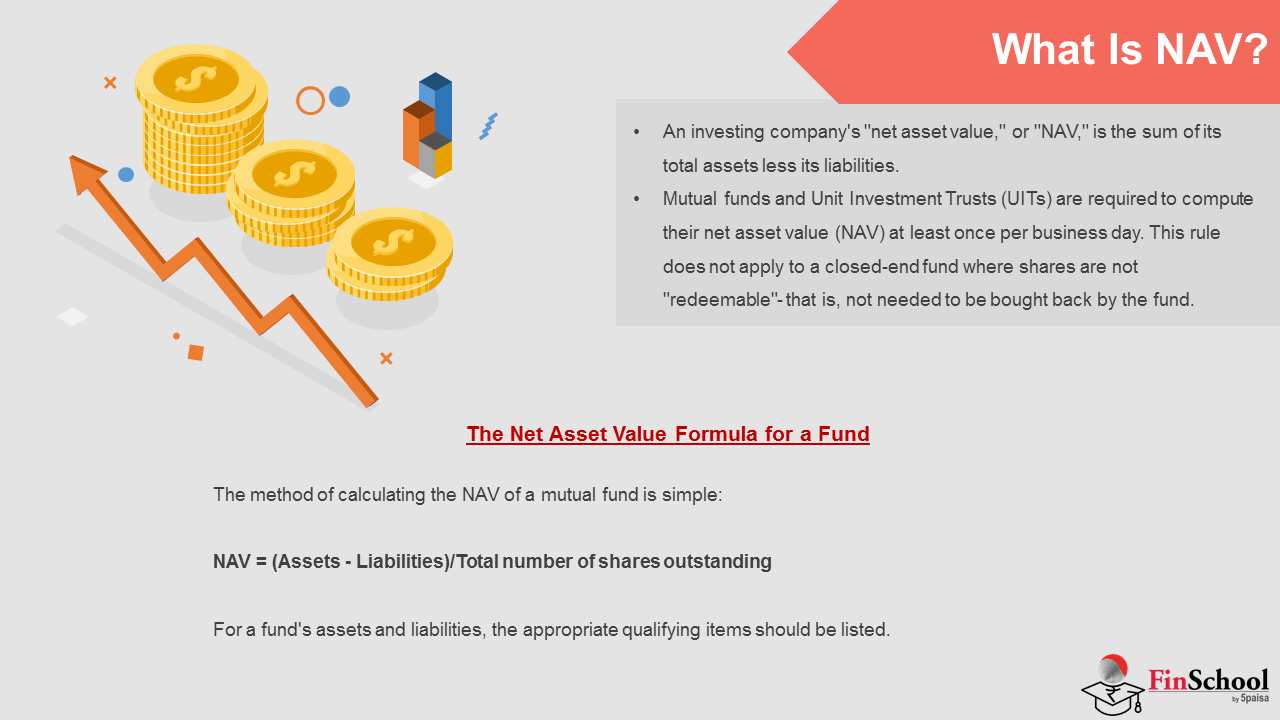
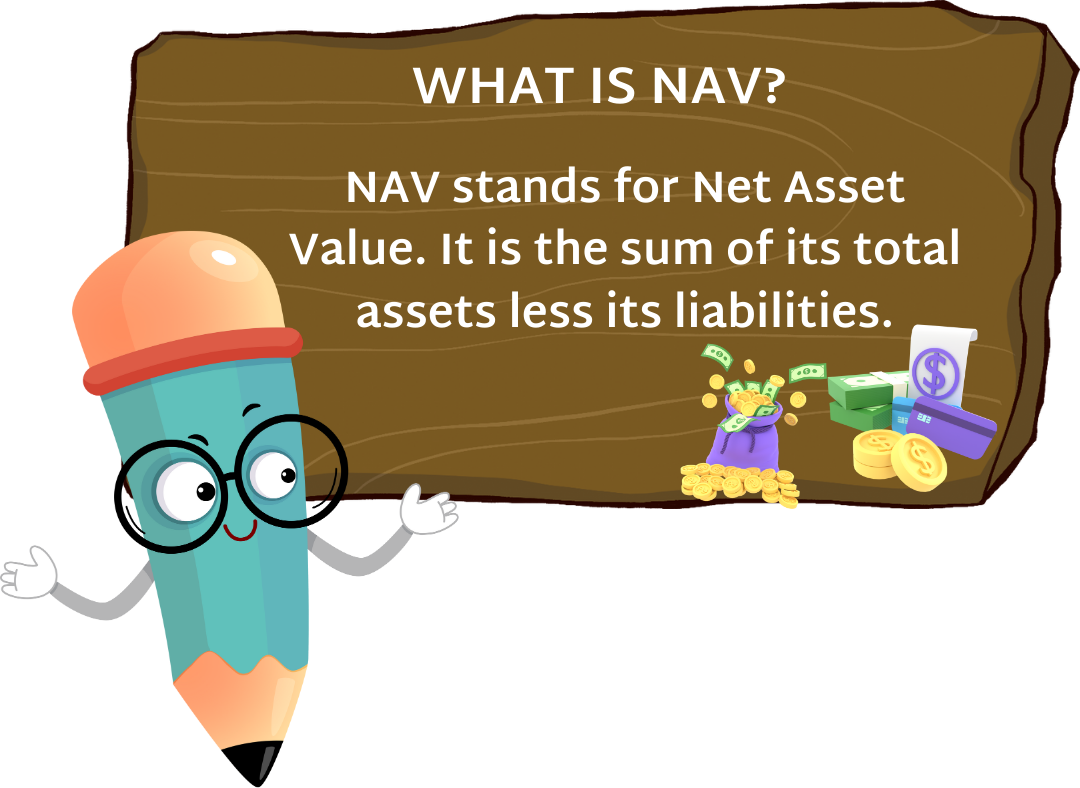
The Net Asset Value of a fund is, at its core, the value of a single unit of that fund. It’s calculated by taking the total value of everything the fund owns, subtracting its liabilities, and dividing the result by the number of units in issue. The NAV is the price at which investors buy or sell fund units.
Suppose, for instance, that a fund holds securities worth ₹100 and has liabilities of ₹10 — its Net Asset Value would be ₹90. Because the value of a fund’s holdings and liabilities changes every day, its NAV changes just as regularly.
The formula to calculate the Net Asset Value is
Net Asset Value = (Total Assets − Liabilities) / Number of Units
A fund’s assets consist of its investments in stocks, bonds, and other instruments, while its liabilities cover the expenses and obligations it owes.
Valuing a fund’s net assets follows a set of specific rules:
- Listed securities are valued at their closing market price.
- Illiquid shares or debentures are valued at the lower of book value or the last available price.
- Traded bonds and debentures are valued at the lower of their closing traded value or yield value.
- Fixed-income securities are valued based on their yield.
This methodology ensures that a fund’s NAV reflects a genuinely transparent picture of its holdings.
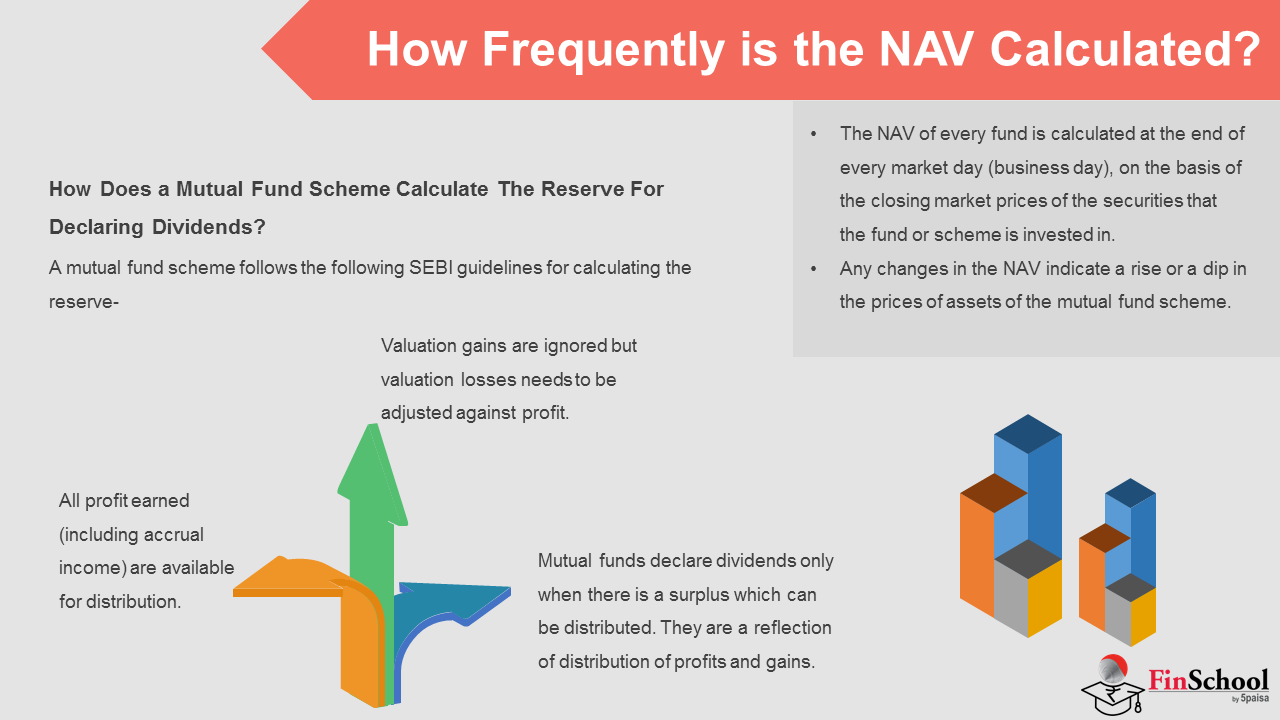
Mutual funds and Unit Investment Trusts are required to calculate their NAV once every business day, based on closing market prices — a daily discipline that lets investors track the performance of their investments closely. Closed-end funds are the one exception, since their shares aren’t redeemable on demand.
SEBI’s guidelines also govern how mutual funds calculate their dividend reserves:
- A fund’s profits, including income earned, are what’s available for distribution.
- Valuation gains are excluded, while valuation losses must be adjusted against profits.
- Dividends can only be declared when there is a genuine surplus.
For example, suppose an investor buys units of a fund at a NAV of ₹14, when the unit’s face value is ₹10 — meaning a ₹4 premium. If the NAV later rises to ₹17, the fund may declare a dividend of ₹3, though the unit premium reserve itself cannot be used to fund dividend payouts.
Mark-to-market is the process of valuing each security in a portfolio at its current market price. This matters because:
- It gives an accurate picture of the fund’s profit or loss at the end of each day.
- It ensures investors buy or redeem units at a genuinely fair value.
- It helps assess both the scheme’s performance and the fund manager’s effectiveness.
Let us consider an example. Suppose a mutual fund has:
- Assets worth ₹1,00,000 (stocks, bonds, etc.)
- Liabilities of ₹10,000
- Outstanding units: 9,000
The Net Asset Value is calculated as:
NAV = (₹1,00,000 − ₹10,000) / 9,000 = ₹10 per unit
So, the NAV of the fund is ₹10 per unit. If you invest ₹50,000, you will receive 5,000 units. If the NAV rises to ₹12, your investment value becomes ₹60,000.
4.2 What Is Expense Ratio?
Anand: What is the expense ratio of a fund?
Ridhima: The expense ratio of a fund is the annual fee that the mutual fund charges for managing the mutual fund administering the mutual fund and distributing the mutual fund.
Anand: How does the expense ratio of a fund affect the returns of the mutual fund?
Ridhima: If a mutual fund earns a return of 10 percent but has an expense ratio of 1 percent then the net return of the fund will be 9 percent. Over time a higher expense ratio can reduce the wealth of the investor in the fund.
Anand: So I should compare the expense ratios of mutual funds?
Ridhima: Exactly you should compare the expense ratios of mutual funds but you should also check the consistency of the returns of the mutual funds and the skill of the fund manager of the mutual funds.
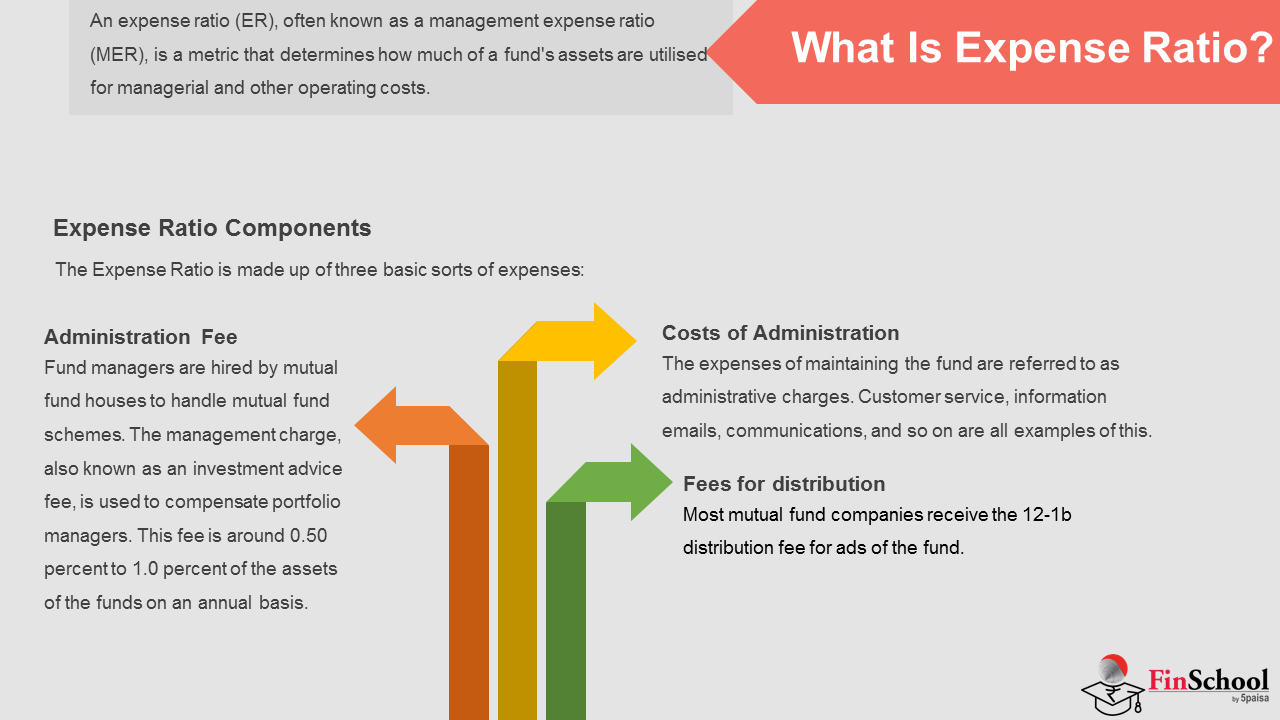
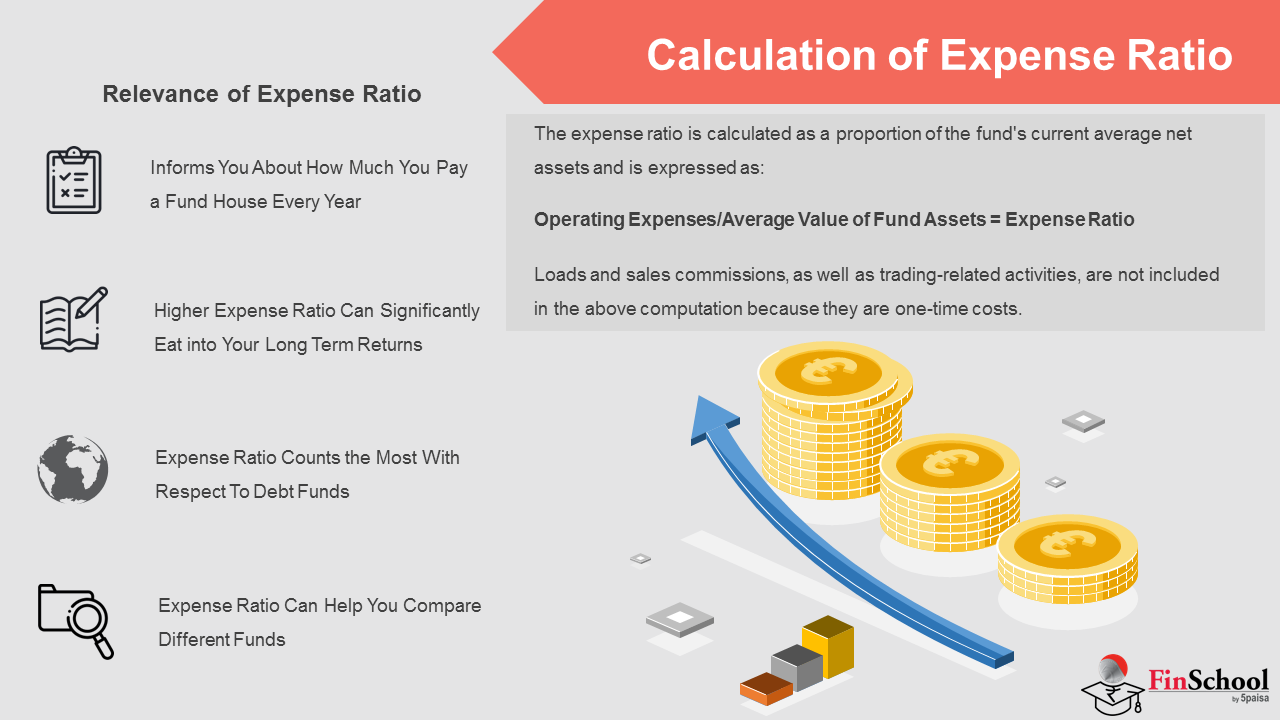
The expense ratio is a key concept every mutual fund investor should understand. It’s the portion of a fund’s assets that the AMC deducts each year to cover its costs, usually expressed as a percentage of those assets.
The Expense Ratio is made up of a few parts:
- Administration Fee: What fund managers earn for managing the fund — typically 0.5% to 1% of the fund’s assets annually.
- Administrative Costs: The day-to-day costs of running the fund, such as customer service and record-keeping.
- Distribution Fees: The costs incurred in promoting the fund to attract new investors.
The expense ratio matters because it directly reflects the cost of investing in a particular fund. If you invest ₹1,00,000 in a fund with a 1% expense ratio, for example, you’ll pay ₹1,000 in fees every year — so a fund delivering 10% gross returns effectively hands you 9% after fees.
Over time, even a modest difference in expense ratio can have an outsized impact on your final corpus.
For example:
- If you invest ₹1,00,000 and it compounds at 10% annually for 10 years, you’d end up with roughly ₹2.6 lakh. With a 2% expense ratio dragging your effective return down to 8%, you’d end up with only about ₹2.15 lakh.
- The expense ratio is especially important for debt funds, since their returns are typically more modest to begin with — a high expense ratio eats into those already-thin margins even more noticeably.
- When comparing mutual funds, the expense ratio deserves close attention, but it shouldn’t be the only factor — consistency of returns and the fund manager’s track record matter just as much.
Here is a simple example:
Suppose you invest ₹50,000 in a fund with a 1% expense ratio — the annual cost works out to ₹500. If the fund delivers a 12% gross return, that’s a gain of ₹6,000; after fees, your net gain is ₹5,500, meaning your actual return is closer to 11%, not the headline 12%.
4.3 Portfolio Turnover

Anand: What is portfolio turnover in a fund?
Ridhima: The portfolio turnover of a fund shows how often the fund manager of the mutual fund buys and sells securities.
Anand: Does a high portfolio turnover mean returns for the mutual fund?
Ridhima: Not always a high portfolio turnover can mean costs for the mutual fund and a low portfolio turnover can often signal stability in the mutual fund.
Anand: How is the portfolio turnover ratio of a fund measured?
Ridhima: The portfolio turnover ratio of a fund is measured by the formula: portfolio turnover ratio equals the lesser of the purchases or sales of the mutual fund divided by the average assets under management of the mutual fund.
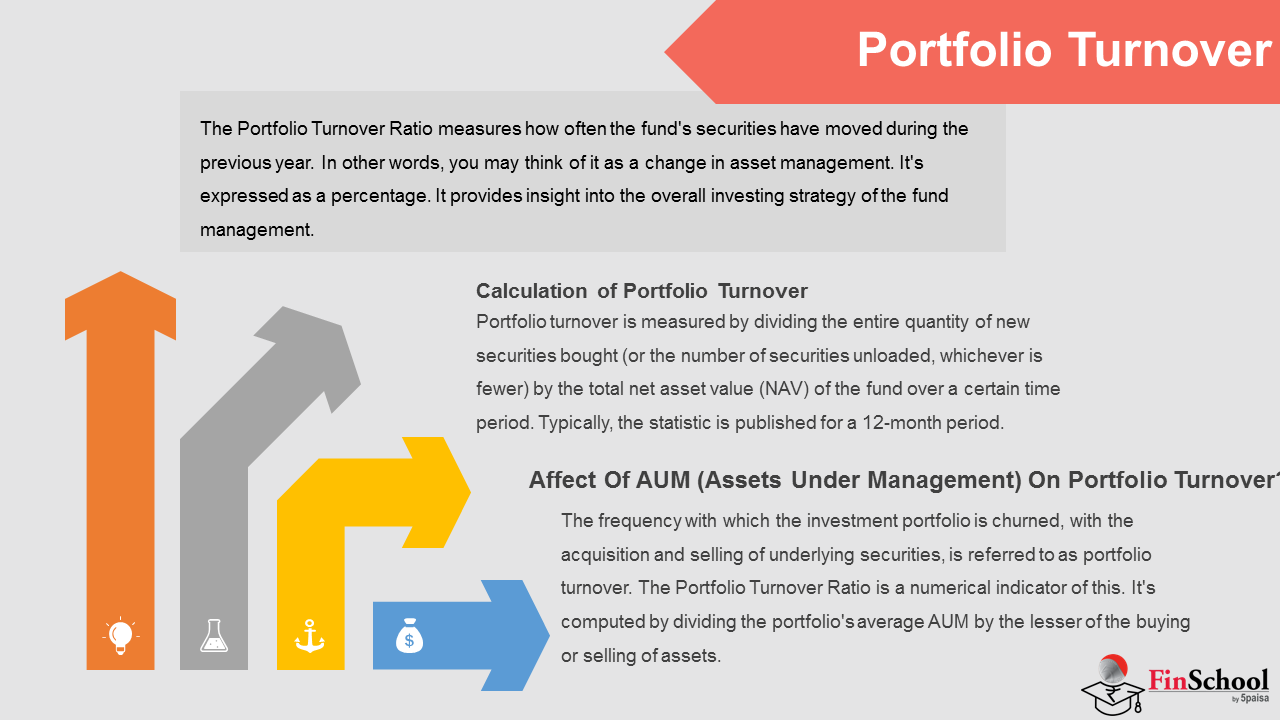
The Portfolio Turnover Ratio (PTR) is another important metric in evaluating a mutual fund. It measures how frequently the fund manager buys and sells securities, expressed as a percentage, and offers a window into the manager’s investing style.
A high PTR indicates the fund manager is trading securities frequently — which can be costly and isn’t always a sign of skill. A low PTR, by contrast, suggests a more measured approach that tends to be both less expensive and more stable.
The formula for the Portfolio Turnover Ratio is:
PTR = (Lesser of Purchases or Sales) / Average Assets Under Management
For example, suppose a fund bought securities worth ₹70 crore and sold securities worth ₹50 crore in a year, with average assets under management of ₹500 crore. The PTR would be:
PTR = 50 / 500 = 10%
This means 10% of the portfolio was churned during the year.
The Portfolio Turnover Ratio can affect investors in a few key ways:
- Costs: A high PTR can drive up costs, which in turn reduces net returns.
- Returns: A high PTR doesn’t necessarily translate into better returns — in fact, it can sometimes have the opposite effect.
- Strategy: The PTR offers useful insight into the fund manager’s overall investment strategy.
Assets Under Management (AUM) refers to the total value of investments a fund is managing — a useful gauge of the fund’s size and standing in the market.
AUM also has a direct bearing on the PTR: a larger AUM base tends to produce a lower PTR, even if the fund manager is actively buying and selling. For instance, if a fund sells ₹50 crore and buys ₹70 crore worth of securities in a year against an average AUM of ₹500 crore, the PTR still works out to 10% — even though a substantial amount of trading activity took place behind that number.
4.4 Exit Loads

Anand: What are exit loads in a fund?
Ridhima: Exit loads in a fund are fees that are charged if you withdraw your money from the mutual fund within a certain period of time.
Anand: Why do mutual funds charge exit loads?
Ridhima: Mutual funds charge exit loads to encourage investors to invest for the term and to protect the interests of the other investors, in the mutual fund.
Anand: Can you give me an example of how exit loads work in a fund?
Ridhima: For example if you withdraw ₹50,000 from a fund within a year and the exit load is 1 percent then you will have to pay an exit load of ₹500 and you will get back ₹49,500.
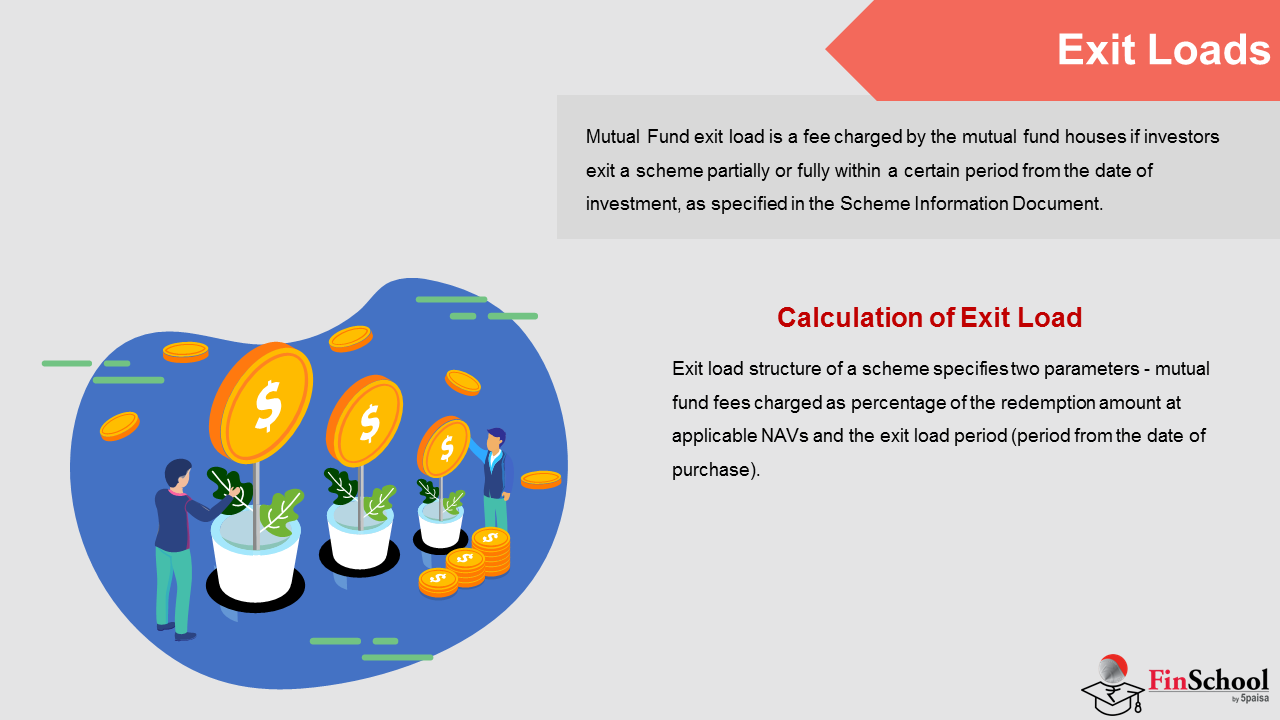
Exit loads are fees mutual fund companies charge when investors withdraw their money within a specified period, typically calculated as a percentage of the value being redeemed.
Their purpose is straightforward: to encourage investors to stay invested for a meaningful period, protect the interests of long-term unit-holders, and give the fund manager more room to make sound investment decisions without the pressure of frequent redemptions.
The exit load is determined by two factors:
- The percentage fee charged on the redemption amount.
- The exit load period — the window of time during which the fee applies.
For example, suppose a fund charges a 1% exit load on withdrawals made within 365 days. Withdrawing ₹50,000 after 4 months would incur:
Exit load = 1% × ₹50,000 = ₹500
You would receive ₹49,500 of the original ₹50,000.
Exit loads can get slightly more complex with SIP investments, since each instalment carries its own independent exit-load timeline.
Understanding exit loads matters because they directly affect how much money you actually receive on withdrawal. Short-term investors should pay close attention to a fund’s exit load structure to avoid unpleasant surprises, while long-term investors are unlikely to be affected, since they won’t be redeeming for a long while regardless.
When comparing mutual funds, it’s worth weighing the exit load alongside the expense ratio and historical returns — together, these give a much fuller picture of which fund is right for you.
Here’s another example: suppose you invest ₹20,000 in a fund with a 2% exit load applicable to withdrawals made within 6 months. If your investment grows to ₹22,000 and you withdraw after 3 months, the exit load works out to:
Exit load = 2% × ₹22,000 = ₹440
You would receive ₹21,560 of the ₹22,000.
Exit loads aren’t a permanent feature of every fund, and their purpose is simply to encourage disciplined investing and support sound fund management. Even so, it’s worth understanding the exit load structure of any fund you invest in, so you can plan ahead and avoid surprises when the time comes to withdraw.
Case Study: Exit Load in Practice
In December 2025, Karthik, a 32-year-old software engineer from Bengaluru, invested his annual bonus of ₹4 lakh into the HDFC Flexi Cap Fund — Direct Growth. His goal was to save for a home purchase within five years.
By May 2026, just five months later, Karthik and his wife finalised a 2BHK flat in Whitefield. To arrange the down payment, he redeemed his mutual fund investment.
- Fund Value at Redemption: ₹4.30 lakh
- Exit Load Policy: 1% if redeemed within 1 year
- Exit Load Deduction: ₹4,300 (1% of ₹4.30 lakh)
- Final Amount Credited: ₹4,25,700
Of this deduction, about ₹780 went as GST, while the remaining ₹3,520 was credited back to the scheme’s revenue account — meaning other investors in the fund indirectly benefited from his early withdrawal.
This case illustrates that exit loads aren’t simply a penalty; they also serve as a mechanism that protects long-term investors by discouraging short-term exits.
Key Lessons for Investors
- Understand Exit Load Timelines: Most equity funds in India charge 1% if redeemed within 1 year. Debt funds often have shorter exit load periods (30–90 days).
- Plan Liquidity Needs: If you anticipate needing funds within a year, avoid schemes with high exit loads.
- Impact on SIPs: Each SIP instalment has its own exit load timeline. Redeeming early can trigger multiple deductions.
- Compare Funds: Some fund houses like ICICI Prudential and WhiteOak Capital have reduced or eliminated exit loads to attract investors.
Practical Checklist Before Investing
- Check Exit Load Policy in the Scheme Information Document.
- Match Investment Horizon with fund rules to avoid surprises.
- Compare Alternatives: Some funds now offer lower or nil exit loads.
- Factor in Taxes: Even if exit loads are low, short-term capital gains tax applies if redeemed within a year.