9.1. What is Open Interest Spurts and 4 quadrants??
“Open interest spurts” and the concept of “four quadrants” are terms often used in the analysis of open interest dynamics, particularly in the context of options trading. Let’s explore each term:
Open Interest Spurts:
- Open interest spurts refer to sudden and significant increases or decreases in the open interest of a particular options contract.
- These spurts can indicate a surge in market activity and interest in that specific options contract.
- Open interest spurts are often analysed alongside price movements and trading volume to assess market sentiment and potential price direction.
Four Quadrants:
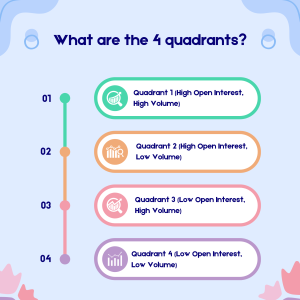
The concept of four quadrants categorizes options contracts based on their open interest and volume dynamics. It helps traders identify potential trading opportunities and assess market sentiment.
The four quadrants are formed by the combination of high/low open interest and high/low trading volume:
- Quadrant 1 (High Open Interest, High Volume): Contracts in this quadrant are actively traded with high open interest, indicating significant market interest and participation. These contracts may be associated with major market events or significant price movements.
- Quadrant 2 (High Open Interest, Low Volume): Contracts in this quadrant have high open interest but low trading volume. This could suggest that positions are being held rather than actively traded. Traders may interpret this as potential support or resistance levels, depending on whether the contracts are call or put options.
- Quadrant 3 (Low Open Interest, High Volume): Contracts in this quadrant have low open interest but high trading volume. This could indicate speculative activity or short-term trading interest. Traders may look for changes in open interest to confirm market sentiment and potential price direction.
- Quadrant 4 (Low Open Interest, Low Volume): Contracts in this quadrant have low open interest and low trading volume. These contracts may have limited liquidity and interest from market participants. Traders may be cautious when trading options in this quadrant due to potential slippage and wider bid-ask spreads.
9.2. What are the Implications of Open Interest Spurts and 4 Quadrant?

Open Interest Spurts

Open interest refers to the total number of outstanding derivative contracts, such as futures or options, that have not been settled. When there’s a sudden increase or decrease in open interest, it can indicate several things:
- Market Sentiment: A surge in open interest suggests that more traders are entering positions, indicating a growing interest or consensus about the direction of the market. For instance, a sharp increase in open interest for call options may signal bullish sentiment.
- Market Volatility: Rapid changes in open interest can indicate increased market volatility. This could be due to unexpected news, economic events, or speculative trading activity.
- Price Trend Confirmation: A rise in open interest alongside a price uptrend can validate the strength of the trend. Similarly, a decline in open interest during a price rally may indicate weakening momentum.
- Potential Breakout or Reversal: A sudden surge in open interest, especially accompanied by significant price movement, may suggest a potential breakout or reversal in the underlying asset’s price.
- Liquidity and Market Depth: Higher open interest generally indicates greater liquidity and market depth, making it easier for traders to enter and exit positions without significantly impacting prices.
- Rolling Positions: In futures markets, increases in open interest can also be attributed to traders rolling over their positions from one contract month to another, especially nearing expiration.
- Unwinding Positions: Conversely, a decrease in open interest may indicate traders closing out their positions, possibly due to profit-taking, loss-cutting, or changing market conditions.
- Options Activity: In options markets, changes in open interest can provide insights into where traders anticipate future price movements. Increases in open interest for specific strike prices can indicate areas of support or resistance.
- Hedging Activity: Large institutions or traders may use derivatives to hedge their positions in the underlying asset, leading to changes in open interest as they adjust their hedge ratios.
9.3.-4 Quadrants Implications

In the context of open interest, the concept of “4 quadrants” is often associated with analysing options data using a matrix that categorizes options trades based on their impact on open interest and price. Here’s a breakdown of the implications of each quadrant:
Quadrant 1 : Long Call / Long Put (Increase in Open Interest, Increase in Price):
- Implication: In this quadrant, both the open interest and the price of the underlying asset increase. It suggests a bullish outlook, where investors are buying call options (anticipating a price increase) or put options (hedging against a potential decline).
- Market Sentiment: Positive sentiment prevails, as traders are betting on higher prices or protecting against downside risk.
Quadrant 2 : Short Call / Short Put (Decrease in Open Interest, Increase in Price):
- Implication: Here, open interest decreases while the price of the underlying asset rises. It implies that options writers are closing out their positions, leading to a reduction in open interest. This could occur when call option sellers buy back their contracts to close their positions in response to a rising market.
- Market Sentiment: While the increase in price is bullish, the decrease in open interest may suggest a weakening of the bullish sentiment as options writers exit their positions.
Quadrant 3 : Short Call / Long Put (Increase in Open Interest, Decrease in Price):
- Implication: In this quadrant, open interest increases while the price of the underlying asset decreases. It indicates bearish sentiment, where investors are buying put options (betting on a price decline) or selling call options (anticipating no upward movement).
- Market Sentiment: Negative sentiment prevails, with investors expecting lower prices or hedging against potential losses.
Quadrant 4 : Long Call / Short Put (Decrease in Open Interest, Decrease in Price):
- Implication: Here, both open interest and the price of the underlying asset decrease. It suggests a bearish outlook, where investors are selling call options (betting against a price increase) or buying put options (hedging against further declines).
- Market Sentiment: Bearish sentiment dominates, with traders expecting further declines or protecting against downside risk.
9.4. Trading Strategies based on 4 Quadrants
Trading strategies based on the four quadrants of open interest can help traders make informed decisions by aligning their positions with market sentiment and price trends. Here are some strategies for each quadrant:
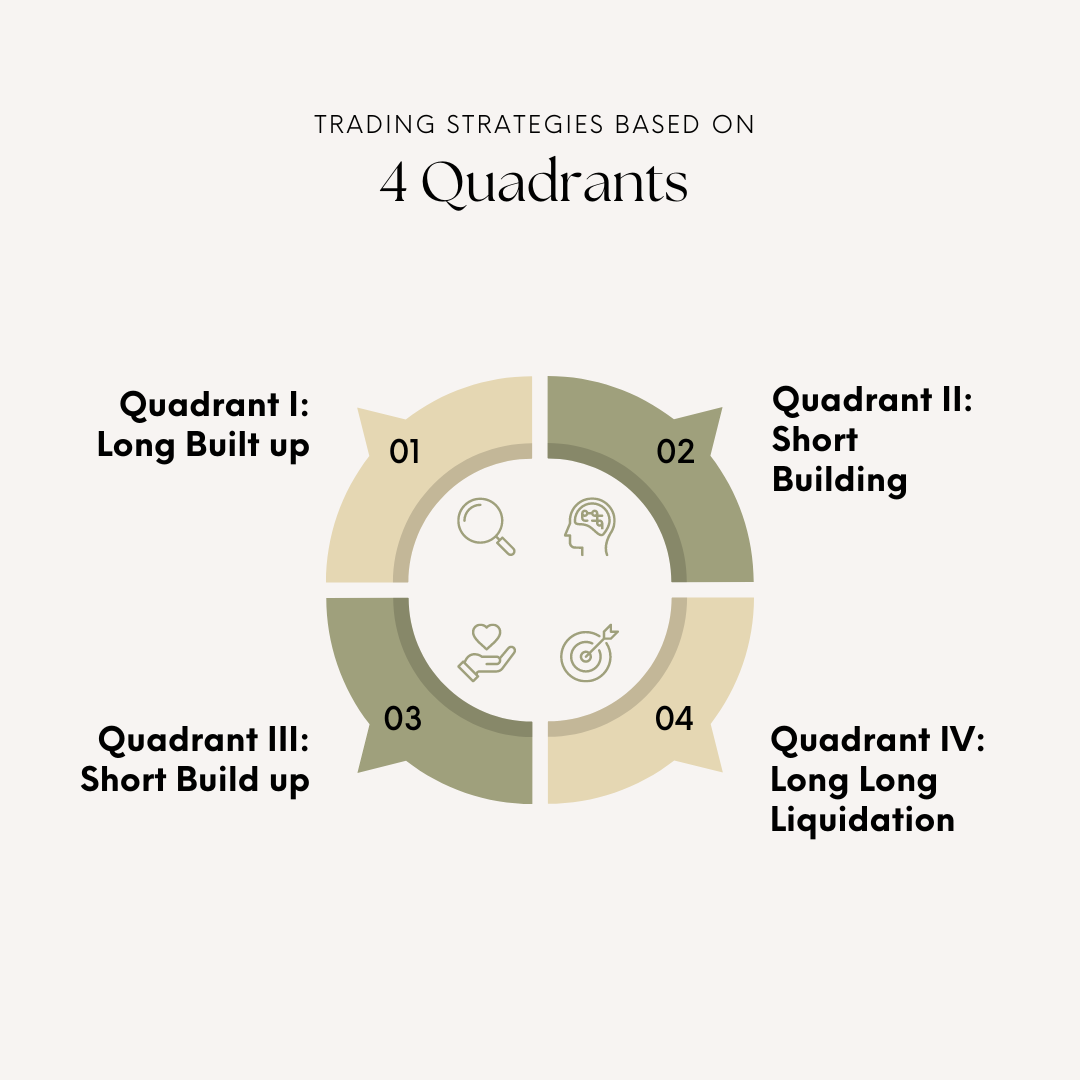
Long Built up
Long built up means more people are expecting the prices to go up and creating Long positions. Here the trader can simply look at Price and Open Interest to get an idea. If the price and Open Interest goes up then it is Long buildup. This signifies more traders are expecting the prices to go up. So if for a strike price open interest is increasing and stock prices are also moving up then it is said that long positions are being created. So increase in open interest with price increase can be taken as positive signal.
Short Covering
People having short position will have to Buy the positions. The open interest will decrease if the short positions are covered. The price will increase and open interest will decrease. This signifies Short covering. Stock or who sold it first without having it are now buying it. This will create a demand for the stock and it will move up. Short covering causes good movement in stock prices and often people ride it for good use. The heavier the open interest or short positions created the bigger the positive direction move is.
Short Built-up
Short built up means more people are expecting the prices to go down and creating Short positions. You can simply look at Price and Open Interest to get an idea. If the price goes down and Open Interest goes up then it is Short buildup. This signifies more traders are expecting the prices to go down. So if for strike price open interest is increasing and stock prices is going down then it is said that short is building and people are feeling that prices will go down further.
Long Liquidation
Futures and Options are one month affair as mentioned above. The concept remains the same. People who have Long positions will have to sell the positions. The open interest will decrease if Long positions are sold off. The price will decrease and Open interest will also decrease. This signifies Long Liquidation or Long unwinding. Long Unwinding causes the prices to go down. The trader can visualize it like if prices are going up then people are booking profit causing open interest to go down. This signifies that stock may move down in following days as bullish view people are booking profit and this may cause the stock price to go down.
9.5 How do we correlate change in OI with change in price?
This aspect forms the core of the entire Open Interest analysis. The real useful information that can be used for actual trading is how we analyse change in OI with respect to change in price of the contract. In fact the change in price is actually an outcome of change in OI. It is an outcome of demand and supply. In derivative trading options sellers are suppliers whereas option buyers create demand. There will be times when demand is high and sometimes supply is higher. When the supply is higher the option prices tend to drop and when demand is higher the prices tend to rise.
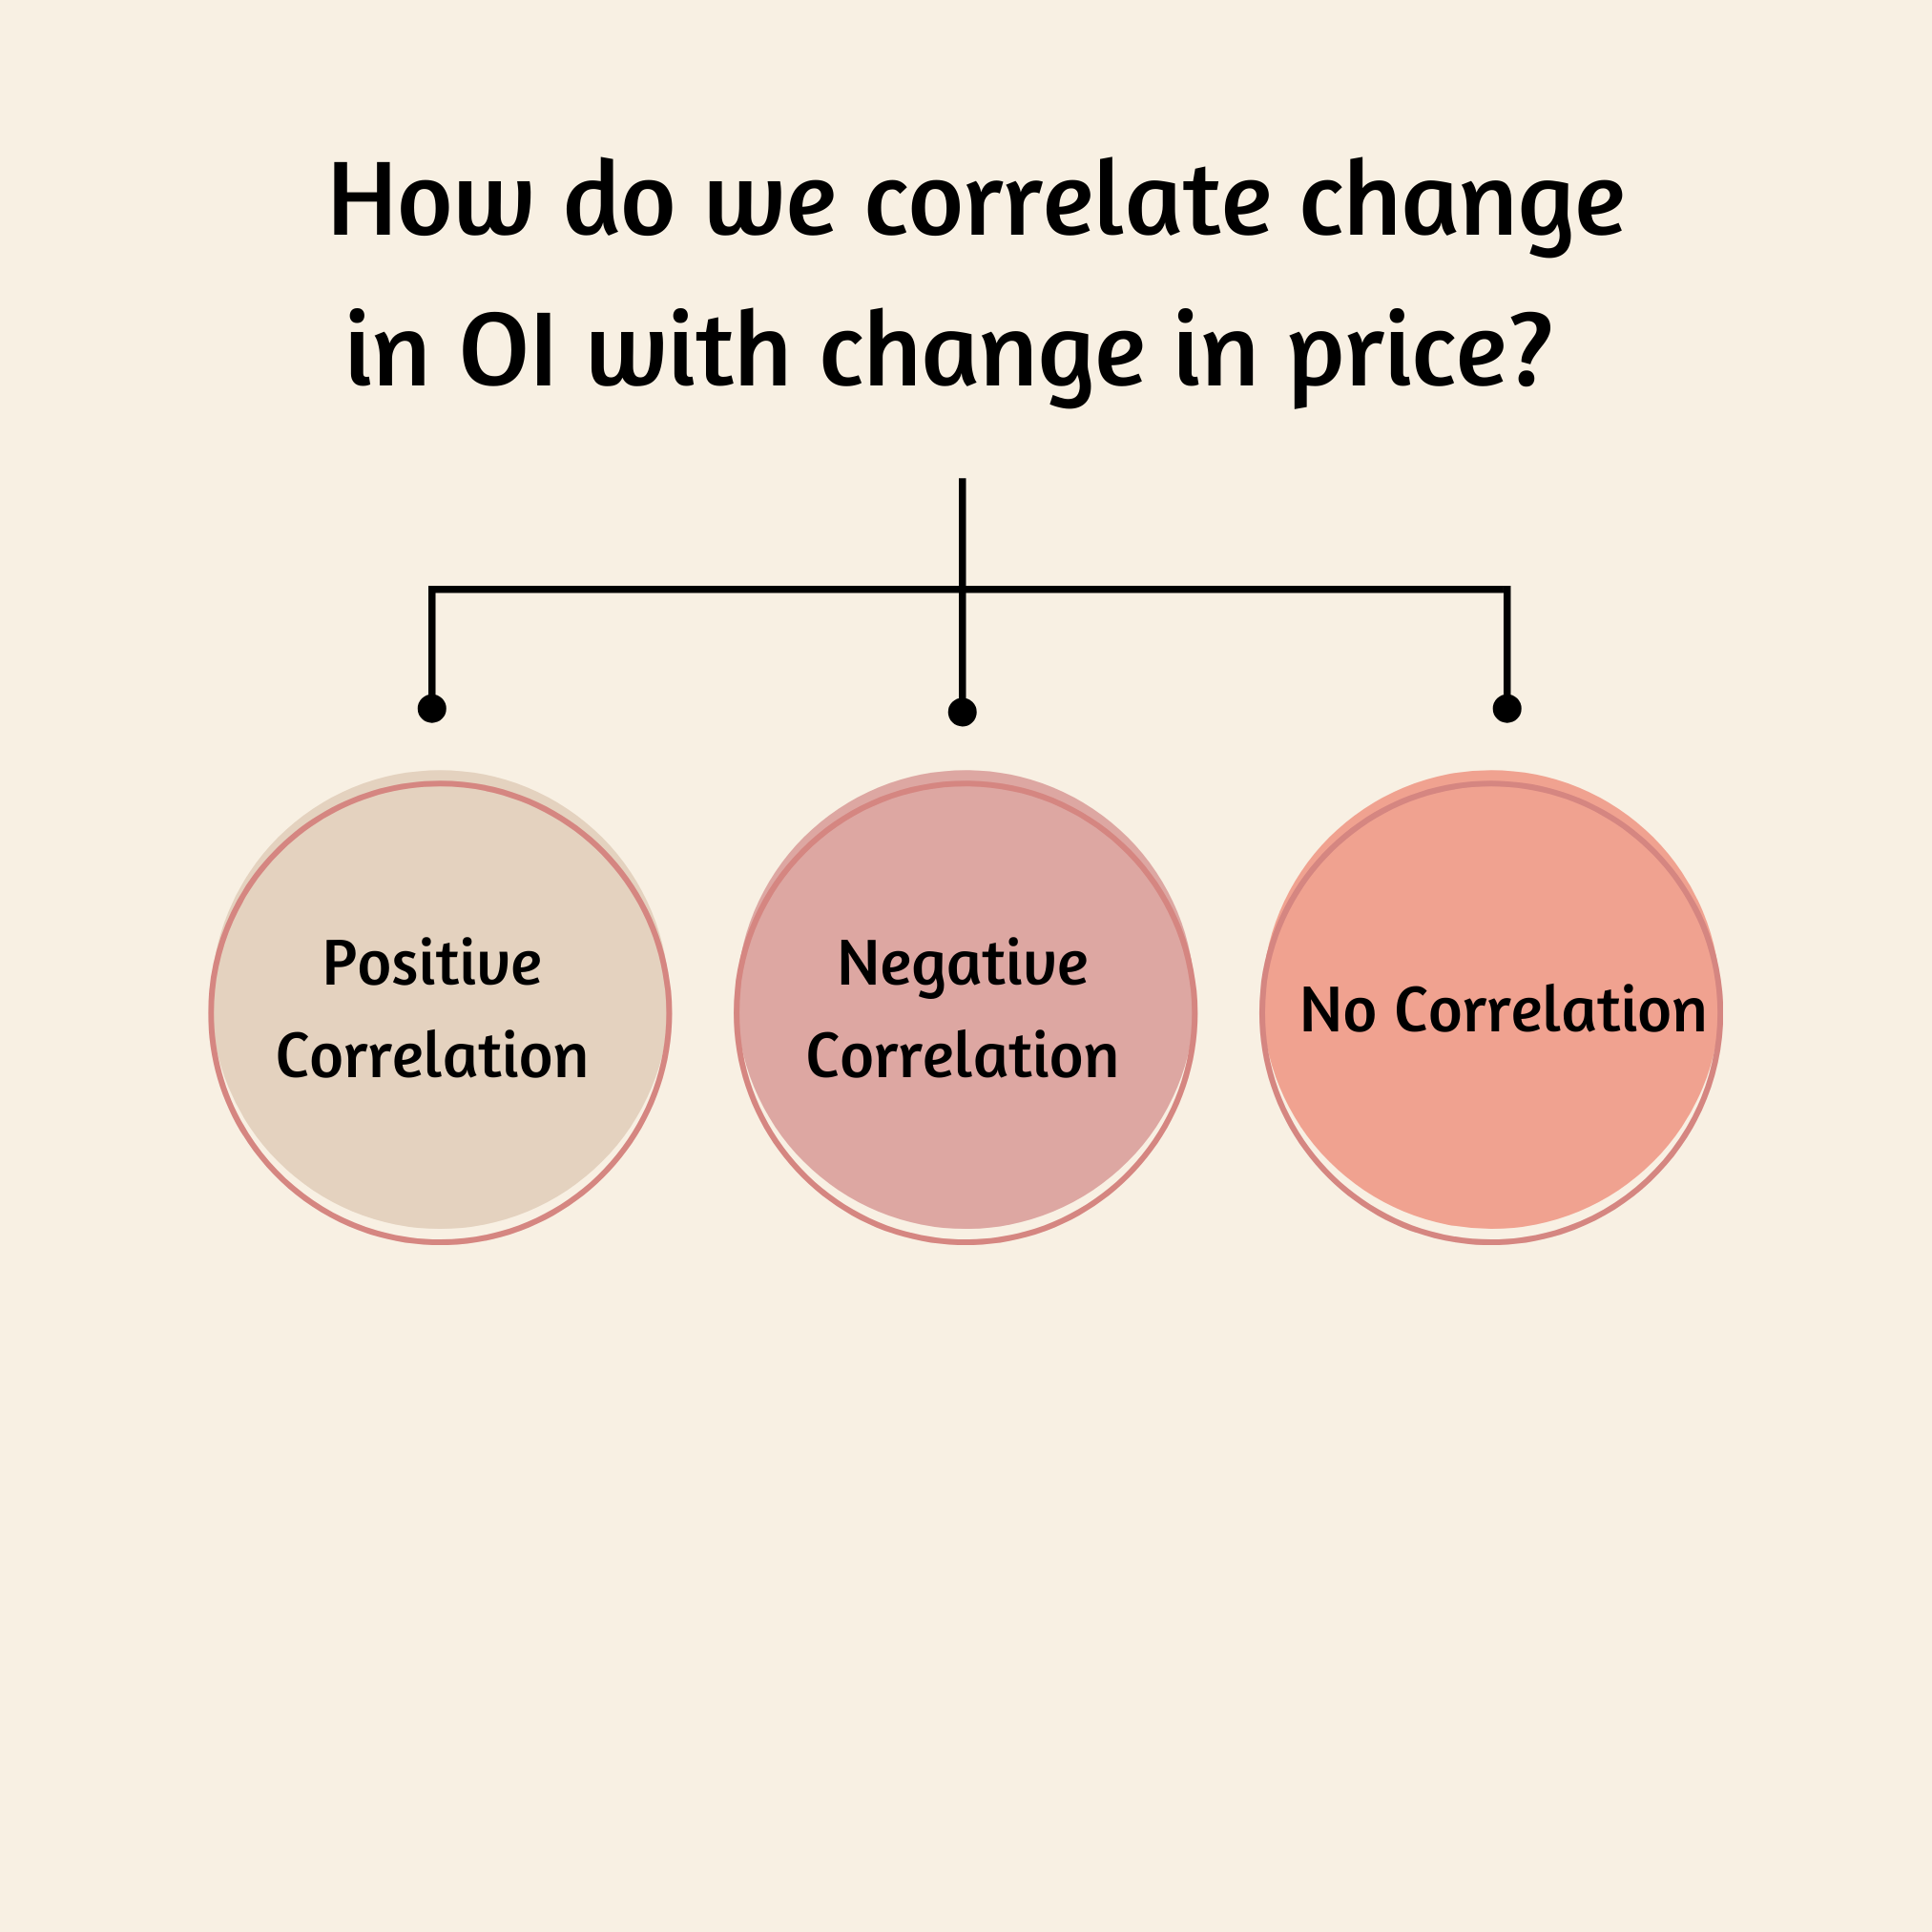
Correlating changes in open interest (OI) with changes in price involves analyzing the relationship between these two variables to gain insights into market sentiment and potential future price movements. Here’s how you can do it:
- Positive Correlation: When changes in open interest are positively correlated with changes in price, it suggests that as open interest increases (or decreases), the price tends to move in the same direction. This indicates a strong trend confirmation. For example:
- Increase in OI and Increase in Price: Bullish sentiment may be confirmed when both open interest and price rise together, indicating new buyers entering the market.
- Decrease in OI and Decrease in Price: Bearish sentiment may be confirmed when both open interest and price decline together, indicating existing holders closing out positions
- Negative Correlation: Conversely, when changes in open interest are negatively correlated with changes in price, it suggests an inverse relationship. This can indicate potential reversals or divergences in market sentiment. For example:
- Increase in OI and Decrease in Price: This divergence might suggest weakening bullish sentiment, with new short positions being established.
- Decrease in OI and Increase in Price: Similarly, this divergence might suggest weakening bearish sentiment, with short positions being covered or profit-taking occurring.
- No Correlation: In some cases, changes in open interest may show no clear correlation with changes in price. This could indicate periods of market indecision, consolidation, or conflicting trading activity among market participants.
To analyze these correlations effectively:
- Track Historical Data: Look at historical patterns to identify trends in the relationship between OI and price movements for the specific asset or market you’re trading.
- Use Technical Indicators: Combine OI analysis with technical indicators such as moving averages, momentum oscillators, or volume analysis to confirm signals and assess market trends.
- Consider Market Context: Factor in broader market conditions, news events, and economic indicators that may influence market sentiment and price movements.
Key Takeaways
- In Quadrant 1 both the open interest and the price of the underlying asset increase. It suggests a bullish outlook, where investors are buying call options (anticipating a price increase) or put options (hedging against a potential decline).
- In Quadrant 2 open interest decreases while the price of the underlying asset rises. It implies that options writers are closing out their positions, leading to a reduction in open interest. This could occur when call option sellers buy back their contracts to close their positions in response to a rising market.
- In Quadrant 3 open interest increases while the price of the underlying asset decreases. It indicates bearish sentiment, where investors are buying put options (betting on a price decline) or selling call options (anticipating no upward movement).
- In Quadrant 4 open interest and the price of the underlying asset decrease. It suggests a bearish outlook, where investors are selling call options (betting against a price increase) or buying put options (hedging against further declines).