12.1. Long and Short trades using 2 candles theory

The “2 candles theory” you’re referring to is a basic technical analysis concept used in trading. It involves observing the patterns formed by the relationship between two consecutive candlesticks on a price chart to make trading decisions. Here’s how you can initiate long and short trades using this theory:
Long Trade:
- Identify Bullish Signal: Look for two consecutive candlesticks where the second candlestick closes higher than the first one, indicating bullish momentum.
- Confirmation: Ensure that the bullish pattern is supported by other technical indicators or market conditions to confirm the strength of the signal.
- Entry Point: Enter the trade at the opening of the candlestick following the second bullish candle, or you can wait for a pullback to a key support level to enter at a better price.
- Stop Loss: Set a stop-loss order below the low of the second candlestick to protect your position in case the market reverses.
- Take Profit: Set a target for taking profits based on your risk-reward ratio, technical analysis, or key resistance levels.
Short Trade:
- Identify Bearish Signal: Look for two consecutive candlesticks where the second candlestick closes lower than the first one, indicating bearish momentum.
- Confirmation: Confirm the bearish pattern with other technical indicators or market conditions to ensure the validity of the signal.
- Entry Point: Enter the trade at the opening of the candlestick following the second bearish candle, or wait for a retracement to a key resistance level to enter at a better price.
- Stop Loss: Place a stop-loss order above the high of the second candlestick to limit losses if the market reverses against your position.
- Take Profit: Set a target for taking profits based on your risk-reward ratio, technical analysis, or key support levels. Position size according to the volatility of the market and the distance to your stop-loss level.
12.2. How to use OI Expiry day strategy
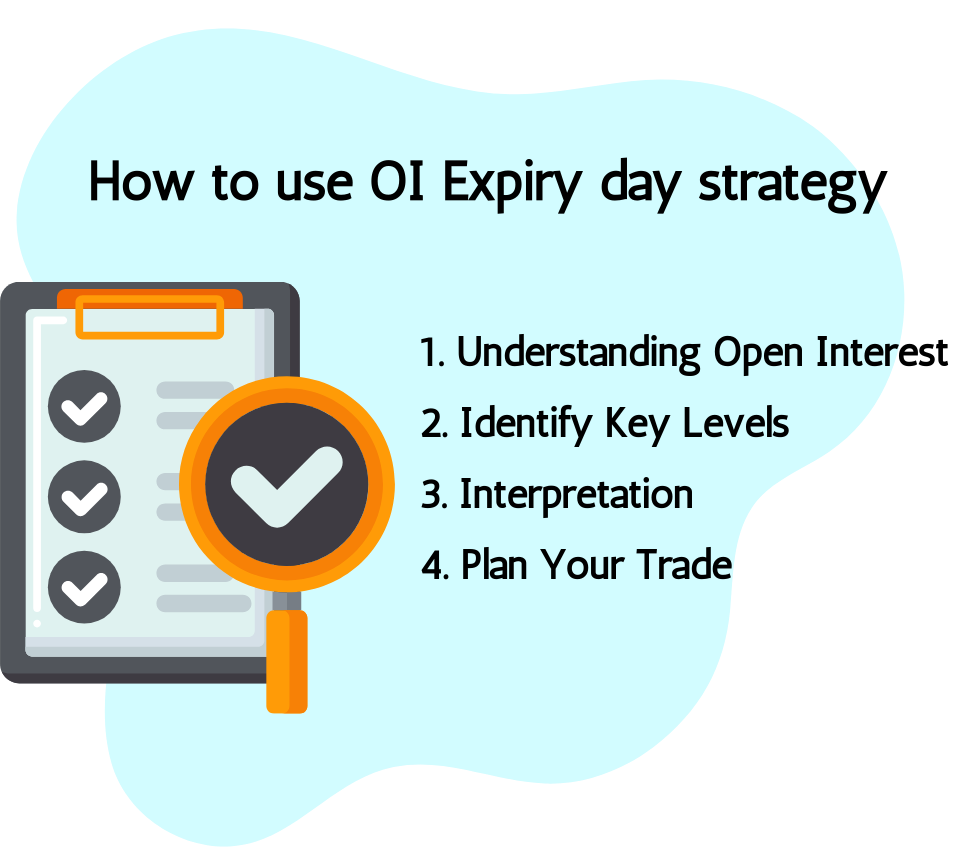
The Open Interest (OI) Expiry Day strategy is a trading approach based on analyzing the open interest data of options contracts on the day of their expiration. Open interest represents the total number of outstanding options contracts that have not been closed or exercised. Here’s how you can use this strategy:
- Understanding Open Interest:
- Increasing Open Interest: If the open interest of a particular options contract is increasing, it suggests that new positions are being added, indicating potential bullish or bearish sentiment depending on whether it’s calls or puts.
- Decreasing Open Interest: Conversely, decreasing open interest suggests that positions are being closed out, which may indicate waning interest in the underlying asset.
- Identify Key Levels:
- Key Strikes: Look for options strikes with significant open interest. These levels can act as potential support or resistance areas.
- Interpretation:
- Buildup of Open Interest: If there’s a significant buildup of open interest at a particular strike price, it could imply that market participants expect the underlying asset to reach that price by expiration.
- Unwinding of Open Interest: On the other hand, if there’s a sudden unwinding of open interest at a specific strike price, it might suggest a change in sentiment or a lack of conviction among market participants.
- Plan Your Trade:
- Directional Bias: Based on your analysis of open interest data and other technical indicators, decide whether you have a bullish, bearish, or neutral bias for the underlying asset.
- Entry and Exit Points: Determine your entry and exit points based on key support and resistance levels identified from the open interest data and other technical analysis tools.
- Risk Management:
- Stop Loss: Always use stop-loss orders to limit potential losses in case the market moves against your position.
- Position Sizing: Manage your position size according to your risk tolerance and the distance to your stop-loss level.
- Monitor Market Conditions:
- Intraday Monitoring: Keep a close eye on intraday developments in open interest and price action, as these can provide valuable insights into market sentiment and potential price movements.
Example Scenario:
- Increasing Open Interest in Call Options: If you notice a significant increase in open interest in call options at a particular strike price, it could indicate bullish sentiment among market participants. You might consider entering a long position in the underlying asset or buying call options with a target price based on your analysis.
- Decreasing Open Interest in Put Options: Conversely, if there’s a decrease in open interest in put options at a specific strike price, it might suggest weakening bearish sentiment. You could interpret this as a potential opportunity to enter a bullish trade or sell put options with a target price based on your analysis.
Important Considerations:
- Data Accuracy: Ensure that you’re using reliable open interest data from a reputable source.
- Volatility: High volatility on expiry day can make trading more challenging, so exercise caution and adjust your trading strategy accordingly.
- Market Conditions: Market sentiment and conditions can change rapidly, so remain flexible and adapt your strategy as needed.
- Practice: Before implementing this strategy with real money, consider practicing it on paper or with a demo account to gain experience and confidence.
12.3. How to Build long and short trade using the Trending OI Crossover Strategy on the live chart
The Trending Open Interest (OI) Crossover Strategy is a trading approach that involves analyzing the crossover of the open interest trend with the price trend to identify potential trading opportunities. Here’s how you can build long and short trades using this strategy on a live chart:
Long Trade:
1. Identify the Trending OI Crossover:
- Look for a bullish crossover where the open interest trend crosses above the price trend. This indicates increasing interest in the underlying asset, potentially signaling a bullish trend reversal or continuation.
2. Confirmation:
- Confirm the bullish crossover with other technical indicators such as moving averages, volume analysis, or momentum indicators to strengthen the validity of the signal.
3. Entry Point:
- Enter a long trade at the confirmation of the bullish crossover, preferably at a pullback or retest of a support level to improve the risk-reward ratio.
4. Stop Loss:
- Place a stop-loss order below the recent swing low or a key support level to limit potential losses if the trade goes against you.
5. Take Profit:
- Set a target for taking profits based on resistance levels, Fibonacci extensions, or previous swing highs to capture potential gains.
Short Trade:
1. Identify the Trending OI Crossover:
- Look for a bearish crossover where the open interest trend crosses below the price trend. This indicates increasing interest in short positions or potential weakness in the underlying asset.
2. Confirmation:
- Confirm the bearish crossover with other technical indicators such as moving averages, volume analysis, or momentum indicators to strengthen the validity of the signal.
3. Entry Point:
- Enter a short trade at the confirmation of the bearish crossover, preferably at a retracement or retest of a resistance level to improve the risk-reward ratio.
4. Stop Loss:
- Place a stop-loss order above the recent swing high or a key resistance level to limit potential losses if the trade moves against you.
5. Take Profit:
- Set a target for taking profits based on support levels, Fibonacci retracements, or previous swing lows to capture potential gains.
Risk Management:
- Manage your risk by using appropriate position sizing and stop-loss orders.
- Avoid risking more than a certain percentage of your trading capital on any single trade.
- Adjust your position size according to the volatility of the market and the distance to your stop-loss level.
Monitoring:
- Continuously monitor the price action and open interest trend on the live chart to assess the validity of the trading signal and make necessary adjustments to your trade.
Example:
- Suppose you observe a bullish crossover where the open interest trend crosses above the price trend on a live chart. After confirming the signal with other technical indicators, you enter a long trade at a pullback to a key support level. You place a stop-loss order below the recent swing low and set a take-profit target at a resistance level identified from your analysis.
- Conversely, if you notice a bearish crossover where the open interest trend crosses below the price trend, and after confirmation with other indicators, you enter a short trade at a retracement to a key resistance level. You place a stop-loss order above the recent swing high and set a take-profit target at a support level identified from your analysis.
Remember, while the Trending OI Crossover Strategy can be a valuable tool in your trading arsenal, it’s essential to combine it with other technical analysis techniques and market analysis for more reliable trading decisions. Additionally, practice on a demo account or with small positions before implementing any new strategy in live trading.
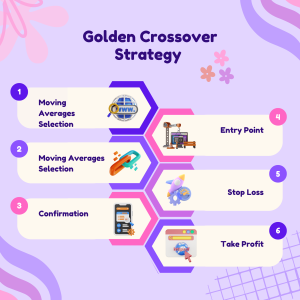
12.4 Golden Crossover Strategy

The Golden Crossover Strategy is a popular technical analysis approach used by traders to identify potential bullish trends in the market. It involves the crossover of two moving averages: a shorter-term moving average crossing above a longer-term moving average. Here’s how you can implement the Golden Crossover Strategy:
Strategy Overview:
- Moving Averages Selection:
Choose two moving averages, typically the 50-day and 200-day moving averages. However, you can adjust these parameters based on the timeframe and volatility of the asset you’re trading.
- Golden Crossover Signal:
The Golden Crossover occurs when the shorter-term moving average (e.g., 50-day MA) crosses above the longer-term moving average (e.g., 200-day MA). This crossover is interpreted as a bullish signal, suggesting a potential uptrend in the price.
- Confirmation:
Confirm the Golden Crossover signal with other technical indicators or chart patterns to strengthen the validity of the signal. This may include volume analysis, momentum indicators, or support/resistance levels.
- Entry Point:
Enter a long trade when the Golden Crossover is confirmed. Some traders prefer to wait for a pullback or retest of the moving averages to enter at a better price.
- Stop Loss:
Place a stop-loss order below the recent swing low or a key support level to limit potential losses if the trade moves against you.
- Take Profit:
Set a target for taking profits based on resistance levels, Fibonacci extensions, or previous swing highs to capture potential gains. Alternatively, use a trailing stop-loss to ride the trend until it shows signs of reversal.
Example Trade:
- Golden Crossover Signal: On a price chart, you observe the 50-day moving average crossing above the 200-day moving average, indicating a Golden Crossover.
- Confirmation: Volume analysis shows an increase in trading volume during the crossover, supporting the bullish signal.
- Entry Point: You enter a long trade at the confirmation of the Golden Crossover, either at the crossover point or during a pullback to the moving averages.
- Stop Loss: You place a stop-loss order below the recent swing low or a key support level to manage risk.
- Take Profit: Set a target for taking profits based on resistance levels or use a trailing stop-loss to capture gains as the trend progresses.
Risk Management:
- Use appropriate position sizing and risk management techniques to protect your capital.
- Avoid risking more than a certain percentage of your trading capital on any single trade.
- Adjust your position size according to the volatility of the market and the distance to your stop-loss level.
Monitoring:
- Continuously monitor the price action and the relationship between the moving averages to assess the strength of the trend and make necessary adjustments to your trade.
- The Golden Crossover Strategy can be a valuable tool for identifying potential bullish trends in the market. However, like any trading strategy, it’s essential to combine it with other technical analysis techniques and market analysis for more reliable trading decisions. Additionally, practice on a demo account or with small positions before implementing any new strategy in live trading.
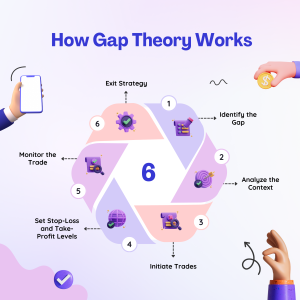
12.5 How Gap Theory Works
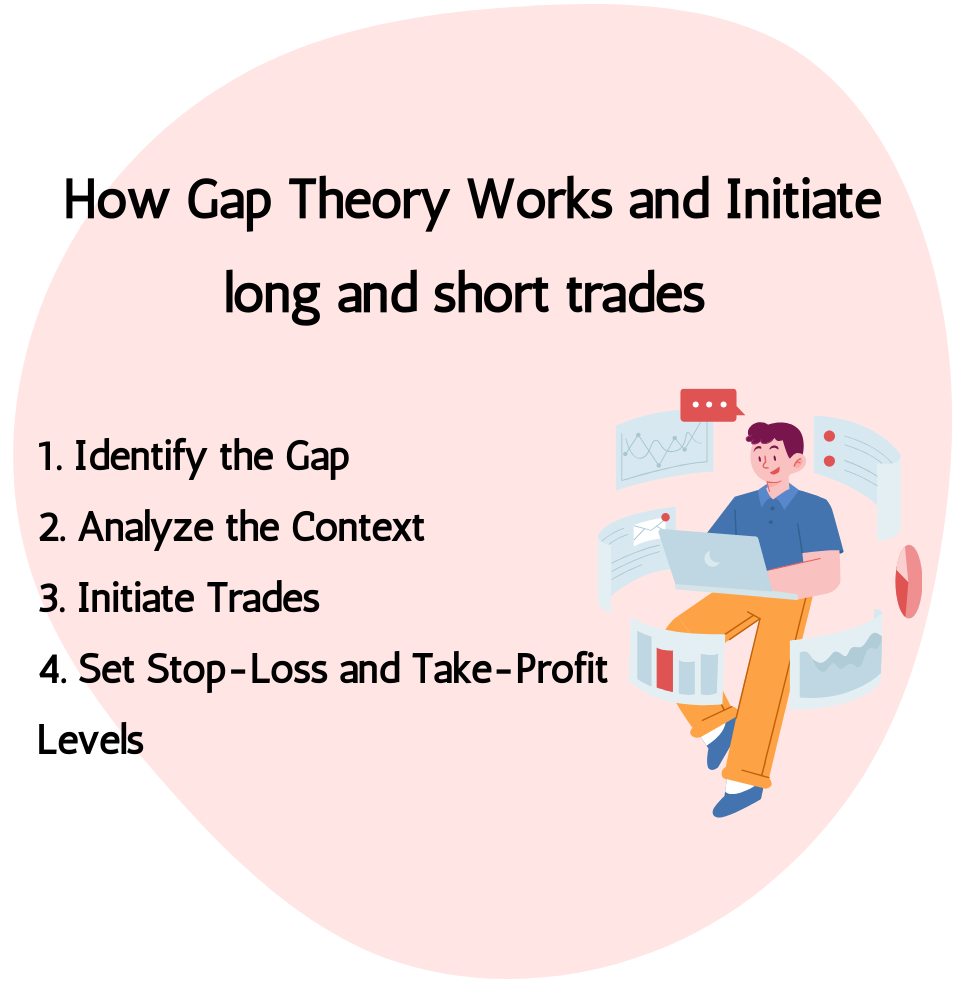
Gap theory is a trading strategy that involves identifying and exploiting gaps in price movement on a financial instrument’s chart, typically stocks, commodities, or forex pairs. These gaps occur when there is a significant difference between the closing price of the previous trading session and the opening price of the next session. Gap theory suggests that these gaps tend to be filled, meaning the price eventually returns to the level at which the gap occurred.
Here’s how the gap theory generally works:
Identify the Gap: The first step is to identify a gap on the price chart. There are three types of gaps:
- Common Gap: Occurs frequently and is often filled quickly.
- Breakaway Gap: Forms at the beginning of a new trend and may not be filled for a significant amount of time.
- Exhaustion Gap: Occurs near the end of a trend and signifies a final push before a reversal.
Analyze the Context: Determine the context in which the gap occurred. Consider factors such as the prevailing trend, trading volume, news events, and market sentiment.
Initiate Trades:
- Long Trade: If the gap is a common or exhaustion gap and is likely to be filled, traders might initiate a long trade, anticipating that the price will move back up to fill the gap. Entry can occur either immediately after the gap or after confirmation of a reversal pattern.
- Short Trade: In the case of a breakaway gap, where the price is expected to continue moving in the direction of the gap, traders might initiate a short trade to capitalize on the continuation of the trend. Entry can occur after confirmation of the trend direction.
Set Stop-Loss and Take-Profit Levels: To manage risk, set stop-loss orders to limit potential losses if the trade goes against expectations. Take-profit orders can be set to lock in profits once the price has filled the gap or reached a predetermined target.
Monitor the Trade: Keep a close eye on the trade, monitoring price action, volume, and any relevant news or events that could impact the trade.
Exit Strategy: Close the trade when the price reaches the take-profit level, or if the trade is not going as planned and hits the stop-loss level.
It’s important to note that while gap trading can be profitable, it also carries risks. Not all gaps get filled, and sometimes the price can continue moving further away from the gap, resulting in losses. Therefore, it’s essential to conduct thorough analysis and use risk management techniques when implementing a gap trading strategy. Additionally, back testing and practicing on a demo account can help traders gain familiarity and confidence with this approach before risking real capital.
12.6 What is Opening Trade Strategy??

An opening trade strategy focuses on taking advantage of price movements that occur at the opening of a trading session, such as the stock market opening bell or the opening of a particular market segment. Here’s a general outline of an opening trade strategy:

Pre-Market Analysis:
- Conduct thorough pre-market analysis to identify potential trading opportunities. This analysis should consider factors such as:
- Overnight news and events that may affect market sentiment.
- Pre-market price action and volume.
- Key levels of support and resistance.
- Any relevant technical indicators or chart patterns.
Set Trading Plan:
- Based on your pre-market analysis, establish a clear trading plan that outlines:
- Entry criteria: Define specific conditions or setups that must be met before initiating a trade.
- Stop-loss and take-profit levels: Determine the price levels at which you will exit the trade to manage risk and lock in profits.
- Position size: Calculate the appropriate position size based on your risk tolerance and the distance to your stop-loss level.
- Duration: Decide whether the trade will be executed as a day trade or if it will be held overnight.
Monitor Market Open:
- Pay close attention to the market open, as this period often sees increased volatility and rapid price movements. Use a combination of real-time market data, charts, and news feeds to monitor price action and volume.
Execute Trade:
- Once the trading session begins and your predefined entry criteria are met, execute the trade according to your plan. Ensure that you use proper order types (such as market orders or limit orders) to enter the trade at your desired price.
Manage Trade:
- After entering the trade, actively manage it by monitoring price movements and adjusting your stop-loss and take-profit levels if necessary. Be prepared to exit the trade if the market moves against your position or if your profit target is reached.
Review and Learn:
- After the trade is closed, take the time to review your performance and analyze the outcome. Identify any strengths or weaknesses in your trading plan and execution, and use this information to refine your strategy for future trades.
Risk Management:
- Throughout the entire process, prioritize risk management to protect your capital. This includes using appropriate position sizing, setting stop-loss orders, and avoiding overleveraging.
- It’s important to remember that trading during the opening of a trading session can be particularly volatile, so exercise caution and remain disciplined in following your trading plan. Additionally, practice and experience can help you become more adept at executing opening trade strategies effectively.
12.7 How to initiate Long and short positions using the BTST Strategy

The BTST (Buy Today Sell Tomorrow) strategy is commonly used in stock trading, allowing traders to initiate positions today and sell them on the following trading day. Here’s how you can initiate long and short positions using the BTST strategy in live trades:
- Long Position (BTST Buy):
- Identify Potential Stocks: Conduct thorough research and analysis to identify stocks that have strong potential for price appreciation in the short term.
- Place Buy Order: During the trading hours of the current day, place a buy order for the chosen stock at the desired price.
- Monitor Trade: After the buy order is executed, monitor the trade for any significant price movements or developments that could impact the stock’s performance.
- Hold Overnight: Since BTST allows holding positions overnight, keep the position open until the next trading day.
- Short Position (BTST Sell):
- Identify Potential Stocks: Similarly, conduct research and analysis to identify stocks that are likely to decline in price in the short term.
- Place Short Sell Order: During the current trading day, place a short sell order for the chosen stock at the desired price. This involves borrowing shares from your broker to sell in the market with the intention of buying them back at a lower price in the future.
- Monitor Trade: After the short sell order is executed, monitor the trade for any significant price movements or developments.
- Buy to Cover: On the following trading day, buy back the shares in the market to cover your short position. Ideally, this should be done at a lower price than the price at which you initially sold the shares short.
It’s important to note some considerations when using the BTST strategy:
- Risk Management: Always prioritize risk management. Set stop-loss orders to limit potential losses and stick to your predefined risk tolerance levels.
- Leverage: Be cautious with leverage when short selling, as it amplifies both potential gains and losses.
- Market Conditions: Consider prevailing market conditions, news events, and overall market sentiment, as they can influence the success of your BTST trades.
- Broker Policies: Ensure that your broker allows BTST trading and understand any specific requirements or restrictions they may have regarding this strategy.
- Settlement Period: Be aware of the settlement period for trades in your market, as it can vary depending on the asset class and the exchange.
As with any trading strategy, it’s essential to thoroughly understand the risks involved and to practice proper risk management techniques to protect your capital. Additionally, gaining experience and continuously learning from your trades can help refine your BTST trading approach over time.
12.8 Open and High Strategy for taking long and short trades

The Open and High strategy is a simple yet effective trading strategy based on the premise that if the price of an asset opens higher than the previous day’s high, it indicates strong bullish momentum, potentially signaling a buying opportunity. Conversely, if the price opens lower than the previous day’s low, it suggests strong bearish momentum, potentially signaling a selling opportunity. Here’s how you can implement this strategy for taking long and short trades using live charts:
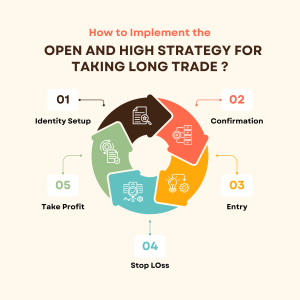
- Long Trade (Buy):
- Identify Setup: At the opening of the trading day, observe if the current day’s opening price is higher than the previous day’s high.
- Confirmation: Wait for confirmation of bullish momentum, such as an increase in trading volume or a bullish candlestick pattern forming after the opening.
- Entry: Once the bullish momentum is confirmed, consider entering a long position (buy) at the current market price or using a buy stop order above the opening price.
- Stop-Loss: Place a stop-loss order below the recent swing low or below the opening price to manage risk in case the trade goes against expectations.
- Take-Profit: Set a take-profit target based on your risk-reward ratio, technical analysis, or predefined profit objective.
- Short Trade (Sell):
- Identify Setup: Similarly, at the opening of the trading day, observe if the current day’s opening price is lower than the previous day’s low.
- Confirmation: Wait for confirmation of bearish momentum, such as an increase in trading volume or a bearish candlestick pattern forming after the opening.
- Entry: Once the bearish momentum is confirmed, consider entering a short position (sell) at the current market price or using a sell stop order below the opening price.
- Stop-Loss: Place a stop-loss order above the recent swing high or above the opening price to manage risk in case the trade moves against expectations.
- Take-Profit: Set a take-profit target based on your risk-reward ratio, technical analysis, or predefined profit objective.
- Monitoring and Adjustments:
- Continuously monitor the trade for any signs of reversal or unexpected price movements.
- Adjust stop-loss and take-profit levels if necessary based on evolving market conditions, but avoid moving them too close to the current price to prevent premature exits or losses.
- Consider trailing stop-loss orders to lock in profits as the trade moves in your favor.
- Review and Learning:
- After the trade is closed, review the outcome and analyze factors that contributed to its success or failure.
- Use this feedback to refine your entry and exit criteria, risk management approach, and overall trading strategy.
- Risk Management:
- Prioritize risk management by ensuring that your position size is appropriate relative to your account size and risk tolerance.
- Avoid overleveraging and risking more than a predetermined percentage of your trading capital on any single trade.
It’s important to remember that no trading strategy guarantees success, and losses are an inherent part of trading. Therefore, always trade with caution, conduct thorough analysis, and continuously improve your trading skills and discipline. Additionally, consider practicing the strategy in a simulated or demo trading environment before implementing it with real money.
Key Takeaways
- An opening trade strategy focuses on taking advantage of price movements that occur at the opening of a trading session, such as the stock market opening bell or the opening of a particular market segment.
- The BTST (Buy Today Sell Tomorrow) strategy is commonly used in stock trading, allowing traders to initiate positions today and sell them on the following trading day.
- The Open and High strategy is a simple yet effective trading strategy based on the premise that if the price of an asset opens higher than the previous day’s high, it indicates strong bullish momentum, potentially signaling a buying opportunity.