
Candlestick Chart Patterns are technical tools that are more useful than the traditional open, high, low and close (OHLC) bars or simple lines that connect the dots of closing prices. Candlestick Pattern build patterns that predicts price direction once completed. The candlestick patterns are used for predicting the future price movements. The candlestick patterns are formed by grouping two or more candlestick way. Candlestick chart patterns are best used on daily basis. The idea being that each candle captures a full days’ worth of news data and price action and that’s why candlestick patterns are more useful to long term or swing traders.
Here are 35 powerful candlestick patterns for Day Trading that can be divided as
1. Bullish Reversal Patterns
2. Bearish Reversal Patterns
3. Continuation Patterns
Bullish Reversal Pattern
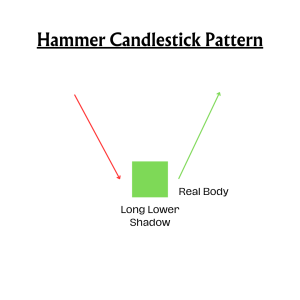
- Hammer
A Hammer candlestick Pattern is a price pattern in candlestick which occurs when the security trading happens significantly lower than its opening price, but rallies within the period close near to opening price. This pattern is called hammer shaped candlestick pattern. In this pattern we can observe a hammer shaped candlestick in which the lower shadow is at least twice the size of the real body. The body of the candlestick represents the difference between the opening and closing prices. The shadow shows the high and low period.
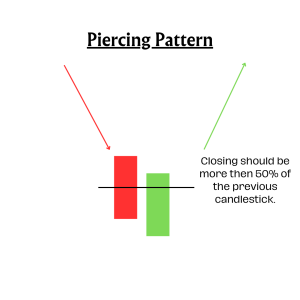
2. Piercing Pattern
Piercing Pattern is a multiple candlestick pattern formed after a downtrend indicating a bullish reversal.. Two candles form it, the first candle being a bearish candle indicates the continuation of the downtrend. and the second a bullish one. The second one opens the gap down but closes at more than 50% of the real body of the first one. This shows that the bulls are in the market, and a bullish reversal is taking place.
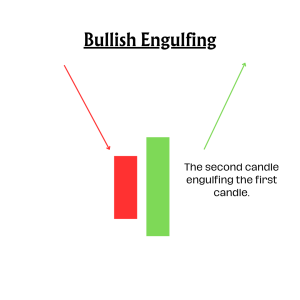
3. Bullish Engulfing
The bullish engulfing candle appears at the bottom of a downtrend and indicates a surge in buying pressure. The bullish engulfing pattern often triggers a reversal in trend as more buyers enter the market to drive prices up further. The pattern involves two candles with the second candle completely engulfing the body of the previous red candle.
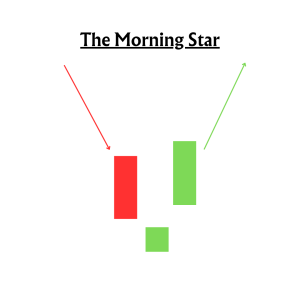
4. The Morning Star
The Morning Star pattern is another multiple candlestick chart that is formed post a downward trend, indicating a bullish reversal. Made of 3 candlesticks – the first one is bearish, the second one a Doji, and the third a bullish one. The first candle showcases the downward trend continuation, while the second one indicates indecision in the market. The third bullish candle shows that the bulls are back to reverse the market. In this case, the second candle must be completely out of the real body of the first and third ones.
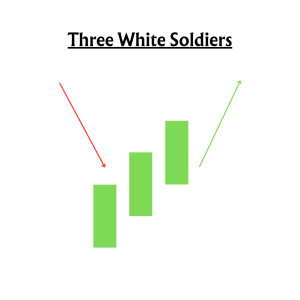
5. Three White Soldiers
The three white soldiers pattern is a bullish candlestick formation on a trading chart that occurs at the bottom of a downtrend. As the name suggests, the pattern consists of three candles, which are green in colour. Traders believe that this formation signals an upcoming price reversal because of the strong buying pressure. These candlestick patterns are made of three bullish bodies that do not have long shadows that are open within the real body of the previous candle in the pattern.
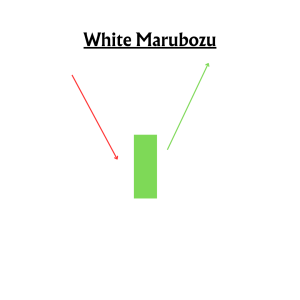
6. White Marubozu
The White Marubozu is a single candlestick pattern that is formed after a downtrend indicating a bullish reversal. This candlestick has a long bullish body with no upper or lower shadows, which shows that the bulls are exerting buying pressure, and the markets may turn bullish. This single stick pattern is formed post a downward trend that indicates a bullish reversal.
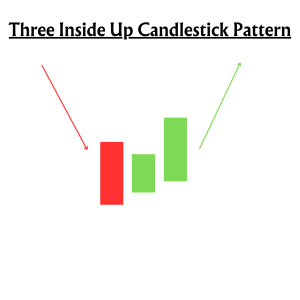
7. Three Inside Up
The three insides up is a multi-candlestick pattern that forms post a downward trend. It consists of three candlesticks – the first being a bearish candle, the second a small bullish candle in range of the first one, and the third a long bullish candle confirming the bullish reversal. The relationship of the first and second candlestick should be of the bullish Harami candlestick pattern. Traders can take a long position after the completion of this candlestick pattern.
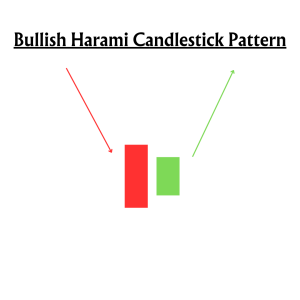
8. Bullish Harami
The Bullish Harami is multiple candlestick chart pattern which is formed after a downtrend indicating bullish reversal. It consists of two candlestick charts, the first candlestick being a tall bearish candle and second being a small bullish candle which should be in the range of the first candlestick. The first bearish candle shows the continuation of the bearish trend and the second candle shows that the bulls are back in the market. This multi-candle chart pattern consists of two candlesticks – the first one being a tall bearish one, the second being a small bullish one that is in range of the first one. The first candlestick shows a continuation of the bearish trend, while the second shows that the bulls are back in the market.
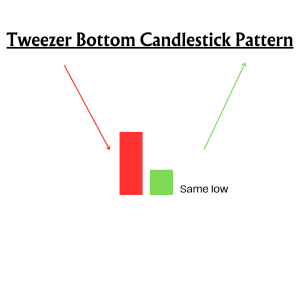
9. Tweezer Bottom
A tweezer bottom pattern consists of two candlesticks that form two valleys or support levels that are equal bottoms. Typically, when the second candle forms, the price cannot break below the first candle and causes a tweezer breakout. This pattern can be seen as a reversal in a downtrend. I may see the tweezer bottom at a turning point in the market or a reversal of a stock. This pattern formation can allow for precision trading by trend traders and good setups for dip buying. Tweezer bottom patterns usually occur while the stock is in a downtrend. Once a tweezer bottom is found, look for a reversal. The price should move up. Remember to confirm with more indicators. Have an entry, exit, and stop-loss plan before making the trade. Having a game plan helps traders stay in a trade, as well as helps with emotions.
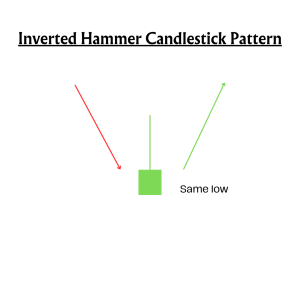
10 Inverted Hammer
The inverted hammer candlestick pattern (or inverse hammer) is a candlestick that appears on a chart when there is pressure from buyers to push an asset’s price up. It often appears at the bottom of a downtrend, signaling potential bullish reversal. The inverted hammer pattern gets its name from its shape – it looks like an upside-down hammer. To identify an inverted hammer candle, look out for a long upper wick, a short lower wick and a small body.
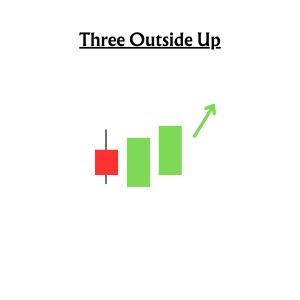
11. Three Outside Up
Three Outside Up is a three-candle bullish trend reversal pattern. A bearish candlestick pattern is followed by a bullish candlestick pattern that opens below the closing price and closes above the opening price of its previous candlestick pattern. In other words, the body of the second bullish candle stick pattern engulfs the body of its previous bearish candle stick pattern. Three Outside Up pattern is basically a Bullish Engulfing pattern breakout in the next candle itself. This pattern is stronger than the Bullish Engulfing pattern.
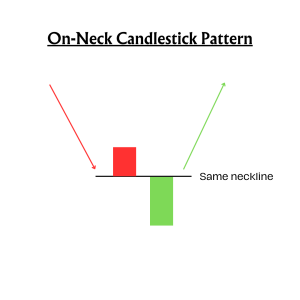
12. On Neck Pattern
An on-neck candlestick pattern occurs when a long bearish candlestick is followed by a small bullish candlestick following a downtrend, opening and closing near the close of the previous candlestick. The on neck pattern occurs after a downtrend when a long real bodied bearish candle is followed by a smaller real bodied bullish candle which gaps down on the open but then closes near the prior candle’s close. The pattern is called a neckline because the two closing prices are the same or almost the same across the two candles, forming a horizontal neckline.
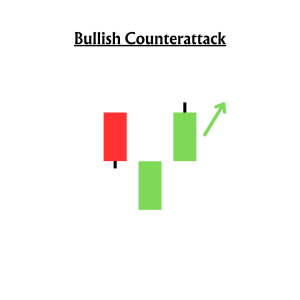
13 Bullish Counterattack
Bullish Counterattack is a reversal pattern that predicts that the current downtrend in the market will reverse in the future. This pattern is a two bar chart that appears during a market downturn. For it to be a bullish reversal pattern, the following conditions must be true:
- There must have been a strong downward trend.
- Then a strong positive candle develops.
- The following second candlestick must also be a long (ideally the same size as the first) green candlestick with a real body; close the second candle well above the close of the first candle.
Bearish Reversal Pattern
Bearish candlestick patterns suggest that the ongoing uptrend will turn into a downtrend. Therefore, traders should be cautious with their long positions when bearish reversal candlestick patterns form. The following are the different types of the main bearish candlestick patterns:
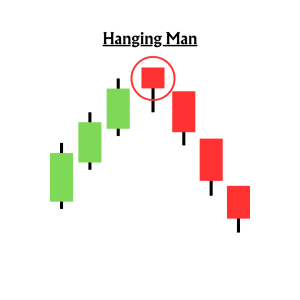
14. Hanging Man
The Hanging Man is a single candlestick pattern that forms at the end of an uptrend and signals a bearish reversal. The actual body of this candle is small and is at the top, with a lower shadow that should be larger than twice the actual body. This candlestick pattern has little or no upper shadow. Hanging Man is a single candlestick pattern that is formed at the end of an uptrend. This candlestick pattern has no or little upper shadow. The psychology behind this candle formation is that the prices opened, and the seller pushed down the prices. Suddenly the buyers came into the market and pushed the prices up but were unsuccessful in doing so, as the prices closed below the opening price.
15. Dark Cloud Cover
Dark Cloud Cover is a candlestick pattern that forms after an uptrend and indicates a bearish reversal. It is formed by two candles, where the first candle is a bullish candle that indicates the continuation of the uptrend. The second candle is a bearish candle that gaps to the upside but closes more than 50% of the previous candle’s real body, suggesting that the bears are back in the market and a bearish reversal will occur.
Dark Cloud Cover is a two-candlestick pattern that is created when a down (black or red) candle opens above the close of the prior up (white or green) candle, then closes below the midpoint of the up candle. When you spot the Dark Cloud Cover pattern on a Japanese candlestick chart, expect a potential bearish reversal. This candlestick pattern is easy to identify because its formation reflects its name.

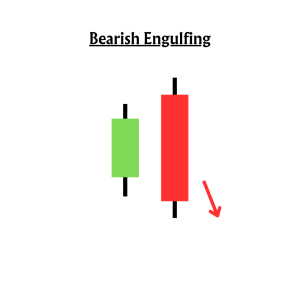
16. Bearish Engulfing
Bearish engulfing is a candlestick pattern that forms after an uptrend and indicates a bearish reversal. It is formed by two candlesticks, with the second candlestick engulfing the first candlestick. The first candle is a bullish candle and indicates the continuation of the uptrend. The second candle on the chart is a long bearish candle that completely engulfs the first candle and shows that the bears are back in the market.
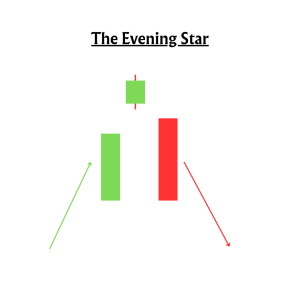
17. The Evening Star
The Evening Star is a candlestick pattern that forms after an uptrend that indicates a bearish reversal. It consists of 3 candles , where the first is a bullish candle, the second is a doji and the third is a bearish candle. The first candle indicates the continuation of the uptrend, the second candle, which is a doji, indicates market indecision, and the third candle, which indicates a bear market, indicates that the bears are back in the market and a reversal will be held.
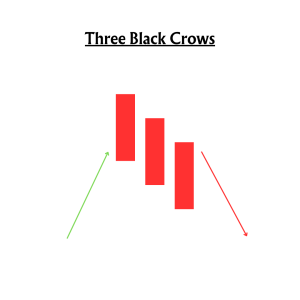
18. Three Black Crows
The Three Black Crows is a multiple candlestick pattern that is formed after an uptrend indicating a bearish reversal. These candlesticks are made of three long bearish bodies that do not have long shadows and open within the real body of the previous candle in the pattern.
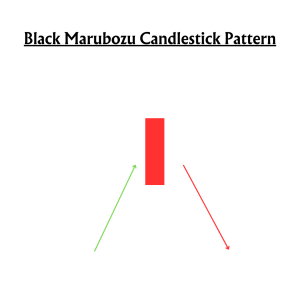
19. Black Marubozu
The Black Marubozu is a single candlestick pattern that forms after an uptrend and indicates a bearish reversal .This candlestick pattern features a long bearish body with no upper wick or lower shadow, suggesting that the bears could be selling and turning the markets lower. At the formation of this candle, the buyers should be caution and close their buying position.
20. Three Inside Down
Three Inside Down is a multiple candlestick pattern that forms after an uptrend and indicates a downside reversal. It consists of three candlesticks, the first being a long bullish candle, the second candlestick being a small bearish, which should be in the range of the first candlestick. The third candlestick chart should be a long bearish candlestick confirming the bearish reversal. The relationship of the first and second candlestick should be of the bearish Harami candlestick pattern.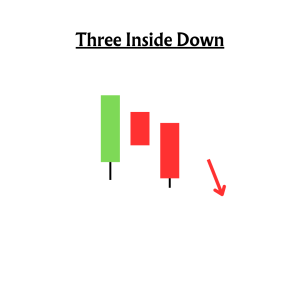
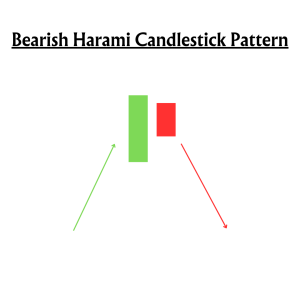
21. Bearish Harami
The Bearish Harami is a candlestick pattern that forms after an uptrend and indicates a bearish reversal. It consists of two candles, where the first candle is a high bullish candle and the second is a small bearish candle, which should be in the area of the first candlestick chart. The first bullish candle shows the continuation of the bullish trend and the second candle shows that the bears are back in the market.
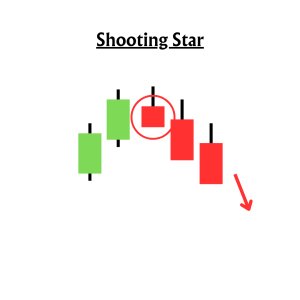
22. Shooting Star
The Shooting Star forms at the end of an uptrend and gives a bearish reversal signal. In this candlestick chart, the actual body is at the end and there is a long upper wick. It is the reversal of the Hanging Man candlestick pattern.
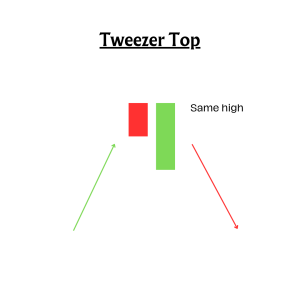
23. Tweezer Top
The tweezer top candlestick pattern is a bearish candlestick formation that forms at the end of an uptrend. It consists of two candles , the first being a bullish candle and the second being a bearish candle. Both tweezer candles are making almost the same high. When the tweezer top candlestick pattern forms, the previous trend is an uptrend. A bullish candle is a forming that looks like the continuation of the ongoing uptrend. The Tweezer Top pattern is a bearish reversal candlestick pattern that is formed at the end of an uptrend.
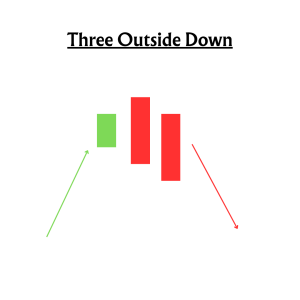
24. Three Outside Down
The Three outside Down is a candlestick formation that forms after an uptrend and indicates a bearish reversal. It consists of three candles, with the first being a short bullish candle and the second being a large bearish candle that should cover the first candle. The third candle should be a long bearish candle confirming the bearish reversal.
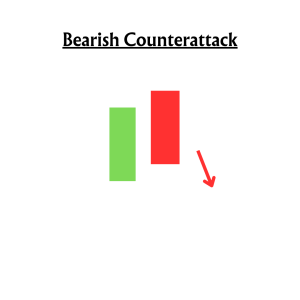
25. Bearish Counterattack
The Bearish Counterattack Candlestick Pattern is a bearish reversal pattern that occurs during an uptrend in the market. It predicts that the current uptrend in the market is coming to an end and a new downtrend is taking over the market.
Continuation Pattern
26. Doji
The doji pattern is an indecisiveness candlestick pattern that forms when the opening and closing prices are almost equal. It is formed when both the bulls and bears are fighting to control prices but nobody succeeds in gaining full control of the prices.

27. Spinning Top
The spinning top candlestick pattern is the same as the doji pattern that indicates indecisiveness in the market..The only difference between the spinning top and the doji is in their formation, the real body of the spinning is larger as compared to the Doji.
28. Falling Three Methods
The falling three methods is a bearish five candlestick continuation pattern that indicates a break but no reversal in the ongoing downtrend. The candlestick pattern consists of two long candlestick charts in the direction of the trend, ie a downtrend at the beginning and end, and three shorter candlesticks in the middle, counteracting the downtrend. The “falling three methods” is a bearish, five-candle continuation pattern that signals an interruption, but not a reversal, of the ongoing downtrend. The candlestick pattern is made of two long candlestick charts in the direction of the trend i.e. downtrend at the beginning and end, with three shorter counter-trend candlesticks in the middle.

29. Rising Three Methods
The “ rising three methods ” is a bullish five-bar continuation pattern that signals a break, but not a reversal, in the ongoing uptrend. This candlestick pattern consists of two long candlesticks in the direction of the trend, ie uptrend in this case, at the beginning and the end, and three shorter candlesticks in the middle, counter to the trend.

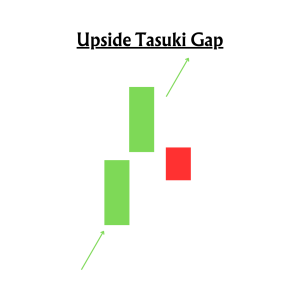
30. Upside Tasuki Gap
It is Upside Tasuki , a bullish continuation candlestick pattern formed in an ongoing uptrend. This candlestick formation consists of three candlesticks. The first candle is an elongated bullish candle and the second candle is also a bullish candle that forms after a gap to the upside. It is a bullish continuation candlestick pattern which is formed in an ongoing uptrend.
31. Downside Tasuki Gap
It is a bearish continuation candlestick pattern which is formed in an ongoing downtrend. This candlestick pattern consists of three candles, the first candlestick is a long-bodied bearish candlestick, and the second candlestick is also a bearish candlestick formed after a gap down.The third candlestick is a bullish candle that closes in the gap formed between these first two bearish candles.

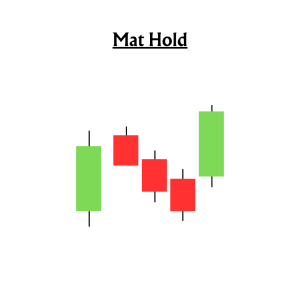
32. Mat Hold
A mat-hold pattern is a candlestick formation that indicates the continuation of a previous trend. There are both bearish and bullish mat hold patterns. A bullish pattern starts with a large bullish candle, followed by a gap to the upside and three smaller candles moving down.. These candles must stay above the bottom of the first candle. The fifth candle is a large candle moving back up. The pattern occurs within a general uptrend.
33. Rising Window
The Rising Window is a candlestick pattern consisting of two bullish candlesticks with a gap between them. The gap is a gap between the high and low of two candlesticks created due to high trading volatility. It is a trend continuation candlestick pattern that indicates strong buyers in the market.

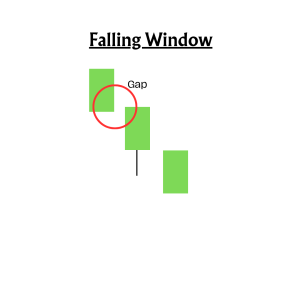
34. Falling Window
The falling window is a candlestick pattern consisting of two bearish candlesticks with a gap between them. The gap is a space between the high and the low of two candlesticks. This is a trend continuation candlestick pattern that indicates the strength of the sellers in the market.
35. High Wave
The high wave candlestick pattern is an indecision pattern that shows that the market is neither bullish nor bearish. It mostly occurs at support and resistance levels. The high wave candlestick pattern is an indecision pattern that shows the market is neither bullish nor bearish. It mostly occurs at support and resistance levels. This is where bears and bulls battle each other in an effort of trying to push the price in a given direction. Candlesticks depict the pattern with long lower shadows and long upper wicks. Likewise, they have small bodies. The long wicks signal there was a large amount of price movement during the given period. However, the price ultimately ended up closing near the opening price.

Conclusion
The candlesticks’ wide or rectangle part is known as the ‘real body’ that shows the link between the opening and closing prices. This shows the price ranges between the opening and closing that day’s trading. A trader must always check the candlestick patterns before investing in stock markets. Because these charts are technical indicators that shows how the market is performing. Financial Literacy and expert advice can help and give the trader better understanding about the market performance.


