
8.1 What is Margin Calculator?
We have already discussed margins in the previous chapter let us now continue this discussion and see how a trader can find out the exact margin requirement before entering into a futures trade. In the next two chapters, we will explore how margin calculators work and introduce a few related concepts to help traders manage their positions more effectively.
As we saw earlier, each futures contract has an Initial Margin (IM) which comprises:
SPAN Margin: The minimum margin the exchange requires to cover potential losses.
Exposure Margin: Additional margin to cover short term volatility So the formula goes: Initial Margin = Exposure Margin + SPAN Margin
The point is that margin requirements are not set in stone. These will vary from contract to contract and will be dependent on the volatility of the underlying asset. For example, a futures contract on a stable stock such as a utility company may have a lower margin than a futures contract on a volatile tech stock We will talk about volatility in more detail in the next module, but just remember for now, higher volatility = higher margin requirement.
How to Check Margin Requirements?
For example if you want to trade Tata Motors Futures that expires on 30 Nov 2025 . You want to know how much margin capital you need to set aside before placing your order. You can find out using any of the standard margin calculators provided by your trading platform:
A Step by Step Tutorial
Step 1: Open the Margin Calculator Go to the technology or tools section of your broker and look for the Margin Calculator. On most platforms, it is listed under the menu for derivatives or trading tools.
Step 2: Once you are in the calculator you will see a number of options to choose from:
- Exchange – NSE for equity futures, MCX for commodities and CDS for currency derivatives.
- Product Type: Select “Futures” if you are trading futures contracts.
- Symbol: Select the stock you want from the drop down list. In this case go for Tata Motors.
Step 3: The system will auto fill the lot size after contract is selected. Assuming the lot size is 1,500 shares for Tata Motors. If you wish to trade several lots just multiply by the relevant figure. e.g. 3 lots = 4,500 shares.
Step 4: Select long (buy) or short (sell) and click “Add” or “Calculate.” Calculator will give a real-time margin break down.
Sample Output 1
Let’s say the calculator reads as so:
SPAN Margin = Rs. 52,500
- Exposure Margin = Rs.35000
Total Initial Margin = Rs. 87500
To trade in 1 lot of Tata Motors Futures you need ₹87,500 in your trading account. If you want to trade 3 lots you will need a margin of ₹ 2,62,500.
What to Expect?
Before we dive into the calculator’s “Equity Futures” section, there are three related concepts you need to understand:
1.Expiration – The last day the futures contract is valid.
2.Spreads-Simultaneous buying and selling of related contracts to reduce margin and risk.
3.Intraday Orders – Such trades are squared off on the same day and generally have lower margins as there is less risk of overnight movement.
Once you understand these concepts you will be better equipped to use the margin calculator not only for futures but also for more complex strategies such as spreads and options.
Volatility: The hidden driver of options and the edge. Volatility is one of the most important and most misunderstood concepts in the trading of derivatives. In simple words, volatility is a way to measure the uncertainty or the amount of change in a trading price series over time. A stock or index is highly volatile when it moves sharply up and down over short periods of time. When prices are relatively stable, however, volatility is low. And it’s important because volatility is really a measure of risk and in the futures and options market, risk directly impacts margin requirements and the price of contracts.
There are a couple main ways that traders and exchanges measure volatility. The first is historical volatility, which looks backwards at prices that have already occurred. It is statistically determined, generally by using the standard deviation of returns over a period of time such as the last 30 days. If Reliance Industries has been bouncing up and down wildly on a day to day basis for the last month, its historical volatility will be higher than a stable utility stock. The second is implied volatility looking forward. Implied volatility is calculated from the market price of options and represents the consensus view of traders as to the possible future movement in the underlying. For instance, when Infosys options are trading at an abnormal premium, it indicates that the market expects major price movements in the future. Simply put: historical volatility is what has happened, implied volatility is what the traders think will happen.
Volatility is an important input in establishing the margin requirements in exchanges. For example, the SPAN margin system uses volatility models to determine the amount of money a trader has to deposit to open a position. Higher the volatility of an asset, greater the risk of sudden adverse move in the price of an asset, higher the margin requirement. This allows traders to absorb potential losses and the exchange to guarantee continuous settlement. So a stable FMCG stock may require a relatively low margin while a volatile technology stock may require a much higher margin for the same value of the contract.
Volatility is also important in the valuation of options. The price of the option is not just the difference between the strike price and the current market price , but also has a component that reflects the expected volatility of the underlying asset . But with more volatility also comes higher option premiums because the chance of large price swings higher or lower increases. This makes calls and puts more costly. Conversely, as volatility declines, option premiums also decline and the market expects less turbulence. For instance, if Nifty is at 20,000 and the implied volatility rises from 12 to 20 percent, the premium of a 20,000 call option can shoot up considerably even if the index does not move.
For traders, understanding volatility is key. It bridges two worlds: risk management and opportunity. In futures, margin to hold a position is based on volatility. It is the volatility you pay or receive . In options you trade contracts . “When you understand volatility, you can figure out margin requirements, option premiums and create strategies, such as spreads or hedges, that capitalise on changes in volatility, not just direction.”
8.2 Expiry in Futures Contracts
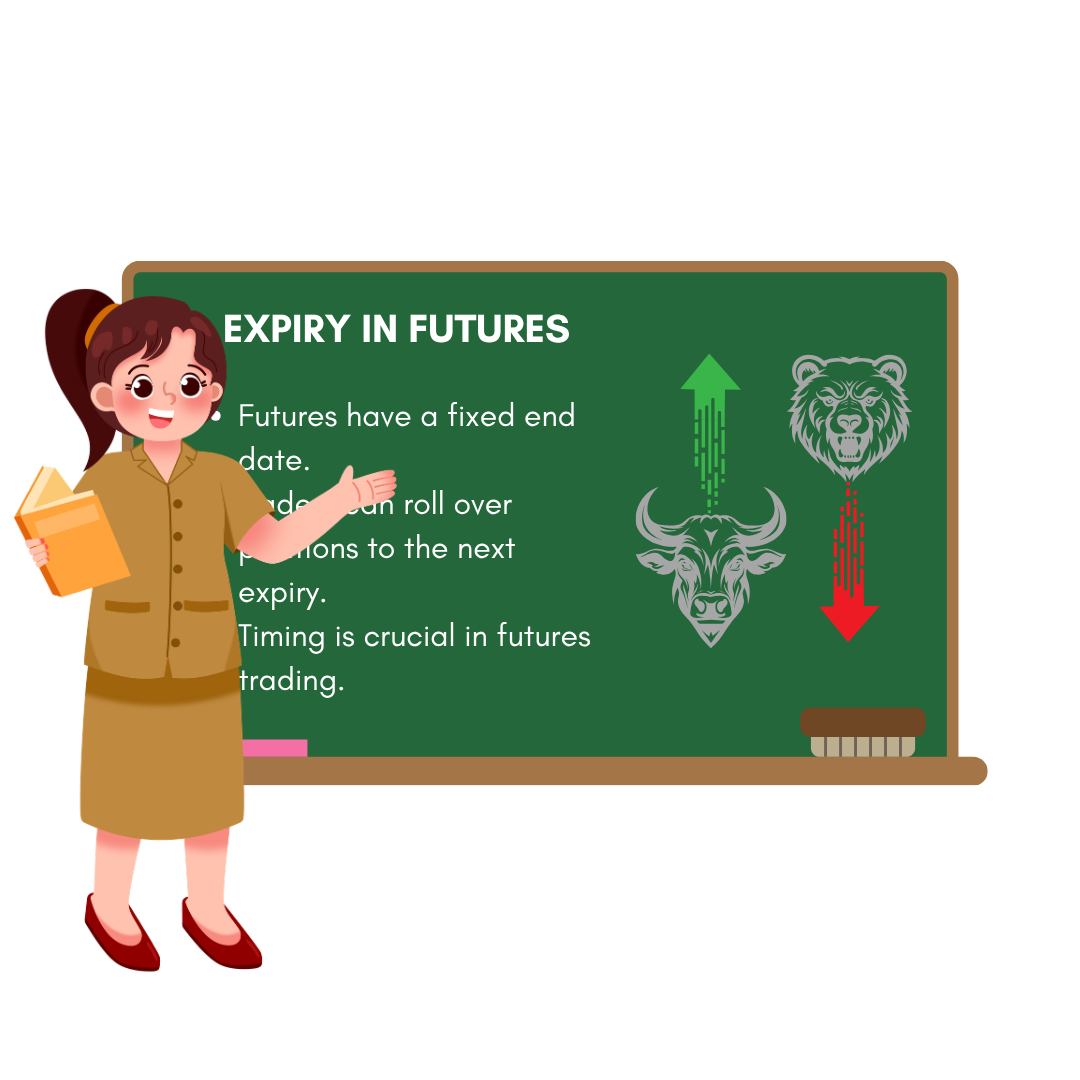
One of the most important things to learn about in the futures trading business is expiry. Expiry is the last day of validity of a futures contract. After this date the contract is no longer in existence and all positions must be closed. This is why expiry is a key feature of futures trading because these contracts are time bound unlike shares in the spot market which you can hold on to indefinitely. If you’re wrong on a stock or index before expiry, the opportunity will be gone regardless of what happens after the contract expires.
For example, let’s say you buy Tata Steel Futures at ₹122.30 in November 2025, expecting the price to move up to ₹130 after the company’s quarterly results. But the November contract expires on Nov. 28, 2025. So, if Tata Steel moves to ₹130 in early December, you cannot profit from that move with the November contract since it would have expired by then. This is the nature of rigid expiry, your view has to be right within the life of the contract.
Flexibility Through Multiple Expiry Choices
Fortunately, contracts on exchanges come with flexibility in terms of expiration dates. Traders can choose any of the three contracts that are available at any given time, which are the current month, the next month (mid-month) and the far month. For example in November 2025 you can trade: · November contract expiry 28 November 2025 ·December contract Expiry date 26 December 2025
– January contract expiring on 30th Jan 2026
This gives traders the chance to take a position based on their view of the market. If you are short term you may want to look at the current month contract. If your view is beyond the current expiry you have a choice of the mid-month or far-month contract. In case of our Tata Steel example, the December contract would be a better bet as the rally is expected to be post Nov expiry.
Why Longer Term Contracts Are More Expensive
You may observe that longer dated contracts are priced a little higher than the near term contracts. For example Tata Steel November futures could be at Rs 122.30, December at Rs 123.10 and January at Rs 124.00. The difference is the cost of carry, a pricing principle that takes into account interest rates, dividends and the time value of money. The longer the time to expiry the higher the chance is that the futures price will be higher. We will discuss the math behind this in the futures pricing module, but for now just remember the general rule of current month < mid-month < far month.
The Rollover Concept
Another important futures trading practice is the rollover. For example, you are long the Nov contract, but you want to continue to be long after expiration. Instead of closing your trade, you can close the November contract and then open a new position for December. This is called a roll-over. It allows traders to roll their exposure forward.
The market is watching the rollover activity very closely. Analysts often talk about “rollover percentages”, which is the percentage of positions that are rolled from one expiry to the next. A heavy rollover of long positions is considered bullish sentiment whereas a rollover of short positions is considered bearish. Rollover data is not perfect but it gives an insight into trader expectations.
Liquidity Considerations – You may wonder why they don’t just buy the far month contracts if they expect a long-term move? The answer is liquidy. The current month contracts have the greatest open interest, tightest bid-ask spreads, fastest execution and best price discovery. Mid-month and far-month contracts tend to have less participation and hence are harder to trade efficiently. This is why many traders like to trade current month contracts and rollover their positions if needed rather than commit to longer dated contracts up-front.
Rollover logic ready to go
Each contract in the futures market has a certain expiration date. You need to do a rollover if you want to keep your position after this expiry. It is not automatic. There are two very intentional steps. First the trader has to liquidate the existing position in the near month contract. This means closing the position and doing the exact opposite trade (buy if they were short, sell if they were long). Second, the trader must also establish a new position on the next month’s contract at the same time. This makes for a continuous exposure and no interruption in market participation.
A rollover is a strategic reset, not a mechanical extension. This allows traders to reassess their view of the market, adjust their risk appetite and re-enter with new margin and expiry terms. That’s where the margin calculator helps. When rolling over traders should compare the margin requirements across expiries. The next-month contract may have a different margin requirement (due to a change in volatility or contract specifications) and this has to be taken into account when deciding on a rollover.
Timing rollovers are a big part of liquidity. Near-month contracts typically have the highest volume and the narrowest bid-ask spreads. But usually, as expiry approaches, liquidity migrates to the next-month contract. Traders keep a close eye on this change. A rollover when the next-month contract is liquid enough yields better price discovery, faster execution and lower slippage.
Rollover is a controlled event in practice. Traders close out the expiring contract and put on the new one in a single session, sometimes in minutes. This dual action is required to avoid any gaps in exposure and to maintain a consistent trading strategy. This is often provided by brokers and platforms but the trader has to check the margin availability and monitor the liquidity conditions.
Rollover is not seen as an end-of-day adjustment but rather a scheduled transition, enabling traders to maintain control over their positions and leverage their capital. The margin calculator is a handy pre-rollover checklist to check affordability, assess leverage and align expiry dates to your strategy. This suggests that rollover is not simply a technical necessity but a tactical opportunity to reposition oneself in the market.
Putting it all together
The expiry date is not a technicality, it is what makes futures trading work. It forces traders to think about time horizons, to match their positions to what they expect to happen and manage their exposures carefully. Your choice of a current, mid or far month contract will depend on your market view, risk appetite and need for liquidity. And if you’re looking beyond the current expiry, rollover allows you to stay invested without any loss of continuity.
8.3 Sneak Peek into Spreads

- What is a future spread?
Spread Trading A spread is a trading strategy that involves taking two related futures positions at the same time. A calendar spread is the purchase of one contract and the sale of another contract on the same underlying stock but with different expiration dates. Both contracts are on the same company so they tend to move together with the stock price movement. The only difference is expiration date and price. You can protect yourself from significant directional shifts by using this dual positioning strategy. This is because the gains on one leg tend to compensate for the losses on the other leg. It is common practice for professional traders to make use of spreads in order to mitigate risk, lessen the amount of margin that is required, and make a profit from incremental price differences between contracts. Spreads are widely used by professional traders to manage risk, reduce margin requirements and exploit small pricing differences between contracts.
- Why Calendar Spreads Are Needed
You have calendar spreads because different futures contracts with different expiries are priced differently . The greater the time to expiration, the higher the futures price will tend to be . This is due to the cost of carry (interest rates, dividends and time value). For example, the November futures of Infosys may be trading at Rs 1,502 while the December futures may be available at Rs 1,510. Both are linked to the Infosys stock, but the December contract is a little costlier as it has a longer tenure. Traders can exploit this difference by buying one and selling the other at the same time (a spread position). This structure allows traders to align their position with their view of the market. If you are short-term oriented, then you might want to go for the near-month contract. If you are looking beyond the current expiry then you can use mid month or far month contracts.
- Extended Infosys Futures Scenarios with Let us see how spreads work in practice.
Case 1 – Buying only November Futures And if Infosys comes down by ₹10, the November contract also falls and you have a direct loss. This is one leg position, a full directional risk.
Scenario 2 – Buying November and Selling December Futures If Infosys drops by Rs. 10. The November contract is going to lose value, but so is the December contract. You’ll make a profit. You win some, you lose some and in the end it all balances out to zero loss. Here’s an example of the risk removing properties of spreads.
Scenario 3 – Sell November Futures, Buy December Futures November contract gets a loss if Infosys goes up by ₹10 and December contract makes a profit. And again the net result is zero.
These examples illustrate how the spreads hedge the directional risk by netting the gains and losses between the contracts.
- WHY SPREADS NARROW MARGINS
Margins are charged against which protects the exchange and the brokers from the risk of default. When you are in one futures position, you are fully exposed and the margin requirement is high. But if you have a spread, one long contract short another, the risk is drastically reduced. The contracts offset each other . The margin is reduced and the exchange views this as less risk. For example: * Margin for November contract only: ~ Rs. 40,000
Margin for December contract: ~ ₹ 41,000 (by itself)
Margin combined in case of separate trading : ~ ₹ 81,000
Spread position margin: ~₹8,000
This is no small reduction. This releases capital which means traders can deploy funds in other opportunities whilst maintaining exposure.
- Expanded Pointers Key Points
- Description Calendar spread is a simultaneous long and short position in the same stock’s futures with different expiration.
- Risk Reduction: Losses on one leg are offset by profits on the other leg and thus reduce directional risk.
- Margin Benefit: Reduce net risk so exchanges lower margin requirement on spreads.
- The liquidity factor: Typically, current month contracts are more liquid than middle or far month contracts. Consequently, the spreads are often executed by rolling between the two types of contracts.
- Risk of performance. Spreads can reduce direction risk, but traders still have to deal with liquidity, volatility and timing issues.
- Sentiment regarding the market: Rollover data is often looked at as a sentiment indicator. If the rollover is long it is bullish and if it is short it is bearish.
- Spreads are used to hedge, lower margin requirements or capitalize on small price differences between contracts.
- Not Risk Free While directional risk is lower, spreads may still be affected by sudden volatility, low liquidity or mispricing.
A calendar spread is really just a way to hedge out the exposure and still be in the futures market.” This is especially attractive to professional traders and institutions that can hold large positions with relatively low margin requirements. Spreads allow retail traders to trade futures with less risk and with capital efficiency. It’s like two weights on a scale, when one side goes down the other side goes up, keeping it balanced.
8.4 The Trade Information
Let us go back to the basic question. Why do futures trades have margins?
Margins are used only for risk management purposes. They serve as a protection against the counterparty defaulting, so that all trades are honoured even if the market moves dramatically against one of them.
Each broker has a Risk Management System (RMS) behind the scenes. That’s a combination of software and human oversight that looks at every order before it goes to the exchange. The RMS checks whether the trader has sufficient margin, whether the size of the order is reasonable and whether the trade complies with risk limits. This approval takes fractions of a second and only after this is the order sent to the exchange.
What Data Does RMS Look At?
When you place a futures order like buy Infosys Futures, the RMS gets the information like:
- The contract you want to trade.
- The number.
- The kind of price.
Based on this RMS calculates the margin requirement and decides to allow or not the trade.
What type of information is missing usually?
Traders seldom give the RMS two pieces of information that are important:
- What’s the duration of the trade – Are you going to be closing it the same day or will you be holding it for a couple of days?
- Stoploss level: The price you would be out if the trade went against you.
Without these, the RMS only sees the basic order, but does not have clarity on your risk appetite.
The Importance of Duration
If you tell the RMS that your trade is intra-day it knows that you are only exposed to one day’s volatility. This is a relatively lower risk.
But if you plan to hold the position overnight, you have overnight risk. Overnight risk is the risk that something will happen after the market closes.
For instance: Imagine you are long of Indian Oil Corporation (IOC) Futures. Crude oil prices globally are very volatile. If crude jumps 6% overnight due to geopolitical tensions, IOC’s costs go up. And IOC’s stock may have gapped down the next day and you lose on your futures position. This overnight risk is more than intraday risk and needs to be factored by the RMS.
The longer you hold a position, the more risk you are exposed to and the greater the margin requirement.
Why Stoploss is Important
A stoploss is the maximum loss you are willing to take. Without a stoploss your risk is theoretically unlimited
Example: Suppose, you purchase Reliance Futures at Rs. 2,400. If you do not define a stoploss then the RMS assumes that you can hold the position even if Reliance falls to ₹2,000 or less. That’s a big risk.
However, if you put a stop loss at ₹2,370 (₹30 below your entry), the RMS knows that you will exit if the price falls that much. Maximum risk per lot is capped at ₹30 x lot size. Because the exposure is quantified , the RMS is able to cut the margin requirement . This clarity .
What Does This Mean for Traders?
The more information you provide about your trade, duration and stoploss, the clearer will be your risk profile. Better clarity for RMS is possible with lower margins as the risk is contained.
Daily Comparison
Imagine this as bargaining at a wholesale market.
- If you go to a store and ask how much they charge for a refrigerator, they will tell you the regular retail price.
- When you say you want to buy 20 refrigerators, the seller immediately gives you a discount because your intention is clearer.
If you tell the seller you’re paying cash and taking delivery today, the seller will reduce the price even more, since there is little risk in the transaction.
The more clarity the seller has, the better deal you’ll get. Similarly, the more clear the RMS is about your trade, the lesser the margin requirement.
8.5 The Product Types
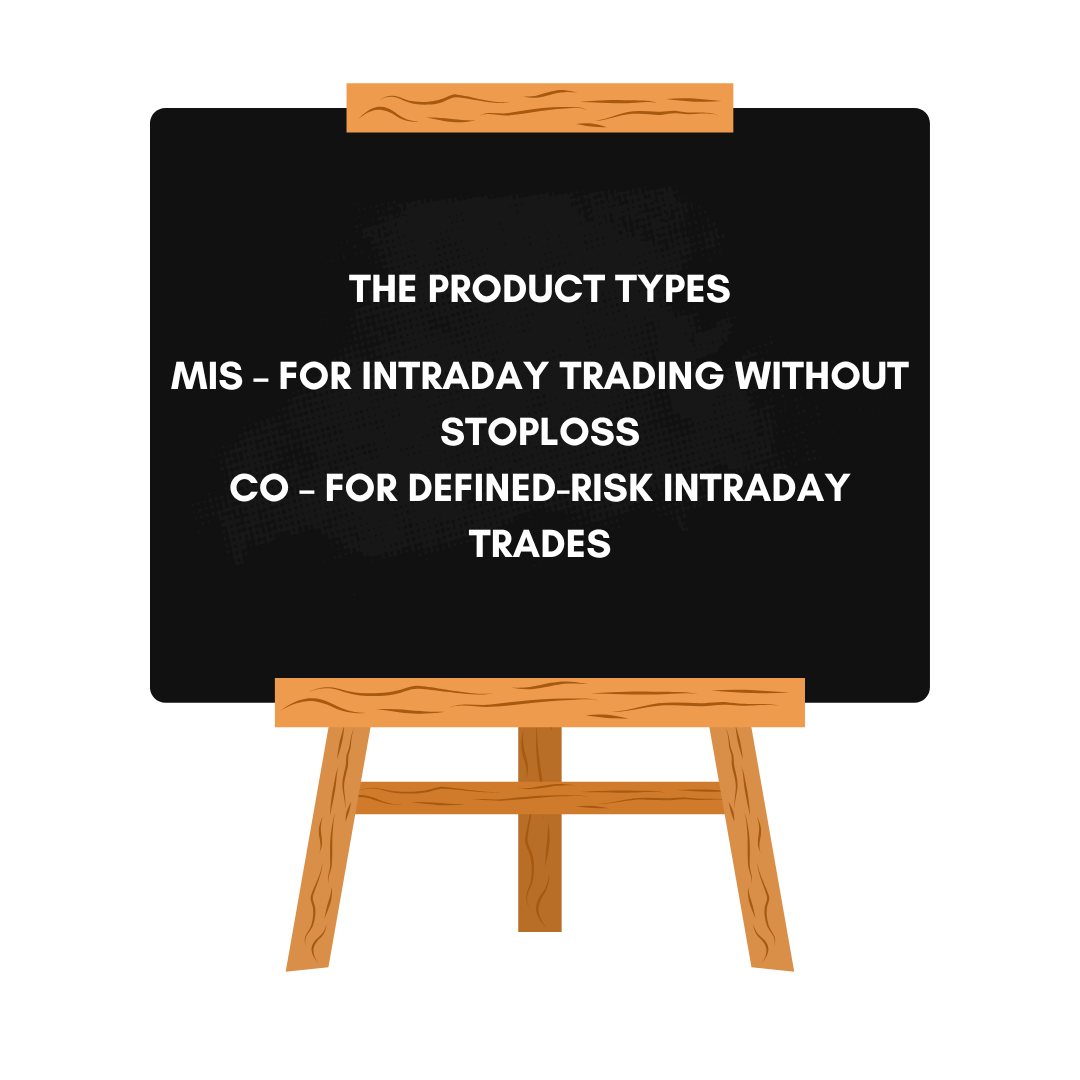
When you place a trade in derivatives segment, the product type you choose, NRML or MIS or CO or BO is not just a technical setting. It’s how you will communicate risk and intent to the broker’s Risk Management System (RMS) . The clearer you are on how long you plan to hold the position and how much downside protection you have built in, the more margin efficiency you can unlock.
NRML – For Multi Day Holding And Positional Trading
The default product type for positions carried forward is NRML (Normal). It allows you to hold futures or options overnight and through multiple trading sessions, until expiry. But this flexibility comes at a cost – you need to post the full margin including the SPAN and exposure components and take on overnight risk.
A trader buys HDFC Bank Futures prior to an upcoming RBI policy announcement and expects the stock to react over a period of several days. The view is best suited to NRML which spans multiple sessions and allows the position to stay open past market hours, albeit at a higher margin.
MIS – Intraday trading without stoploss
MIS (Margin Intraday Square-off) is for intra day trades. You buy and sell in the same trading session and if you do not square-off manually, the broker will automatically square-off before the market closes. There is no overnight exposure, hence the margins are lower than NRML.
For example, a trader buys Infosys Futures in the morning expecting a quick bounce back after the earnings. They fill the position by the afternoon. MIS helps in saving of capital while executing the view as the trade is short term and no overnight holding is involved.
CO – For Intraday Trading with Defined Risk
Cover Orders (CO) introduce a discipline as they require a stoploss at the time of entry. This is the maximum loss per lot and this enables brokers to confidently offer even lesser margins than MIS. CO is still intraday but safer as risk is quantified up front.
Example – A trader buys HDFC Bank Futures with CO with a stoploss of ₹ 10 below the entry price. This means if the trade goes wrong the loss is capped. This allows the trader to post a smaller margin because the broker knows the worst case scenario.
BO – Automatic Intraday Trend Trades
Bracket Orders (BO) go one step further. You can set up a profit target, and a stoploss, as well as a trailing stoploss that will move as the price moves in your favour. This automation helps lock in gains and takes the emotion out of decision making during volatile moves.
A trader takes a Tata Motors Futures trade with a ₹10 stoploss, ₹20 target and trailing stoploss on. As the price rises the stoploss rises with it locking in profits. For traders wanting to automate their management of risk and reward, BO is perfect.
Strategic Application of Product Types
The right product for you depends on your time horizon, risk appetite and trading style:
- If your thesis is a multi-day or multi-week one, you will not escape NRML at higher margin.
- If you are chasing intra-day moves, MIS is easy but prone to risk.
- If you want defined downside, CO is the better.
If you like automation and profit protection, BO is perfect.
Practical Flow: A trader begins with Infosys Futures using CO to stop risk at the start of the morning, switches to BO as the trend solidifies to secure profits, and employs NRML for a positional wager on HDFC Bank before policy. Each product type has its place—finding the right match for your strategy is the art.
Comparison Chart of Product Types
|
Product Type |
Duration |
Stoploss Requirement |
Margin Level |
Best Use Case |
|
NRML |
Multi-day / carry-forward |
No |
Highest (SPAN + Exposure) |
Positional or swing trades, hedging |
|
MIS |
Intraday only |
No |
Lower than NRML |
Day trading, scalping |
|
CO |
Intraday only |
Yes (mandatory stoploss) |
Lower than MIS |
Defined-risk intraday trades |
|
BO |
Intraday only |
Yes (mandatory stoploss + target + trailing) |
Similar to CO |
Automated intraday trend trades |
8.6 Revisiting the Margin Calculator
Let’s go back to the margin calculator now with a better understanding of its role in a trader’s decision-making process. We have already mentioned in earlier chapters the influence of expiry dates, rollovers and the benefit of spreads on margin requirements. We also saw how the broker’s risk management system (RMS) interprets the nature of each trade, whether it’s intraday, multi-day or hedged, and alters margin demands accordingly. Having established this background, we now move on to two specific sections of the margin calculator interface, one related to equity futures and the other to stoploss-based orders such as BO (Bracket Orders) and CO (Cover Orders).
The equity futures portion is especially useful for traders looking to get a quick look at margin requirements on a wide variety of contracts. It normally displays important information like expiry date, lot size, current price and the margin required under various product types namely NRML for carry forward trades and MIS for intraday positions. It also often includes a calculator to help traders figure out how many lots they can buy with the funds in their account.
Let us take a practical example to better understand this. Let us assume that a trader has ₹80,000 in his account and he wants to place two trades. The first is a position in ACC Cements futures expiring in late February, which they expect to hold for three trading sessions. Since this is not an intraday trade, the trader needs to use the NRML product type which allows carry forward of positions. They check the margin calculator and find that for one lot of ACC futures, the NRML margin required is ₹48,686. This amount will be blocked on their account for the duration of the position.
The second trade is an intraday setup in Infosys futures expiring in Jan. As the trader intends to close this position in the same session, he can opt for the MIS product type which has lower margin requirements as there is no overnight risk. The calculator shows that the MIS margin for Infosys is ₹27,079 as compared to the NRML margin of ₹67,698 for the same contract. NRML can be used for intraday trades technically, but it would unnecessarily tie up capital. If the trader is confident that the position will get squared off before the market closes then MIS is the more efficient option.
The trader would need to add the margin requirement for both to arrive at ₹75,765, ₹48,686 for the ACC trade and ₹27,079 for Infosys. They have ₹80,000 to play with so they can easily do both trades and stay within their margin limits.
Let us take another scenario. Suppose a trader has ₹1,20,000 in his trading account and he wants to know that how many lots of Wipro Jan futures he can buy in intraday and multi day basis. They work out the NRML margin per lot to be ₹36,806 using the calculator. If they want to hold the position overnight, they can buy up to 3 lots. This amount divided by their capital. But if they want an intraday trade via MIS, the margin per lot is ₹14,722. This means they can purchase up to eight lots in a single session.
That’s a good comparison to emphasise the importance of choosing the right product type for your strategy. Intraday trades have higher leverage, require lower capital but have to be squared off before the market closes. Carry-forward trades are flexible and allow you to stay in a trade through an event or trend, but they require higher margins and expose you to overnight risk.
In summary, the equity futures tab on the margin calculator is a very useful tool for planning trades. It enables traders to compare margin requirements, calculate position sizing and make informed decisions whether to trade intraday or hold positions across sessions. With this clarity we can now move on to the BO & CO section, where the automated risk management comes in to play, through stoploss and target orders.
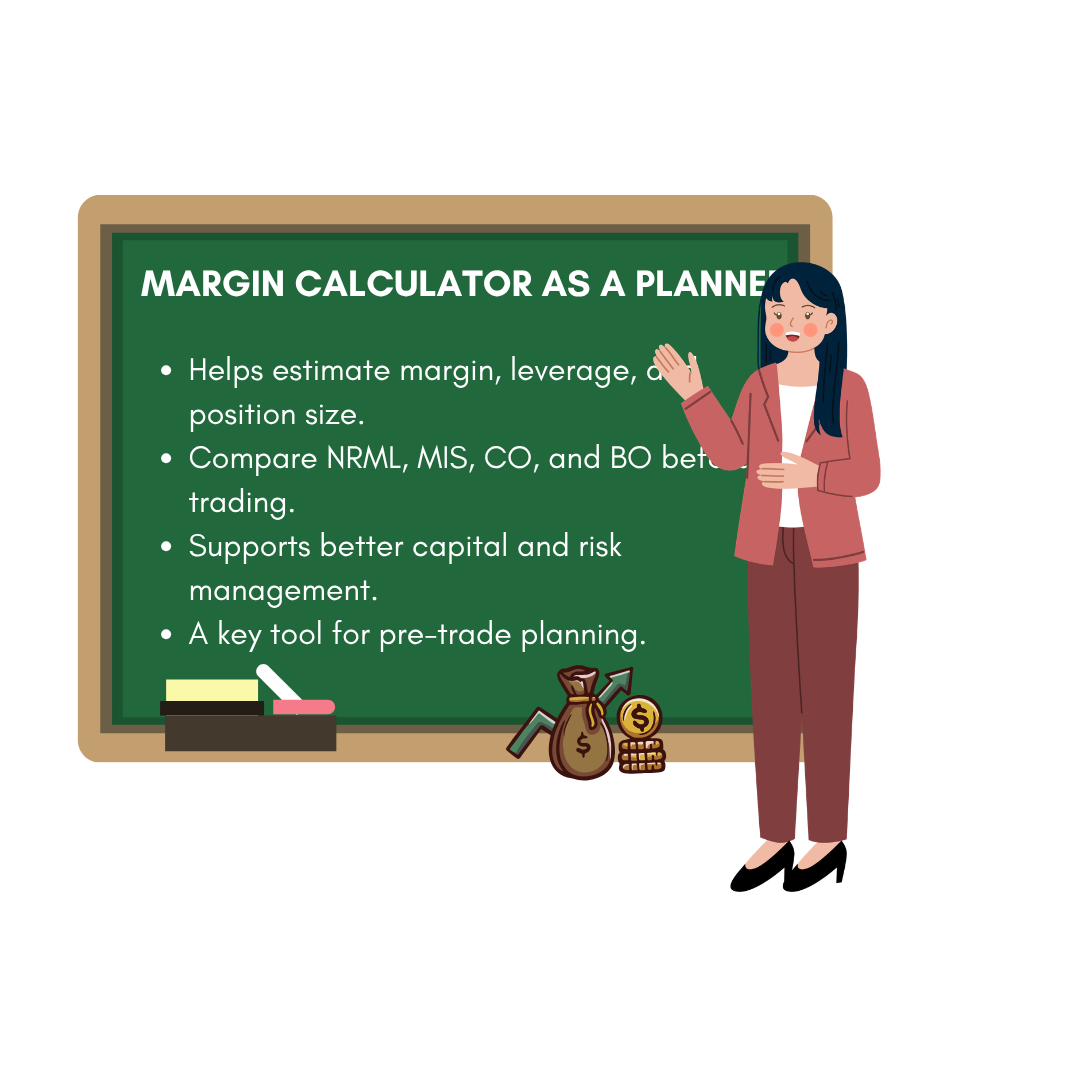
8.7 Margin Calculator as a Pre-Trade Planner
Most traders view the margin calculator as a simple utility—something to check before placing an order. But in reality, it’s much more than that. The margin calculator is a strategic planning tool that helps traders:
- Confirm whether they can afford a position
- Choose the right product type (NRML, MIS, CO, BO)
- Optimize capital usage
- Calculate leverage and risk exposure
Why Planning Matters
Before initiating any trade, a trader must answer three questions:
- How much capital will be blocked?
- How many lots can I afford?
- What is my effective leverage?
The margin calculator answers all three—instantly.
Leverage: The Planning Metric
Leverage is a key output of margin planning. It tells you how much exposure you’re getting for every rupee of margin deployed.
Leverage =Contract Value/Margin Required
Example: Infosys Futures
- Lot Size: 300 shares
- Price: ₹1,550
- Contract Value= 300 × ₹1,550 = ₹4,65,000
- NRML Margin= ₹37,000
- Leverage= ₹4,65,000 ÷ ₹37,000 ≈ 5x
This means for every ₹1 invested as margin, the trader controls ₹12.5 worth of exposure.
Strategic Use Cases
|
Trader Goal |
Margin Calculator Insight |
|
Maximize lots with limited funds |
Use MIS or CO to reduce margin per lot |
|
Plan multi-day positions |
Use NRML and check rollover margin impact |
|
Define risk upfront |
Use CO/BO and input stoploss to reduce margin |
|
Compare leverage across stocks |
Use calculator to find best capital-to-exposure ratio |
Tip: Think Before You Trade
The margin calculator is not the end of your trade—it’s the beginning. Use it to simulate scenarios, compare product types, and plan your capital deployment like a professional.
8.8 Understanding the BO & CO Margin Calculator
Bracket Orders (BO) and Cover Orders (CO) are designed to provide traders a systematic way to manage intraday risk. Both order types have a mandatory stoploss which enables the broker’s risk system to quantify the maximum potential loss in advance. That built-in risk control is the reason that margin requirements for BO and CO are usually lower than regular intraday (MIS) or carry-forward (NRML) trades.
The BO & CO margin calculator is easy to use. This tool is similar to the SPAN calculator for futures and options and helps traders to estimate the capital required to open a position with a given stoploss. Suppose, for example, a trader is looking at a Biocon futures contract for February expiry. Once the relevant contract details such as symbol, expiry date and lot size are chosen, the trader proceeds to calculate the margin. Initially they leave the stoploss field blank.
In case you run the calculator without a stoploss defined, it will automatically recommend a default stoploss level according to the current market price and volatility. In this case the suggested stoploss is ₹403. The trader can then confirm or alter this value and the calculator will adjust the margin requirement. The stoploss here is ₹403 and the margin required to put this trade on is ₹9,062 .
This is far lower than the margin required for the same contract for other product types. Say, the trader carries the position overnight using the NRML product type, the margin would be ₹26,135. Even in MIS which is intraday but without a mandatory stoploss the margin would still be Rs 11,545. Obviously, BO and CO are a more capital efficient way to trade intraday, particularly for those who are disciplined in risk management.
The important thing to get here is that the tighter and more defined your stoploss is, the better your margin gets. But traders should be careful not to place stop-losses too close to the current price, as this can lead to premature exits on normal market noise. The BO & CO calculator is a good compromise between risk control and margin efficiency and a useful instrument for intraday strategies requiring precision and discipline.
Trailing Stop-Loss (TSL): Lock in Profits, Ride Trends
Momentum traders are often faced with a dilemma: how to lock in profits but not get out too soon. That’s when the Trailing Stop-Loss (TSL) comes into play. It is a dynamic risk management tool that moves the stop-loss level up as the price moves in favour of the trade and allows traders to lock in gains while staying in the trend.
Fixed stop losses are static, while a trailing stop loss follows the market. Depending on the trading platform and order type, it can be set manually or automatically. In Cover Orders (CO) and Bracket Orders (BO), brokers usually allow to set TSL at the time of entry.
Why is TSL so important?
Protects profits – As the price rises, the stop-loss moves up, locking in profits.
- Extends trend participation: Traders remain in the trade longer without fear of reversal wiping out profits.
- Reduces emotional exits: Stop-loss modifications are made by the system reducing impulsive decisions.
TSL Mechanics: Step-by-Step Table
|
Price Level |
Initial Stop-Loss |
TSL Adjustment |
New Stop-Loss |
Rationale |
|
₹1,000 |
₹980 |
— |
₹980 |
Entry point; initial risk defined |
|
₹1,020 |
₹980 |
+₹10 |
₹990 |
Price moves up; SL trails upward |
|
₹1,040 |
₹990 |
+₹10 |
₹1,000 |
SL adjusted again to protect gains |
|
₹1,030 |
₹1,000 |
— |
₹1,000 |
No adjustment; price dipped |
|
₹1,050 |
₹1,000 |
+₹10 |
₹1,010 |
SL trails again as price rises |
8.9 Understanding the Trailing Stoploss
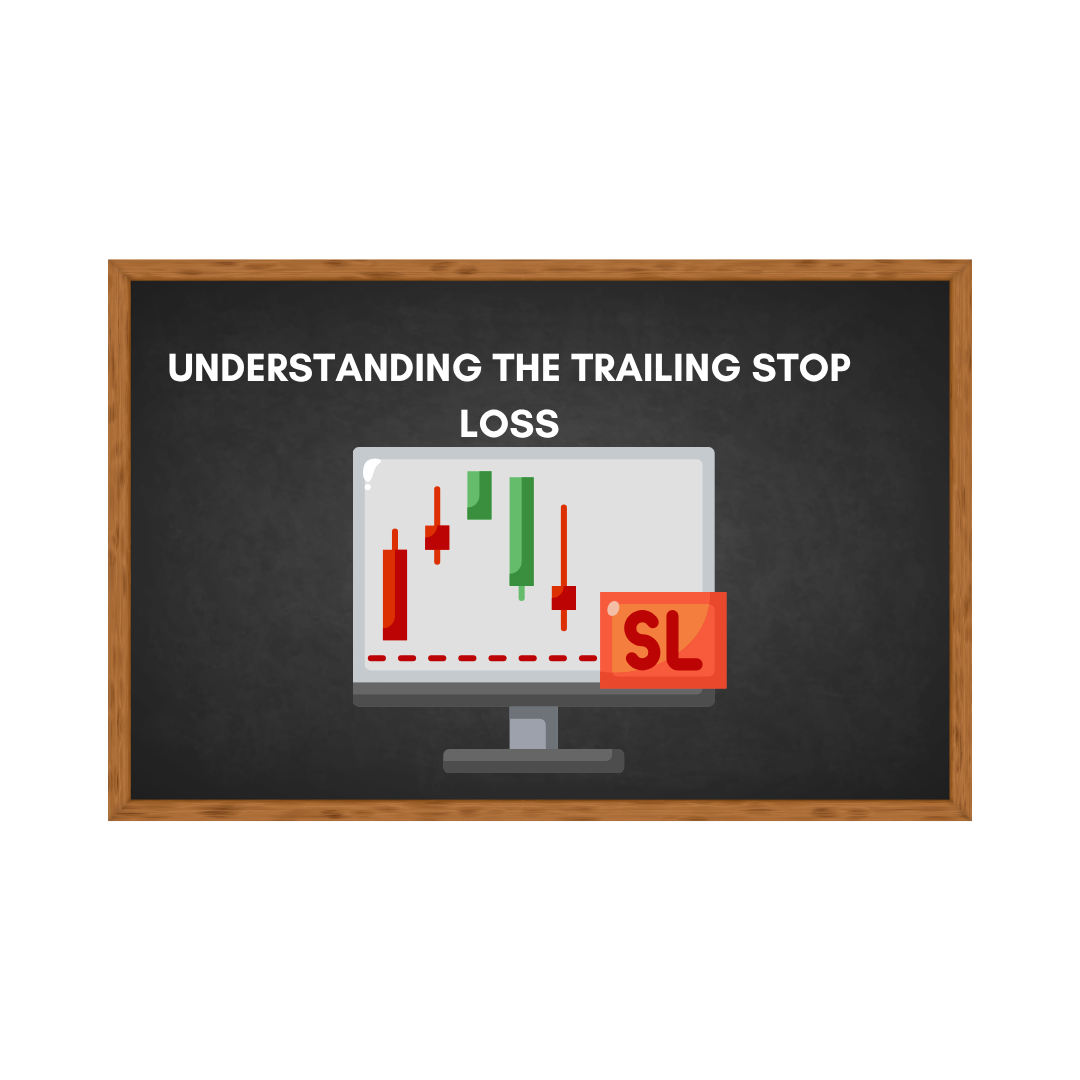
Before closing this chapter, it is worth looking at a technique that can significantly improve trading results, the trailing stoploss. This function is commonly used in bracket orders and is especially useful for traders who want to lock in profits but still allow for some price movement. Many traders have experienced a position moving in their favour and getting some good gains before the trade reverses on them due to volatility and hits the original stoploss, turning a potential profit into a loss.
Let us consider a common case. Let’s say you buy a stock at Rs 250, and you expect it to go to Rs 270. You put a stoploss of ₹ 240 to manage risk. Initially, the trade goes well. The stock goes up to ₹265, close to your target. But then it retraces due to market movement and revert back to ₹240, triggering your stoploss. You are right on the direction but end up exiting the trade in loss. This is quite common and many traders are left wondering how they could have taken profits prior to the turn around.
This is where the idea of a trailing stoploss comes in its own. Instead of leaving your stoploss in one place, you move it up as the price moves in your favour. This way you can lock in some of your unrealised gains and reduce the risk of giving back profits to the market. Sometimes trailing your stoploss can even help you make more than your original target, especially if the trend continues longer than expected.
Let us consider a simple example. Let’s say you buy a long position at ₹2,175 with a stoploss at ₹2,150. You trail your stoploss by ₹15 for every ₹15 the stock moves up. So, when price hits Rs 2,190, you move your stoploss to Rs 2,165. If it goes to Rs 2,205 then you move your stoploss to Rs 2,180 and so on. This way, you are slowly locking in profits while still giving the trade room to breathe.
Your original target might have been ₹2,220. But if the stock rallies to ₹2,235 and reverses, with a trailing stoploss your adjusted stoploss might be at ₹2,220, giving you a better profit than planned. The key is to clearly define your trailing logic, whether it is based on fixed point intervals, percentage moves, or technical indicators such as ATR.
Trailing stoploss is essentially a dynamic risk management tool. It allows traders to stay in winning trades longer, avoid exiting too early and protect profits without having to watch the screen all the time. Master this technique and you can make a meaningful difference to your overall performance, whether you are trading intraday momentum or multi-day breakouts.
8.10 Key Takeaways

- Margin Calculator as a Planning Tool: Margin calculators help traders to know upfront capital requirement before placing a futures order.
- Components of Initial Margin • Initial Margin = SPAN Margin + Exposure Margin • SPAN is a volatility buffer to protect against adverse price risk exposure.
- Margin Needs Driven by Volatility • More volatile stocks require larger margin needs. Less volatile stocks have lower margins. • Margin requirements are contract specific.
- Contract Duration is by Expiry • Futures have a fixed expiry date and positions must be closed out or rolled over before expiry.
- Shares can be held forever, futures cannot.
- Rollover increases risk Traders can roll positions from one expiry to another (eg November -> December) Rollover data can often be an indication of market sentiment
- Lower Risk & Margin Spreads • Spreading (buy one expiry and sell another) is one method of hedging risk. The contracts offset each other so the spreads are much lower in margin
- Broker Risk management system (RMS) •RMS checks margin adequacy, order size and compliance before sending trades to exchange.
- Better margin allocation = More clarity (timeframe, stoploss)
- Types of objects Define Risk & Margin.
NRML: Maximum margin, carry forward.
MIS:Daytime margin shrank.
CO: Lower margin still with mandatory stoploss intraday.BO: Intraday with stoploss+target+trailing Margin efficient and auto
- Margin Performance of BO & CO § Mandatory stoploss reduces margin required Eg:- Margin required for Biocon futures under BO/CO was way lesser as compared to NRML or MIS.
- Trailing Stoploss Protects Profit • Stoploss rises as price rises locking in profits and opening up upside. • Prevents volatility from turning winning trades into losers.
8.11 Fun Activity

You want to trade Tata Motors Futures (lot size = 1,500 shares). The margin calculator shows:
- SPAN Margin = ₹52,500
- Exposure Margin = ₹35,000
Your task: Answer these quick questions
Questions
- What is the Initial Margin required for 1 lot?
- If you want to trade 3 lots, how much margin is needed?
- If you only have ₹1,00,000 in your account, can you afford 1 lot?
Answers
- Initial Margin = SPAN + Exposure = ₹87,500
- For 3 lots = ₹87,500 × 3 = ₹2,62,500
- With ₹1,00,000,you can afford 1 lot, since the margin required is ₹87,500 — leaving a buffer of ₹12,500. (You could not, however, afford 2 lots, which would require ₹1,75,000.)