
 5paisa कैपिटल लिमिटेड

देखने के लिए ब्रेकआउट स्टॉक: होटल स्टॉक सममितीय त्रिकोण पैटर्न से बाहर हो जाता है
नूपुर द्वारा


 इंद्रशिष मित्र
- 0 मिनट में पढ़ें
अंतिम अपडेट: 23 अक्टूबर 2026 - 06:05 pm

हाल के सत्रों में व्यापक बाजार अस्थिर रहा है, लेकिन स्टॉक-विशिष्ट अवसर लगातार उभर रहे हैं क्योंकि कई कंपनियां मजबूत कीमत कार्रवाई करती हैं और तकनीकी संरचनाओं में सुधार करती हैं. One such stock is Cyient (CYIENT), which has witnessed a strong breakout on the daily chart, supported by a sharp rise in volume and improving momentum.
Cyient is a technology and engineering solutions company providing engineering, manufacturing, digital and technology services to clients across industries, including aerospace, defence, transportation, telecommunications and utilities.
The stock has attracted buying interest after recovering from its March lows and gradually building a base over the following months. After an extended consolidation phase, Cyient recovered towards its earlier resistance zone near Rs 1,200–1,220. The recent price action indicates renewed buying interest, with the stock moving above this important resistance level.
From a technical perspective, Cyient has formed a cup-and-handle pattern on the daily chart. The stock declined towards its March lows before gradually recovering and forming a broad, rounded base. The subsequent rally brought the price back towards the earlier resistance zone near Rs 1,200–1,220, followed by a shorter consolidation phase that formed the handle.
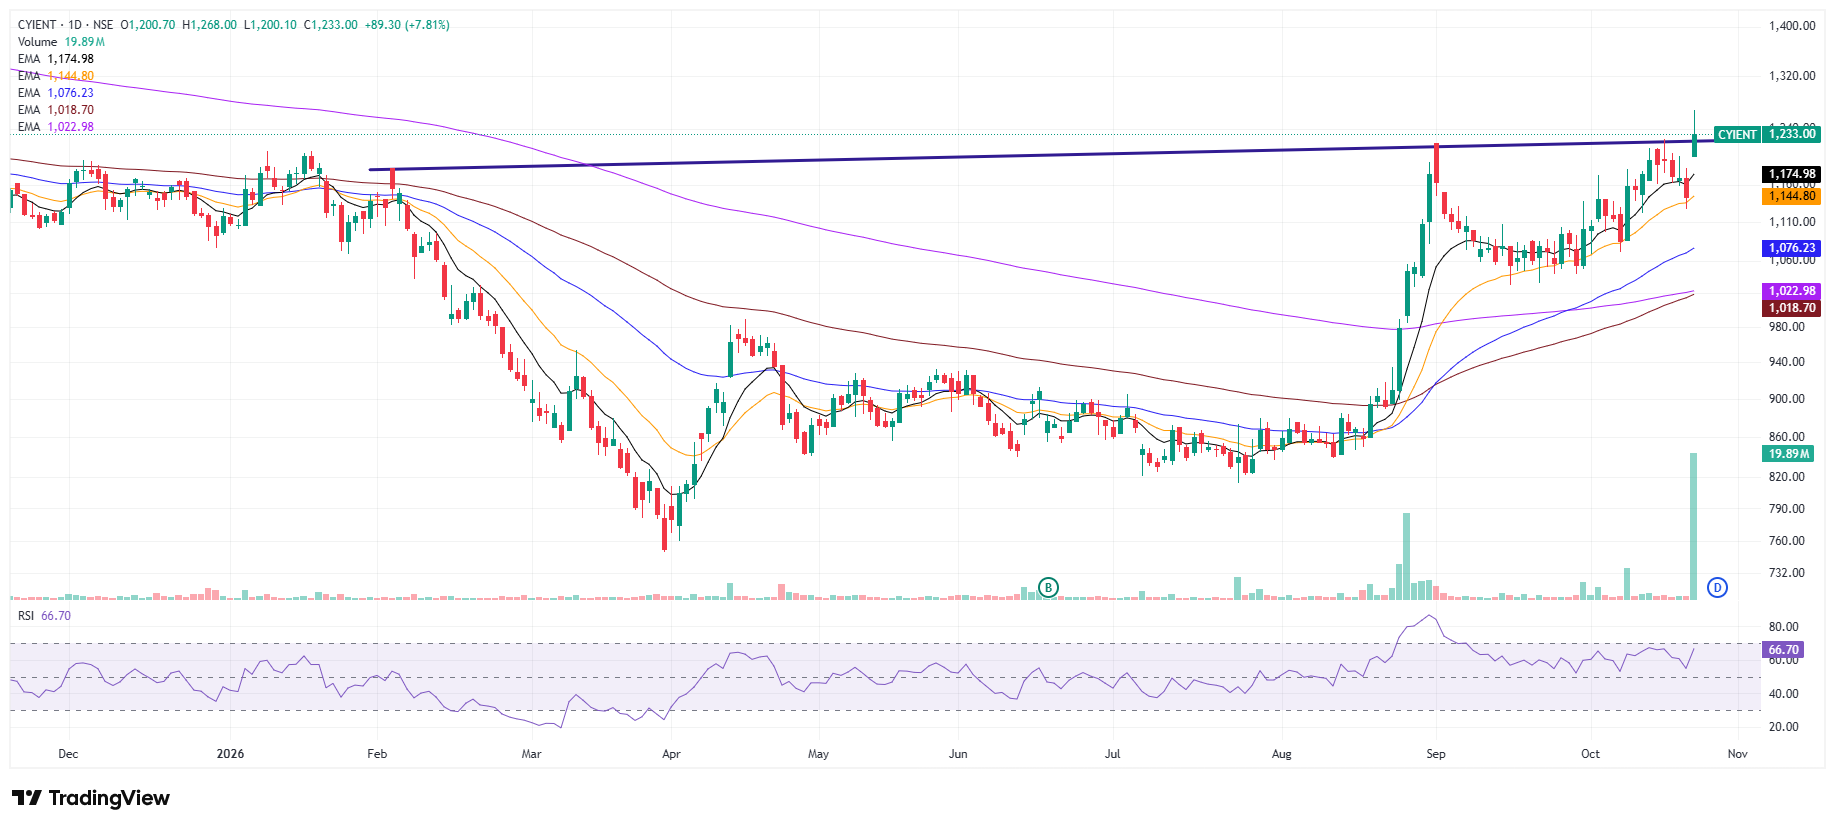
The stock has now broken above the Rs 1,200–1,220 resistance zone with a strong bullish candle and closed at Rs 1,233, gaining 7.81%. Volume surged to approximately 19.89 million shares, indicating strong participation during the breakout. A sustained move above this zone could confirm the completion of the pattern and support further upside.
तकनीकी सेटअप कई समय फ्रेम में सहायक बना रहता है. Cyient is trading above its key short-, medium- and long-term EMAs, with the 20 EMA around Rs 1,174.98, 50 EMA near Rs 1,144.80 and 100 EMA at Rs 1,076.23. The longer-term moving averages are also positioned below the current market price, supporting the improving trend.
The 14-period daily RSI stands at 66.70, reflecting strong bullish momentum while remaining below the conventional overbought threshold of 70. The sharp increase in volume, positive EMA alignment and breakout above the resistance zone indicate strengthening buying pressure. Sustaining above the breakout level will be important for further upside.
Considering the breakout from the cup-and-handle formation, sustaining above the Rs 1,200–1,220 zone would keep the positive momentum intact. ऊपर की ओर, स्टॉक 1,280-1,320 की रेंज की ओर बढ़ सकता है, इसके बाद अगर ब्रेकआउट लगातार खरीदारी के इंटरेस्ट के साथ बना रहता है, तो उच्च स्तर हो सकता है.
ट्रेडर डाउनसाइड रिस्क को मैनेज करने के लिए लगभग ₹1,170 का स्टॉप लॉस रख सकते हैं. A sustained hold above Rs 1,200 would strengthen the breakout structure, while a move back below the breakout zone could weaken the setup.
डिस्क्लेमर: सिक्योरिटीज़ मार्केट में इन्वेस्टमेंट मार्केट जोखिमों के अधीन है, इन्वेस्ट करने से पहले सभी संबंधित डॉक्यूमेंट को ध्यान से पढ़ें. विस्तृत डिस्क्लेमर के लिए, कृपया यहां क्लिक करें.